Two Phases
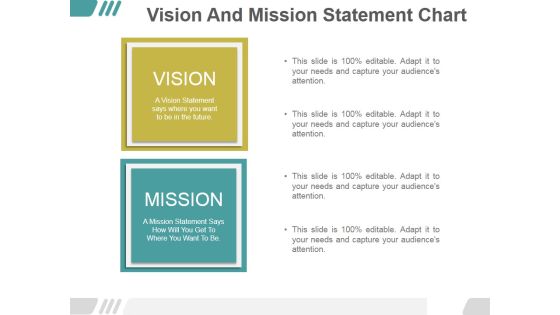
Vision And Mission Statement Chart Ppt PowerPoint Presentation Samples
This is a vision and mission statement chart ppt powerpoint presentation samples. This is a two stage process. The stages in this process are vision, business, marketing, mission, management.

Vision And Mission Statement Chart Ppt PowerPoint Presentation Model Demonstration
This is a vision and mission statement chart ppt powerpoint presentation model demonstration. This is a two stage process. The stages in this process are vision, mission, business, strategy, management.

Line Chart Ppt PowerPoint Presentation File Graphic Images
This is a line chart ppt powerpoint presentation file graphic images. This is a two stage process. The stages in this process are business, strategy, marketing, planning, growth strategy, finance.

Line Chart Ppt Powerpoint Presentation Infographic Template Format
This is a line chart ppt powerpoint presentation infographic template format. This is a two stage process. The stages in this process are jan, feb, mar, apr, may, financial.
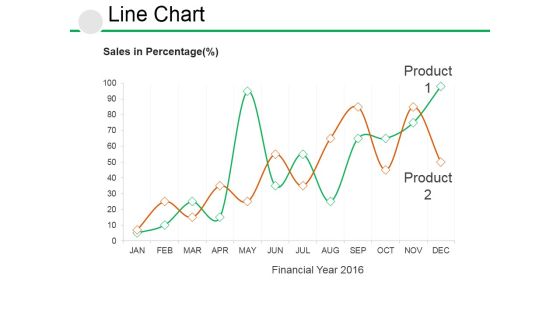
Line Chart Ppt PowerPoint Presentation Visual Aids Example File
This is a line chart ppt powerpoint presentation visual aids example file. This is a two stage process. The stages in this process are business, growth, strategy, analysis, management.

Line Chart Ppt PowerPoint Presentation Model Design Templates
This is a line chart ppt powerpoint presentation model design templates. This is a two stage process. The stages in this process are sales in percentage, financial years, product.

Area Chart Ppt PowerPoint Presentation Show Layout Ideas
This is a area chart ppt powerpoint presentation show layout ideas. This is a two stage process. The stages in this process are product, in percentage, financial year, growth.
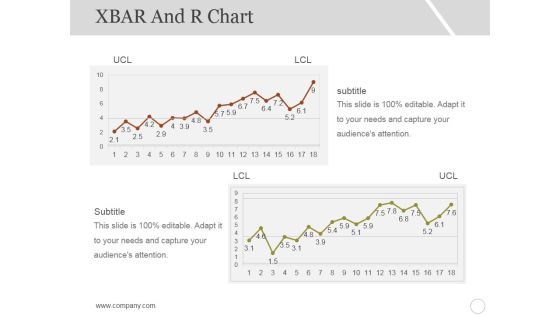
Xbar And R Chart Ppt PowerPoint Presentation Inspiration Styles
This is a xbar and r chart ppt powerpoint presentation inspiration styles. This is a two stage process. The stages in this process are subtitle, lcl, ucl, growth, graph.
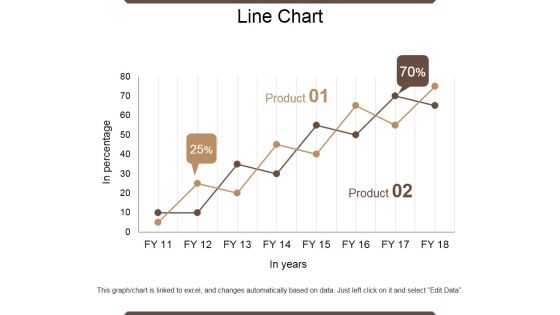
Line Chart Ppt PowerPoint Presentation Outline Infographic Template
This is a line chart ppt powerpoint presentation outline infographic template. This is a two stage process. The stages in this process are in percentage, product, in year, growth, success.

Area Chart Ppt PowerPoint Presentation Infographic Template Samples
This is a area chart ppt powerpoint presentation infographic template samples. This is a two stage process. The stages in this process are in percentage product, business, marketing, growth.
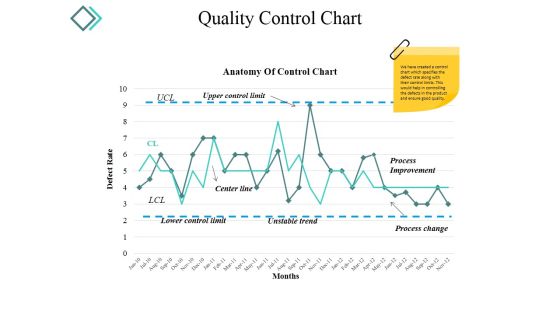
Quality Control Chart Ppt PowerPoint Presentation Model Background Images
This is a quality control chart ppt powerpoint presentation model background images. This is a two stage process. The stages in this process are center line, process improvement, process change, unstable trend.
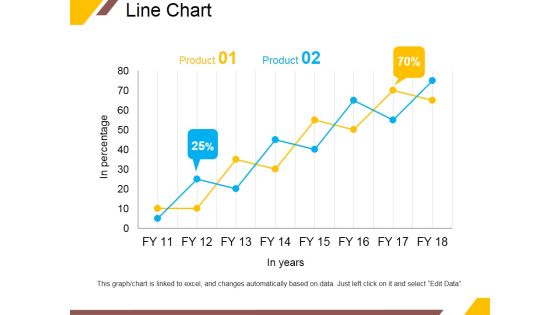
Line Chart Ppt PowerPoint Presentation Portfolio Infographic Template
This is a line chart ppt powerpoint presentation portfolio infographic template. This is a two stage process. The stages in this process are product, in years, business, percentage, growth.

Area Chart Ppt PowerPoint Presentation File Graphic Tips
This is a area chart ppt powerpoint presentation file graphic tips. This is a two stage process. The stages in this process are product, in percentage, financial year, business, growth.
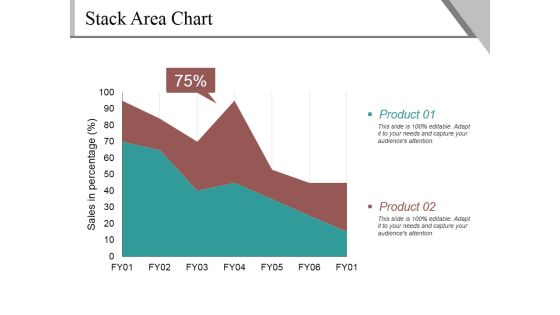
Stack Area Chart Ppt PowerPoint Presentation Gallery Guidelines
This is a stack area chart ppt powerpoint presentation gallery guidelines. This is a two stage process. The stages in this process are sales in percentage, product, percentage, business.

Stack Area Chart Ppt PowerPoint Presentation Example File
This is a stack area chart ppt powerpoint presentation example file. This is a two stage process. The stages in this process are product, sales in percentage, percentage, finance.

Line Chart Ppt PowerPoint Presentation Portfolio Design Templates
This is a line chart ppt powerpoint presentation portfolio design templates. This is a two stage process. The stages in this process are in percentage, in years, percentage, business, graph.

Column Chart Ppt PowerPoint Presentation Gallery Graphics Example
This is a column chart ppt powerpoint presentation gallery graphics example. This is a two stage process. The stages in this process are expenditure in, years, business, marketing, growth.
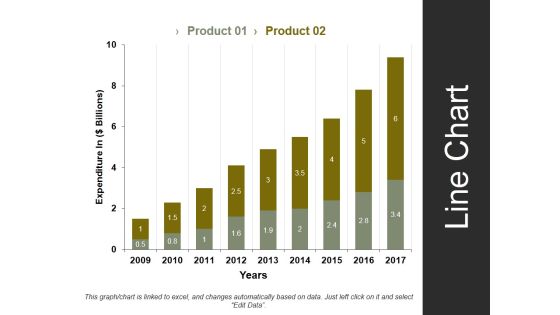
Line Chart Template 1 Ppt PowerPoint Presentation Styles Summary
This is a line chart template 1 ppt powerpoint presentation styles summary. This is a two stage process. The stages in this process are expenditure in, years, business, marketing, strategy.

Column Chart Ppt PowerPoint Presentation Model Graphics Download
This is a column chart ppt powerpoint presentation model graphics download. This is a two stage process. The stages in this process are product, financial year, sales in percentage, bar graph, success.

Scatter Bubble Chart Ppt PowerPoint Presentation Styles Objects
This is a scatter bubble chart ppt powerpoint presentation styles objects. This is a two stage process. The stages in this process are product, in price, highest sale, percentage, finance.

Column Chart Ppt PowerPoint Presentation Gallery Slide Portrait
This is a column chart ppt powerpoint presentation gallery slide portrait. This is a two stage process. The stages in this process are sales in percentage, financial year, product, bar graph, growth.
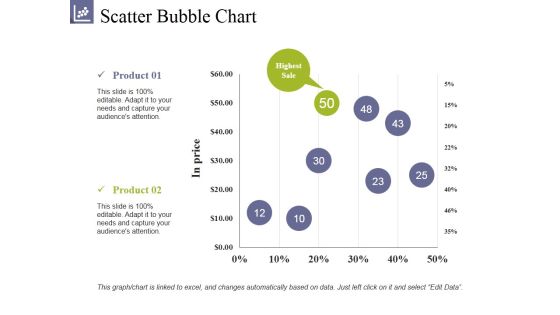
Scatter Bubble Chart Ppt PowerPoint Presentation Summary Clipart
This is a scatter bubble chart ppt powerpoint presentation summary clipart. This is a two stage process. The stages in this process are product, highest sale, in prices, growth, success.

Bar Chart Ppt PowerPoint Presentation Infographics Format Ideas
This is a bar chart ppt powerpoint presentation infographics format ideas. This is a two stage process. The stages in this process are bar graph, product, financial year, sales in percentage.

Bubble Chart Ppt PowerPoint Presentation Layouts Clipart Images
This is a bubble chart ppt powerpoint presentation layouts clipart images. This is a two stage process. The stages in this process are business, marketing, profit, innovation, technology, idea bulb.

Portfolio Selection Allocation Template 2 Ppt PowerPoint Presentation Gallery Themes
This is a portfolio selection allocation template 2 ppt powerpoint presentation gallery themes. This is a two stage process. The stages in this process are cash, bonds, stocks, alternatives, value.

Force Field Analysis Template 2 Ppt PowerPoint Presentation Themes
This is a force field analysis template 2 ppt powerpoint presentation themes. This is a two stage process. The stages in this process are restraining forces, driving forces, estimated strength, equilibrium.

Benefits Cost Analysis Chart Ppt Powerpoint Presentation Summary Visuals
This is a balance scale with cost and benefits ppt powerpoint presentation show. This is a two stage process. The stages in this process are business, finance, marketing, strategy, compare, management.
Trade Show Timeline Contd Sales Message Ppt PowerPoint Presentation Icon Diagrams
This is a trade show timeline contd sales message ppt powerpoint presentation icon diagrams. This is a two stage process. The stages in this process are sales message, business, planning, strategy, marketing.
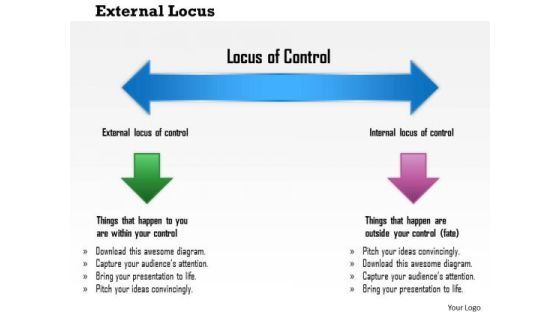
Business Framework External Locus PowerPoint Presentation
This business framework PPT diagram has been crafted with graphic of two directional linear arrow diagram. This PPT diagram contains the linear flow. This PPT diagram may be used for business strategy and finance transformation.

Area Chart Finance Ppt PowerPoint Presentation Infographic Template Model
This is a area chart finance ppt powerpoint presentation infographic template model. This is a two stage process. The stages in this process are finance, marketing, management, investment, analysis.

Column Chart Template 2 Ppt PowerPoint Presentation Infographic Template Example Introduction
This is a column chart template 2 ppt powerpoint presentation infographic template example introduction. This is a two stage process. The stages in this process are column chart, finance, analysis, marketing, strategy.

Technology Planning Diagram Ppt Slides
This is a technology planning diagram ppt slides. This is a two stage process. The stages in this process are business mission objectives and gaps, technology plan, technology evaluation, drives, informs.

Business Trading Diagram Ppt Design
This is a business trading diagram ppt design. This is a two stage process. The stages in this process are store, cutting, design, quality, manufacture, the major diff, costs of goods, ending merchandise.
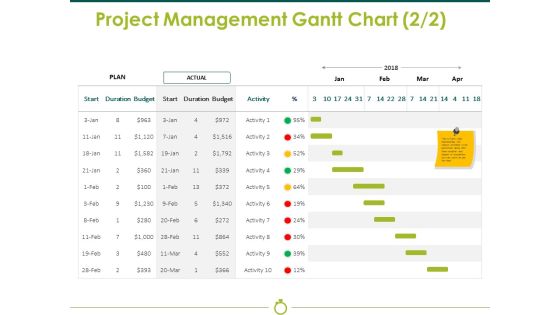
Project Management Gantt Chart Template 2 Ppt PowerPoint Presentation Show Styles
This is a project management gantt chart template 2 ppt powerpoint presentation show styles. This is a two stage process. The stages in this process are plan, actual, budget, duration, start.

Business Framework Financial System PowerPoint Presentation
Define the financial system in your presentation with this unique diagram. This PPT diagram contain the graphic of two staged linear flow chart. This PPT diagram may be used for finance and business presentations.
Situational Analysis Basic Target Concept Ppt PowerPoint Presentation Icon Master Slide
This is a situational analysis basic target concept ppt powerpoint presentation icon master slide. This is a two stage process. The stages in this process are software support analysis, vulnerability analysis, identify optimization potential, business strategy, formation of project team.

Scatter With Smooth Lines And Markers Ppt PowerPoint Presentation Diagram Lists
This is a scatter with smooth lines and markers ppt powerpoint presentation diagram lists. This is a two stage process. The stages in this process are finance, marketing, analysis, business, investment.

Activity Ratios Template 1 Ppt PowerPoint Presentation Icon File Formats
This is a activity ratios template 1 ppt powerpoint presentation icon file formats. This is a two stage process. The stages in this process are finance, analysis, compere, business, marketing.

PowerPoint Theme Gears Process Business Ppt Slides
PowerPoint Theme Gears Process Business PPT Slides-This PowerPoint Template shows you two Gears connected to each other targeting Business aim. This PowerPoint Template imitates the concept of Finance, Business, Team Work etc.-PowerPoint Theme Gears Process Business PPT Slides

Crm Marketing Dashboard Ppt PowerPoint Presentation Icon Graphic Tips
This is a crm marketing dashboard ppt powerpoint presentation icon graphic tips. This is a two stage process. The stages in this process are leads per week, leads this week.
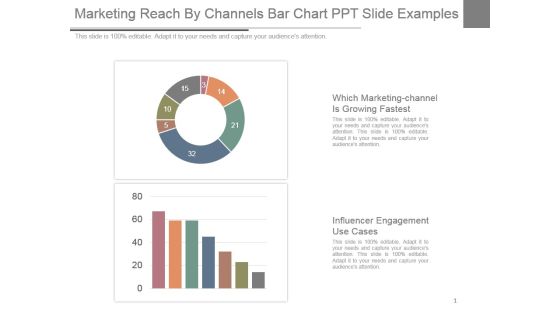
Marketing Reach By Channels Bar Chart Ppt Slide Examples
This is a marketing reach by channels bar chart ppt slide examples. This is a two stage process. The stages in this process are which marketing-channel is growing fastest, influencer engagement use cases.

Analysis Techniques Pareto Analysis Ppt PowerPoint Presentation Professional Icons
This is a analysis techniques pareto analysis ppt powerpoint presentation professional icons. This is a two stage process. The stages in this process are bar chart, finance, marketing, business, analysis.

Data Collection Histograms Ppt PowerPoint Presentation Icon Slides
This is a data collection histograms ppt powerpoint presentation icon slides. This is a two stage process. The stages in this process are bar chart, finance, marketing, business, analysis.
Monthly Social Media Dashboard Ppt PowerPoint Presentation Icon Gallery
This is a monthly social media dashboard ppt powerpoint presentation icon gallery. This is a two stage process. The stages in this process are facebook, social traffic and conversion, referral traffic, conversions, key social metrics, pinterest, you tube.
Solvency Ratios Template Ppt PowerPoint Presentation Inspiration Icons
This is a solvency ratios template ppt powerpoint presentation inspiration icons. This is a two stage process. The stages in this process are debt equity ratio, total liabilities total equity, time interest earned ratio, ebit interest expense.
Sales Activities Dashboard Ppt PowerPoint Presentation Icon Graphics
This is a sales activities dashboard ppt powerpoint presentation icon graphics. This is a two stage process. The stages in this process are business, finance, management, analysis, budget, actual.

Addressable Market In Sector Ppt PowerPoint Presentation Icon Infographic Template
This is a addressable market in sector ppt powerpoint presentation icon infographic template. This is a two stage process. The stages in this process are business, marketing, strategy, planning, finance.
Economic Order Quantity Eoq Model Ppt PowerPoint Presentation Icon Deck
This is a economic order quantity eoq model ppt powerpoint presentation icon deck. This is a two stage process. The stages in this process are order quantity, reorder point.
Stacked Bar Template 1 Ppt PowerPoint Presentation Icon Portfolio
This is a stacked bar template 1 ppt powerpoint presentation icon portfolio. This is a two stage process. The stages in this process are business, marketing, finance, graph, strategy.

Clustered Bar Process Analysis Ppt PowerPoint Presentation Icon Influencers
This is a clustered bar process analysis ppt powerpoint presentation icon influencers. This is a two stage process. The stages in this process are clustered bar, profit, product, finance, business.
Open High Low Close Finance Ppt PowerPoint Presentation Icon Deck
This is a open high low close finance ppt powerpoint presentation icon deck. This is a two stage process. The stages in this process are finance, analysis, business, investment, marketing.

Budgeting Planned Actual Comparison Ppt PowerPoint Presentation Icon Shapes
This is a budgeting planned actual comparison ppt powerpoint presentation icon shapes. This is a two stage process. The stages in this process are finance, marketing, management, investment, product, percentage.
Stacked Column Marketing Planning Ppt PowerPoint Presentation Model Icon
This is a stacked column marketing planning ppt powerpoint presentation model icon. This is a two stage process. The stages in this process are finance, analysis, business, investment, marketing.

Business Diagram Business Pillar Success Temple Info Graphic Presentation Template
This Power Point template has been designed with business pillars info graphic. This graphic contains the two option pillars to show the success related concepts. Use this pillar diagram in your business presentations.
Market Drivers Global Market Growth Ppt PowerPoint Presentation Slides Icons
This is a market drivers global market growth ppt powerpoint presentation slides icons. This is a two stage process. The stages in this process are global market growth, business, marketing, market drivers, growth.
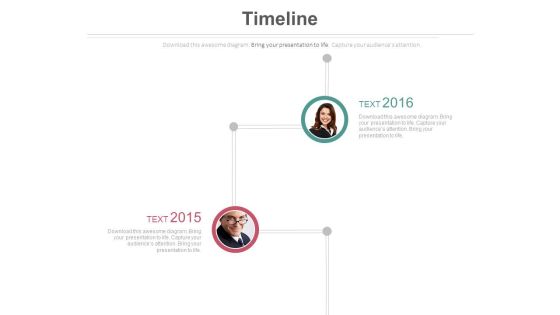
Productive Employees Timeline Diagram Powerpoint Slides
This PowerPoint template has been designed with two employee?s pictures with years. This PPT slide may be helpful to display productive employees. Download this PowerPoint timeline template to make impressive presentations.

Risk Analysis Complex Ppt PowerPoint Presentation Show Themes
This is a risk analysis complex ppt powerpoint presentation show themes. This is a two stage process. The stages in this process are description of risk, control measures, risk analysis, additional control.

Volume Open High Low Close Chart Ppt PowerPoint Presentation Pictures Slideshow
This is a volume open high low close chart ppt powerpoint presentation pictures slideshow. This is a two stage process. The stages in this process are volume, open, high, low, close, chart.
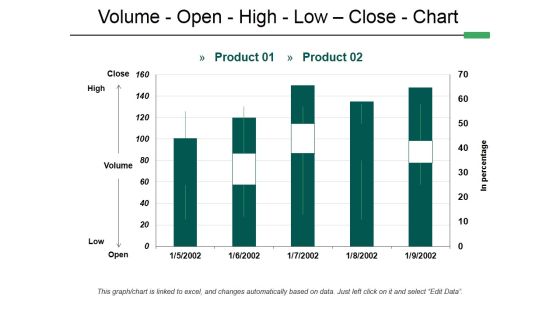
Volume Open High Low Close Chart Ppt PowerPoint Presentation Infographic Template Guidelines
This is a volume open high low close chart ppt powerpoint presentation infographic template guidelines. This is a two stage process. The stages in this process are volume, open, high, low, close, chart.

Effective Negotiation Strategies And Tactics Ppt Powerpoint Presentation Themes
This is a effective negotiation strategies and tactics ppt powerpoint presentation themes. This is a two stage process. The stages in this process are contract management, contract negotiation, deal making.

Volume Open High Low Close Chart Ppt PowerPoint Presentation Layouts Background Image
This is a volume open high low close chart ppt powerpoint presentation layouts background image. This is a two stage process. The stages in this process are close, high, volume, low, open.

Volume Open High Low Close Chart Ppt PowerPoint Presentation File Graphics Template
This is a volume open high low close chart ppt powerpoint presentation file graphics template. This is a two stage process. The stages in this process are close, high, volume, low, open, product.

Project Management Gantt Chart Template 1 Ppt PowerPoint Presentation Gallery Graphics Template
This is a project management gantt chart template 1 ppt powerpoint presentation gallery graphics template. This is a two stage process. The stages in this process are start, duration, complete, business, finance.
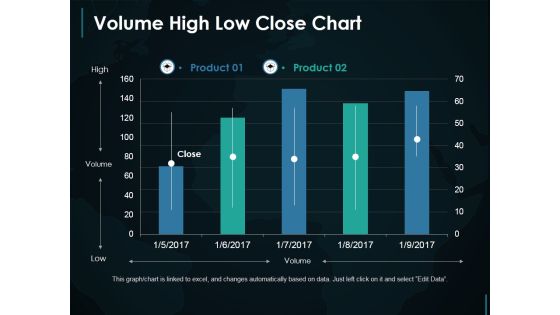
Volume High Low Close Chart Ppt PowerPoint Presentation Slides Example File
This is a volume high low close chart ppt powerpoint presentation slides example file. This is a two stage process. The stages in this process are high, volume, low.

Volume High Low Close Chart Ppt PowerPoint Presentation Visual Aids Slides
This is a volume high low close chart ppt powerpoint presentation visual aids slides. This is a two stage process. The stages in this process are bar graph, marketing, strategy, finance, planning.
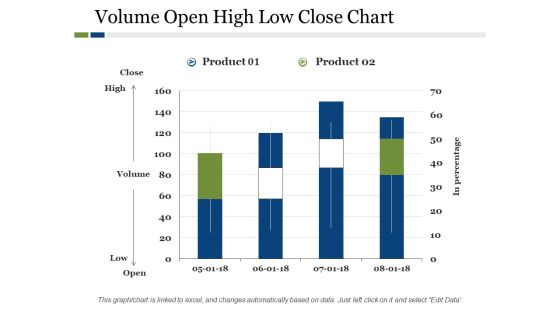
Volume Open High Low Close Chart Ppt PowerPoint Presentation Outline Mockup
This is a volume open high low close chart ppt powerpoint presentation outline mockup. This is a two stage process. The stages in this process are product, high, low, in percentage, volume.

Volume Open High Low Close Chart Finance Ppt PowerPoint Presentation Gallery Graphic Tips
This is a volume open high low close chart finance ppt powerpoint presentation gallery graphic tips. This is a two stage process. The stages in this process are finance, analysis, business, investment, marketing.

break even chart showing contribution margin ppt powerpoint presentation professional templates
This is a break even chart showing contribution margin ppt powerpoint presentation professional templates. This is a two stage process. The stages in this process are break even point,break even analysis,break even level.

Quantitative Bar Chart For Data Analysis Ppt PowerPoint Presentation Model Graphic Tips
This is a quantitative bar chart for data analysis ppt powerpoint presentation model graphic tips. This is a two stage process. The stages in this process are financial analysis, quantitative, statistical modelling.

Clustered Column Ppt PowerPoint Presentation Icon Design Inspiration
This is a clustered column ppt powerpoint presentation icon design inspiration. This is a two stage process. The stages in this process are product, financial year, sales in percentage, clustered column.
Market Segmentation Evaluation Ppt PowerPoint Presentation Icon Pictures
This is a market segmentation evaluation ppt powerpoint presentation icon pictures. This is a two stage process. The stages in this process are net profit, in usd millions, market sales, business, marketing.
Quarter Track Record Ppt PowerPoint Presentation Icon Files
This is a quarter track record ppt powerpoint presentation icon files. This is a two stage process. The stages in this process are quarter, track record, business, marketing, presentation.

How Much Money We Need Ppt PowerPoint Presentation Layouts Themes
This is a how much money we need ppt powerpoint presentation layouts themes. This is a two stage process. The stages in this process are how much are we raising, how will we spend the money, production, marketing.
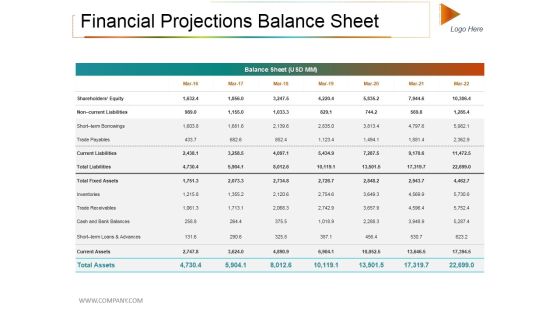
Financial Projections Balance Sheet Ppt PowerPoint Presentation Infographic Template Themes
This is a financial projections balance sheet ppt powerpoint presentation infographic template themes. This is a two stage process. The stages in this process are balance sheet, trade payable, total fixed assets, current assets.
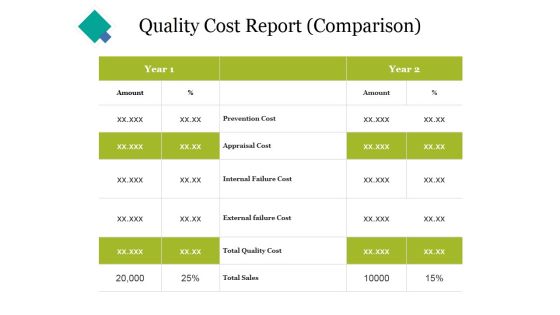
Quality Cost Report Comparison Ppt PowerPoint Presentation Portfolio Themes
This is a quality cost report comparison ppt powerpoint presentation portfolio themes. This is a two stage process. The stages in this process are prevention cost, appraisal cost, internal failure cost, external failure cost, total quality cost.

Customer Acquisition Campaigns Ppt PowerPoint Presentation Summary Themes
This is a customer acquisition campaigns ppt powerpoint presentation summary themes. This is a two stage process. The stages in this process are offline marketing, online marketing, events, radio, social media.

Cost Performance Index Ppt PowerPoint Presentation Infographics Themes
This is a cost performance index ppt powerpoint presentation infographics themes. This is a two stage process. The stages in this process are cost performance index, ev term, value, finance.

Column Chart Employee Value Proposition Ppt PowerPoint Presentation Slides Graphics Design
This is a column chart employee value proposition ppt powerpoint presentation slides graphics design. This is a two stage process. The stages in this process are business, management, strategy, analysis, marketing.

Boys And Girls Participants Details Chart Ppt Powerpoint Presentation Portfolio Layout Ideas
This is a boys and girls participants details chart ppt powerpoint presentation portfolio layout ideas. This is a two stage process. The stages in this process are list of participants, list of members, list of contributors.
Revenue Cost Per Employee Comparison Ppt PowerPoint Presentation Icon Graphics Tutorials
This is a revenue cost per employee comparison ppt powerpoint presentation icon graphics tutorials. This is a two stage process. The stages in this process are revenue and cost per employee comparison, line chart, business, marketing, success,
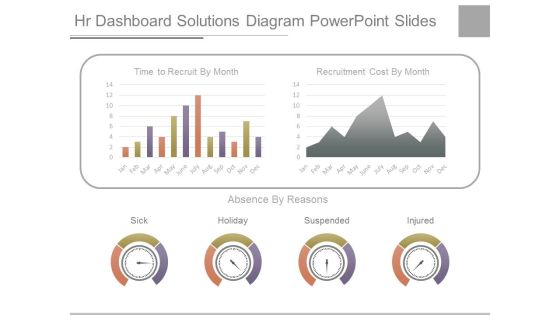
Hr Dashboard Solutions Diagram Powerpoint Slides
This is a hr dashboard solutions diagram powerpoint slides. This is a two stage process. The stages in this process are time to recruit by month, recruitment cost by month, sick, holiday, suspended, injured.
Transformation Map 2 Years Ppt PowerPoint Presentation Icon Background Image
This is a transformation map 2 years ppt powerpoint presentation icon background image. This is a two stage process. The stages in this process are timeline, process, management, planning, business.

Bar Chart Ppt PowerPoint Presentation Styles Graphics Tutorials Ppt PowerPoint Presentation Slides Gallery
This is a bar chart ppt powerpoint presentation styles graphics tutorials ppt powerpoint presentation slides gallery. This is a two stage process. The stages in this process are bar graph, growth, success, business, marketing.
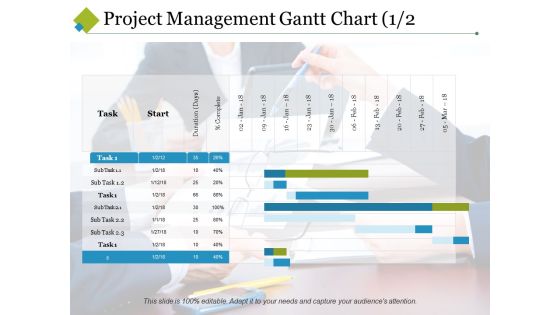
Project Management Gantt Chart Template 1 Ppt PowerPoint Presentation Visual Aids Summary
This is a project management gantt chart template 1 ppt powerpoint presentation visual aids summary. This is a two stage process. The stages in this process are start, task, sub task, duration, complete.

Supply Chain Management Flow Chart Ppt PowerPoint Presentation Gallery Pictures Cpb
This is a supply chain management flow chart ppt powerpoint presentation gallery pictures cpb. This is a two stage process. The stages in this process are supply chain management flow chart.

Business Diagram Circular Nine Stages Puzzle Diagram Presentation Template
This power point image template has been crafted with graphic of eight staged circular puzzle. This two color puzzle contains eight different stages for business process representation. Use this image for your business presentations.
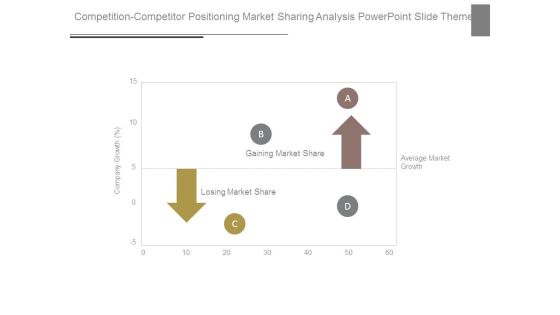
Competition Competitor Positioning Market Sharing Analysis Powerpoint Slide Themes
This is a competition competitor positioning market sharing analysis powerpoint slide themes. This is a two stage process. The stages in this process are company growth, gaining market share, losing market share, average market growth.

Democratic Leadership Advantages And Disadvantages Ppt PowerPoint Presentation Themes
This is a democratic leadership advantages and disadvantages ppt powerpoint presentation themes. This is a two stage process. The stages in this process are advantages of democratic leadership style, disadvantages of democratic leadership style.

Market Segmentation Is Ppt PowerPoint Presentation File Themes
This is a market segmentation is ppt powerpoint presentation file themes. This is a two stage process. The stages in this process are market segmentation , business, marketing, management, strategy.

Project Cost Retainer Team Ppt PowerPoint Presentation Gallery Themes
This is a project cost retainer team ppt powerpoint presentation gallery themes. This is a two stage process. The stages in this process are business, marketing, planning, no minimum, key benefits.

Meeting Planning Company Ppt PowerPoint Presentation Slides Themes Cpb
This is a meeting planning company ppt powerpoint presentation slides themes cpb. This is a two stage process. The stages in this process are meeting planning company, business, marketing, management.
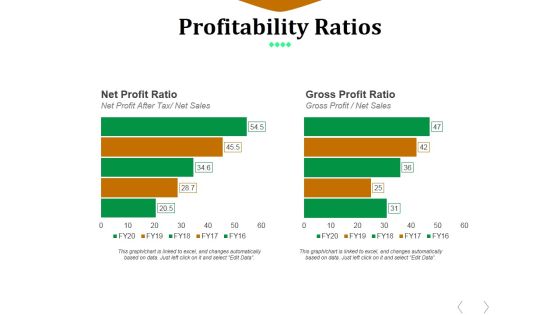
Profitability Ratios Template 2 Ppt PowerPoint Presentation Diagram Ppt
This is a profitability ratios template 2 ppt powerpoint presentation diagram ppt. This is a two stage process. The stages in this process are net profit ratio, gross profit ratio, net profit after tax, net sales.
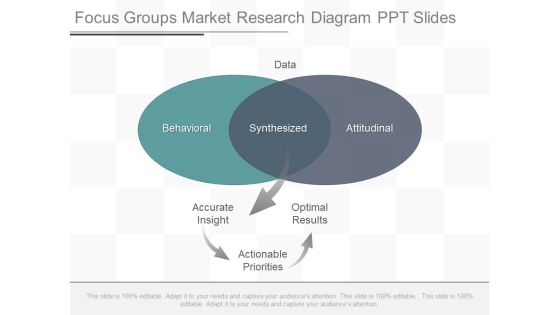
Focus Groups Market Research Diagram Ppt Slides
This is a focus groups market research diagram ppt slides. This is a two stage process. The stages in this process are data, behavioral, synthesized, attitudinal, accurate insight, optimal results, actionable priorities.

Big Data Ecosystem Sample Diagram Ppt Slides
This is a big data ecosystem sample diagram ppt slides. This is a two stage process. The stages in this process are apps, devices, apis, sources, business, experience, exits, research.
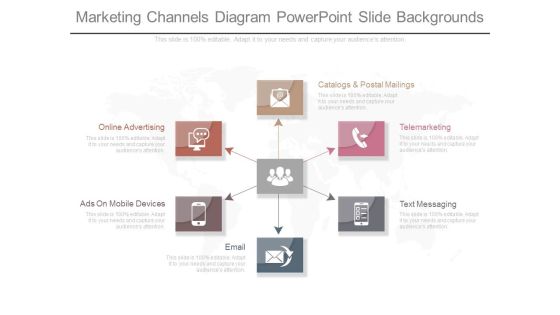
Marketing Channels Diagram Powerpoint Slide Backgrounds
This is a marketing channels diagram powerpoint slide backgrounds. This is a two stage process. The stages in this process are online advertising, ads on mobile devices, email, text messaging, telemarketing, catalogs and postal mailings.
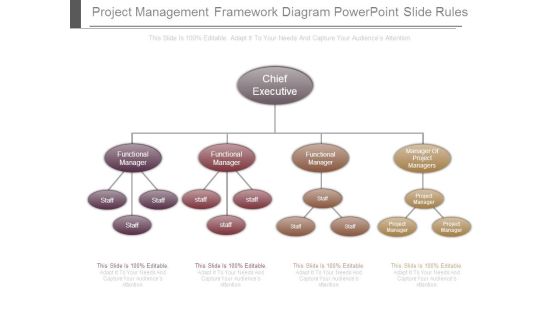
Project Management Framework Diagram Powerpoint Slide Rules
This is a project management framework diagram powerpoint slide rules. This is a two stage process. The stages in this process are chief executive, functional manager, manager of project managers, staff, project manager.
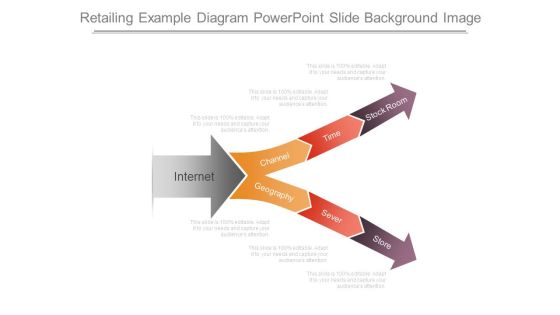
Retailing Example Diagram Powerpoint Slide Background Image
This is a retailing example diagram powerpoint slide background image. This is a two stage process. The stages in this process are internet, channel, time, stock room, store, sever, geography.
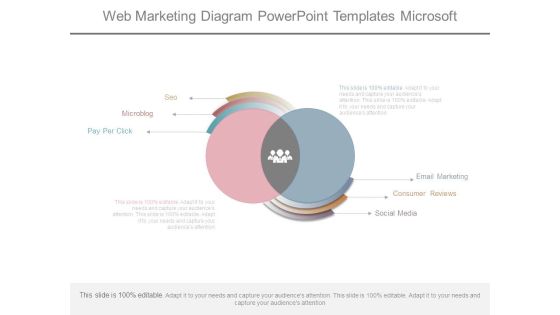
Web Marketing Diagram Powerpoint Templates Microsoft
This is a web marketing diagram powerpoint templates microsoft. This is a two stage process. The stages in this process are seo, microblog, pay per click, email marketing, consumer reviews, social media.

Pricing Management Strategy Diagram Ppt Sample File
This is a pricing management strategy diagram ppt sample file. This is a two stage process. The stages in this process are brand strategy, pricing, distribution channels, competition, profitability goals.

Basic Localization Dashboard Diagram Ppt Example
This is a basic localization dashboard diagram ppt example. This is a two stage process. The stages in this process are quantity details of products sold by countries, products sold by month.

Process Improvement Flowchart Diagram Ppt Sample Presentations
This is a process improvement flowchart diagram ppt sample presentations. This is a two stage process. The stages in this process are problem, analysis, solution, implementation, assessment, completion, diagnosis, improvement.

Category Analysis Ppt PowerPoint Presentation Diagram Ppt
This is a category analysis ppt powerpoint presentation diagram ppt. This is a two stage process. The stages in this process are price, positioning claims, consumption drivers, packing formats types and materials.
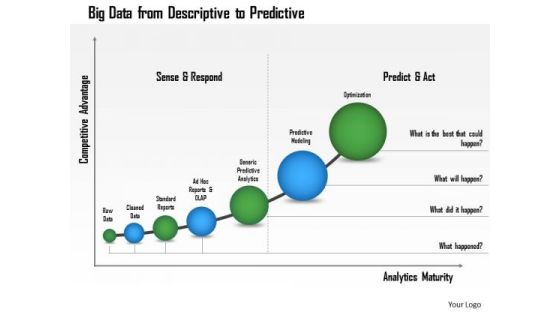
Business Framework Big Data From Descriptive To Predictive PowerPoint Presentation
Two funnel diagrams with text boxes are used to design this Power point template slide. This PPT slide contains the concept of AIDA marketing. Use this PPT for marketing and business presentations.

Asset Allocation Decision Diagram Powerpoint Slide Influencers
This is a asset allocation decision diagram powerpoint slide influencers. This is a two stage process. The stages in this process are risk reward ratio, take profit distance, stop loss distance, reward, risk.
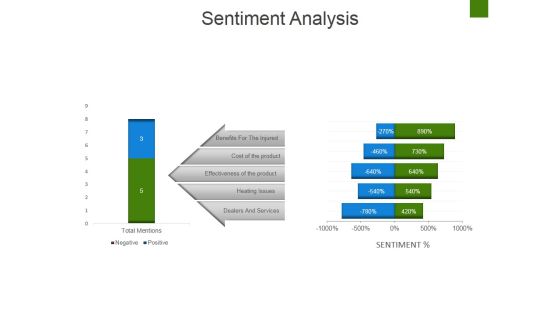
Sentiment Analysis Ppt PowerPoint Presentation Diagram Ppt
This is a sentiment analysis ppt powerpoint presentation diagram ppt. This is a two stage process. The stages in this process are benefits for the injured, cost of the product, effectiveness of the product, heating issues, dealers and services.

Executive Summary Ppt PowerPoint Presentation Outline Diagrams
This is a executive summary ppt powerpoint presentation outline diagrams. This is a two stage process. The stages in this process are revenue, profits, operational cost, total customers, marketing channels.

Volume Open High Low Close Chart Ppt PowerPoint Presentation Infographics Guide
This is a volume open high low close chart ppt powerpoint presentation infographics guide. This is a two stage process. The stages in this process are close, high, volume, low, open, product.

Pie Chart With Dollar Symbol Ppt PowerPoint Presentation Infographic Template Graphics Design
This is a pie chart with dollar symbol ppt powerpoint presentation infographic template graphics design. This is a two stage process. The stages in this process are sectioned circle, segmented circle, partitioned circle.

Bar Chart With Growth Arrow For Business Expansion Ppt Powerpoint Presentation File Vector
This is a bar chart with growth arrow for business expansion ppt powerpoint presentation file vector. This is a two stage process. The stages in this process are expanding, business development, business expansion.

Credit Evaluation And Clearance Process Flow Chart Ppt Powerpoint Presentation Portfolio Images
This is a credit evaluation and clearance process flow chart ppt powerpoint presentation portfolio images. This is a two stage process. The stages in this process are planning process, approval process, developmental approval.

Purchase Order Sanction Procedure Flow Chart Ppt Powerpoint Presentation Summary Show
This is a purchase order sanction procedure flow chart ppt powerpoint presentation summary show. This is a two stage process. The stages in this process are planning process, approval process, developmental approval.

Product Backlog Process Flow Chart Ppt PowerPoint Presentation Model Design Templates
This is a product backlog process flow chart ppt powerpoint presentation model design templates. This is a two stage process. The stages in this process are backlog, uncompleted work, pending work.

Data Collection And Analysis Control Chart Ppt PowerPoint Presentation Model Backgrounds
This is a data collection and analysis control chart ppt powerpoint presentation model backgrounds. This is a two stage process. The stages in this process are business, marketing, strategy, finance, analysis.

Scatter Bubble Chart Highest Sale Ppt PowerPoint Presentation Show Slide Download
This is a scatter bubble chart highest sale ppt powerpoint presentation show slide download. This is a two stage process. The stages in this process are finance, investment, analysis, business, marketing.

Volume Open High Low Close Chart Ppt PowerPoint Presentation Professional Maker
This is a volume open high low close chart ppt powerpoint presentation professional maker. This is a two stage process. The stages in this process are percentage, product, marketing.
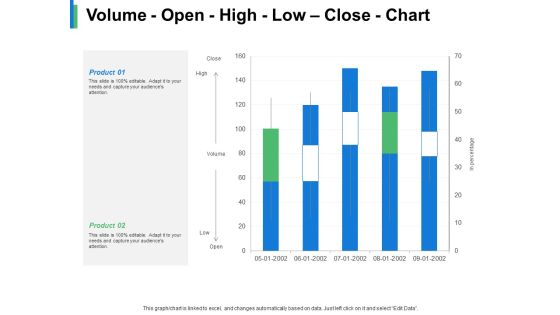
Volume Open High Low Close Chart Product Ppt PowerPoint Presentation Gallery Example
This is a volume open high low close chart product ppt powerpoint presentation gallery example. This is a two stage process. The stages in this process are business, management, strategy, marketing, sales.

Employee Time Management Evaluation Chart Ppt PowerPoint Presentation File Graphic Images
This is a employee time management evaluation chart ppt powerpoint presentation file graphic images. This is a two stage process. The stages in this process are compare, business, management, marketing.
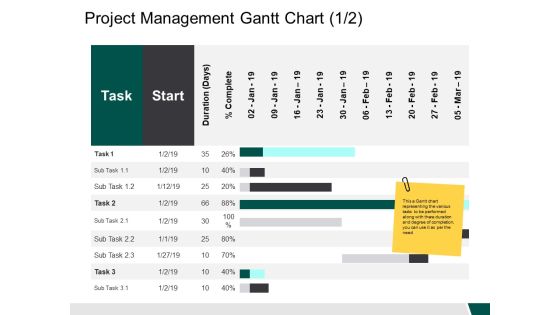
Project Management Gantt Chart Start Ppt PowerPoint Presentation Outline Example Introduction
This is a project management gantt chart start ppt powerpoint presentation outline example introduction. This is a two stage process. The stages in this process are business, management, strategy, analysis, marketing.
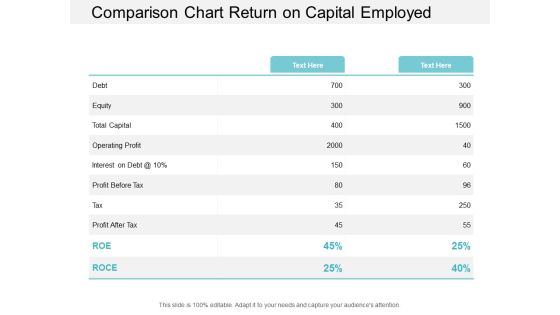
Comparison Chart Return On Capital Employed Ppt PowerPoint Presentation Portfolio Templates
This is a comparison chart return on capital employed ppt powerpoint presentation portfolio templates. This is a two stage process. The stages in this process are accounting ratio, roce, return on capital employed.
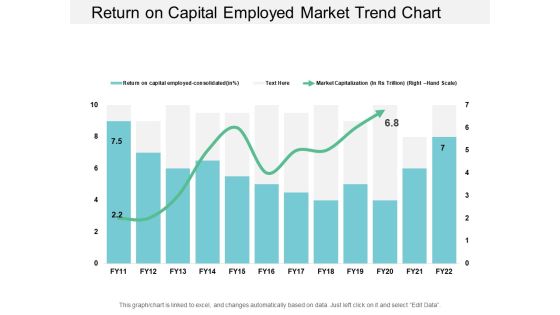
Return On Capital Employed Market Trend Chart Ppt PowerPoint Presentation Styles Examples
This is a return on capital employed market trend chart ppt powerpoint presentation styles examples. This is a two stage process. The stages in this process are accounting ratio, roce, return on capital employed.

Business Framework Bond Prices And Yields PowerPoint Presentation
This power point diagram slide has been crafted with graphic of statistics of bond price and yields. Display the dependency in-between these two fields with this innovative diagram slide. This slide is very useful for financial presentations.
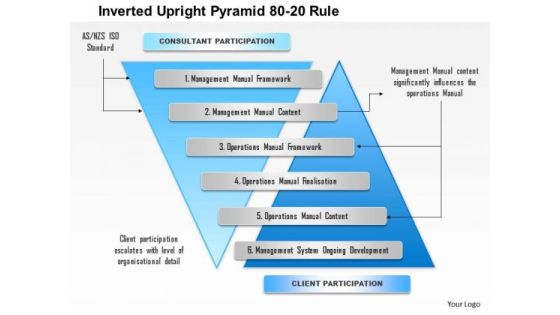
Business Framework Inverted Upright Pyramid 80 20 Rule PowerPoint Presentation
This exclusive power point diagram slide has been crafted with graphic of two inverted pyramids. This graphic template slide contains the concept of 80/20 rule. Use this PPT diagram slide for business topics.

Business Framework Performance Optimization PowerPoint Presentation
Explain the concept of performance optimization with this exclusive template slide. This PPT diagram slide contains the graphic of two meters with maximum ratings. Use this PPT diagram slide and build exclusive presentation for your viewers.

Business Framework Experience Curve Analysis PowerPoint Presentation
A two way linear curve has been used to design this PPT diagram. This business framework contains the concept of curve analysis and management. Use this PPT diagram for your business and management related topics.
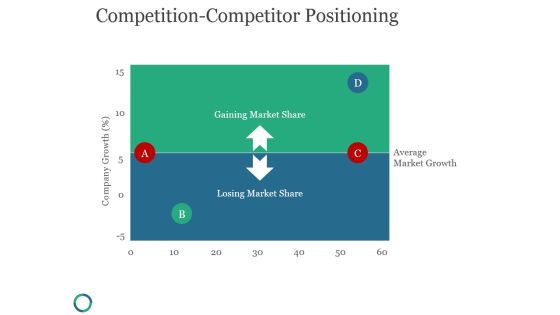
Competition Competitor Positioning Ppt PowerPoint Presentation Diagrams
This is a competition competitor positioning ppt powerpoint presentation diagrams. This is a two stage process. The stages in this process are gaining market share, losing market share, average market growth, company growth.

Positive And Negative Law PowerPoint Themes And PowerPoint Slides 0911
Microsoft PowerPoint Theme and Slide with the words positives and negatives on opposite sides on a gold metal scale symbolizing the comparision of differences between two choices or options

Debt For Equity Layout Diagram Ppt Example
This is a debt for equity layout diagram ppt example. This is a two stage process. The stages in this process are prior to the debt equity swap, following the debt equity swap, shortfall, equity, debt.
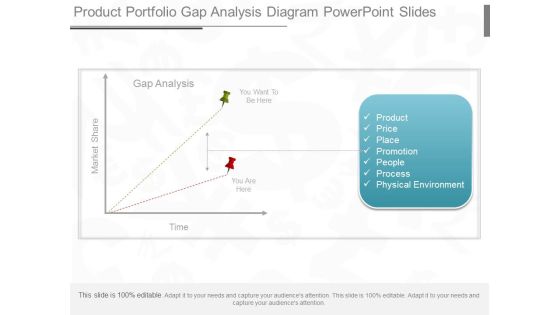
Product Portfolio Gap Analysis Diagram Powerpoint Slides
This is a product portfolio gap analysis diagram powerpoint slides. This is a two stage process. The stages in this process are market share, gap analysis, time, product price, place, promotion, people, process, physical environment.
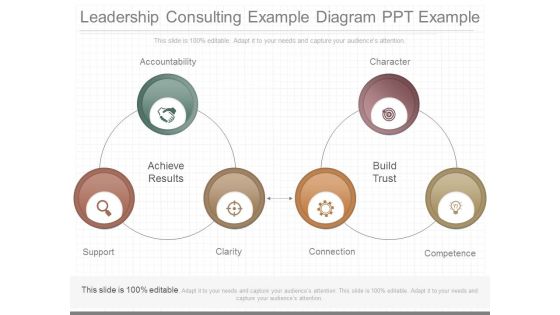
Leadership Consulting Example Diagram Ppt Example
This is a leadership consulting example diagram ppt example. This is a two stage process. The stages in this process are accountability, achieve results, support, clarity, connection, competence, build trust, character.
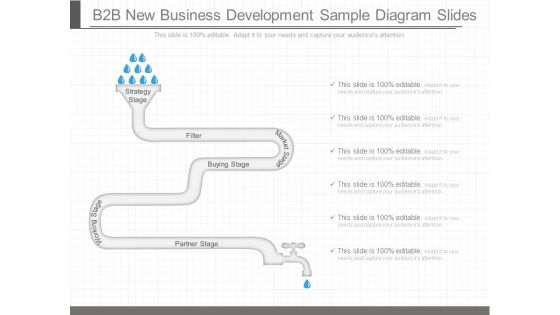
B2b New Business Development Sample Diagram Slides
This is a b2b new business development sample diagram slides. This is a two stage process. The stages in this process are strategy stage, filter, buying stage, market stage, working stage, partner stage.

Electronic Debit Transaction Diagram Powerpoint Slides
This is a electronic debit transaction diagram powerpoint slides. This is a two stage process. The stages in this process are inter banking, mob case, atm, bill payment, brokerage, deposit locker, online wallet, mobile payments, wap, mobile banking, money transfer.

Customer Engagement Imperatives Sample Diagram Presentation
This is a customer engagement imperatives sample diagram presentation. This is a two stage process. The stages in this process are browser in store, buy online, browser online, showrooming, webrooming.

Sales Forecasting Analysis Overview Diagram Slide Introduction
This is a sales forecasting analysis overview diagram slide introduction. This is a two stage process. The stages in this process are quantitative, naive approach, moving averages, trend projection, exponential smoothing, executive opinion, delphi method, consumer surveys, sales forces estimates.
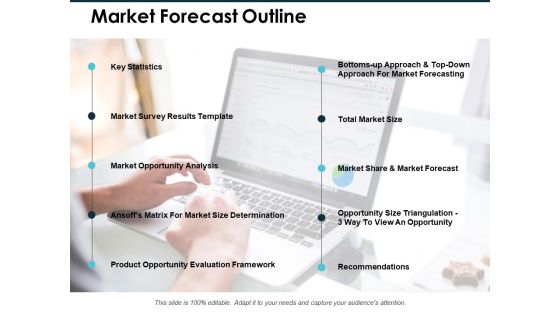
Market Forecast Outline Ppt PowerPoint Presentation Diagrams
This is a market forecast outline ppt powerpoint presentation diagrams. This is a two stage process. The stages in this process are business, market opportunity, product opportunity, evaluation framework.
Open High Low Close Finance Ppt PowerPoint Presentation Icon Graphics Tutorials
This is a open high low close finance ppt powerpoint presentation icon graphics tutorials. This is a two stage process. The stages in this process are finance, analysis, business, investment, marketing.
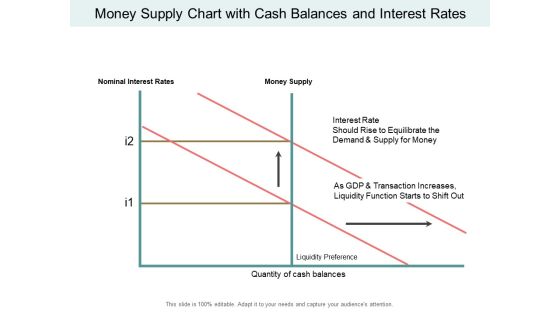
Money Supply Chart With Cash Balances And Interest Rates Ppt PowerPoint Presentation Inspiration Background Images
This is a money supply chart with cash balances and interest rates ppt powerpoint presentation inspiration background images. This is a two stage process. The stages in this process are liquidity, cash assets, solvency.
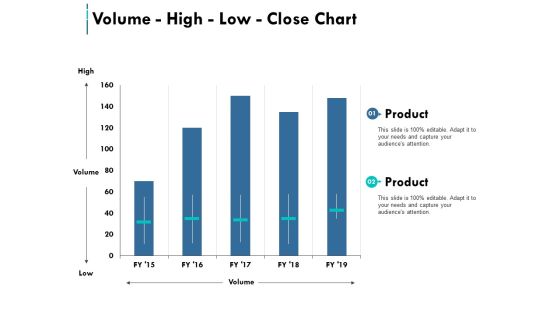
Volume High Low Close Chart Ppt PowerPoint Presentation Pictures Graphics Example
This is a volume high low close chart ppt powerpoint presentation pictures graphics example. This is a two stage process. The stages in this process are marketing, business, management.
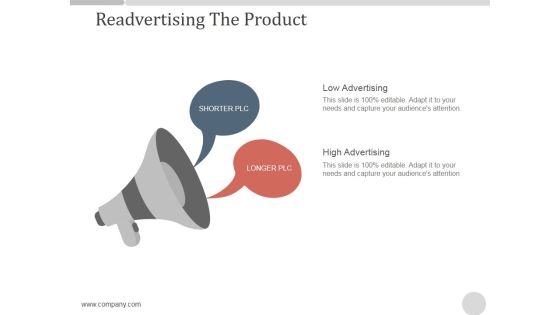
Readvertising The Product Ppt PowerPoint Presentation Diagrams
This is a readvertising the product ppt powerpoint presentation diagrams. This is a two stage process. The stages in this process are low advertising, high advertising, shorter plc, longer plc.
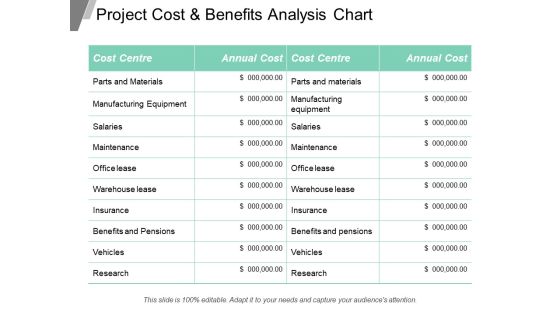
Project Cost And Benefits Analysis Chart Ppt Powerpoint Presentation Inspiration Slideshow
This is a balance scale with cost and benefits ppt powerpoint presentation show. This is a two stage process. The stages in this process are business, finance, marketing, strategy, compare, management.

Business Risk Associated With Customer Service Ppt Powerpoint Presentation Model Diagrams
This is a business risk associated with customer service ppt powerpoint presentation model diagrams. This is a two stage process. The stages in this process are risk, strategies, icons, marketing.
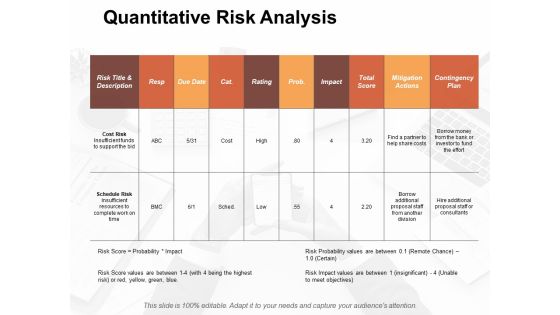
Quantitative Risk Analysis Slide2 Risk Estimator Ppt PowerPoint Presentation Layouts Themes
This is a quantitative risk analysis slide2 risk estimator ppt powerpoint presentation layouts themes. This is a two stage process. The stages in this process are business, management, strategy, analysis, marketing.
Pound Value Growth Vector Icon Ppt Powerpoint Presentation Summary Icon
This is a pound value growth vector icon ppt powerpoint presentation summary icon. This is a two stage process. The stages in this process are increase icon, improved icon, growth icon.
Retail Shop Icon Ppt PowerPoint Presentation Infographic Template Guide
This is a retail shop icon ppt powerpoint presentation infographic template guide. This is a two stage process. The stages in this process are vendor icon, procurement icon, sourcing icon.
Financing Ppt PowerPoint Presentation Icon
This is a financing ppt powerpoint presentation icon. This is a two stage process. The stages in this process are how much capital are you willing to raise, valuation of the company, investment terms, business, finance.
Gears Icon For Process Management Ppt PowerPoint Presentation Icon Deck
This is a gears icon for process management ppt powerpoint presentation icon deck. This is a two stage process. The stages in this process are system integration, application integration, program integration.

Business Support Handshake PowerPoint Themes And PowerPoint Slides 0511
Microsoft PowerPoint Theme and Slide with two business partners holding their hands over the contract lying on the table with a yellow pen a ruler and a cellular phone near by
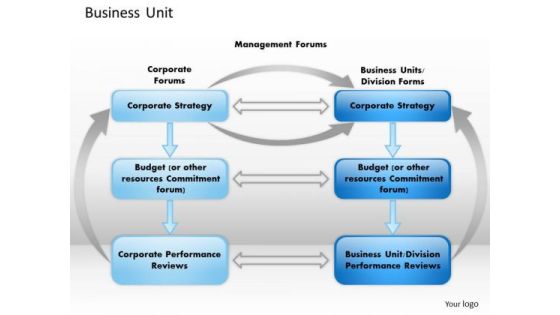
Business Framework Business Unit PowerPoint Presentation
This Professional Power Point template has been crafted for business unit representation. This diagram template slide contains the graphic of two interconnected flow chart with three stages. Use this slide for displaying process flow for business and marketing activities.
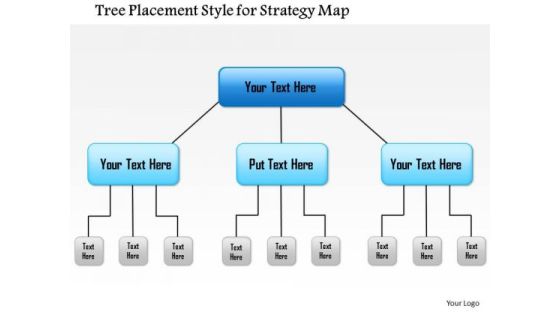
Business Framework Tree Placement Style For Strategy Map PowerPoint Presentation
A two layer flow chart diagram has been used to design this PPT slide. This PPT slide contains the concept of mapping for strategy. This PPt slide is useful for business and marketing strategy related presentations.
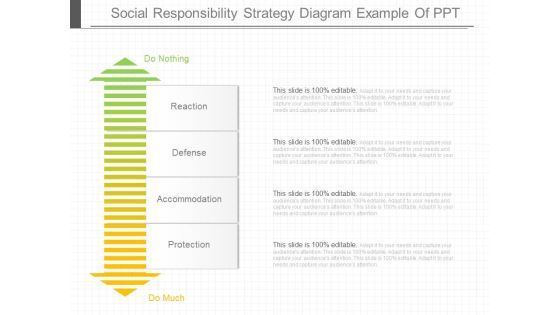
Social Responsibility Strategy Diagram Example Of Ppt
This is a social responsibility strategy diagram example of ppt. This is a two stage process. The stages in this process are do nothing, reaction, defense, accommodation, protection, do much.

Quality Control Management Diagram Powerpoint Images
This is a quality control management diagram powerpoint images. This is a seven stage process. The stages in this process are track improvements required, understanding client requirements, receive feedback, two level verification, define procedures, prepare checklist, prepare sample documents.
Person Holding Phone Receiver Vector Icon Ppt Powerpoint Presentation Icon Guide
This is a person holding phone receiver vector icon ppt powerpoint presentation icon guide. This is a two stage process. The stages in this process are telephone icon, mobile icon, cell phone icon telephone icon, mobile icon, cell phone icon.
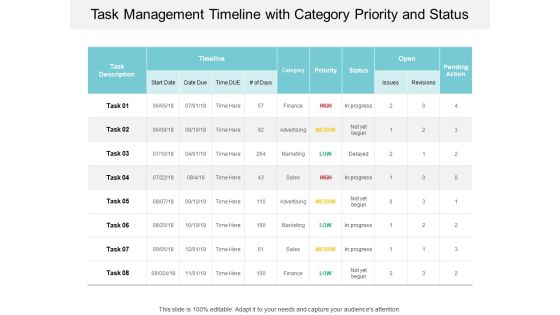
Task Management Timeline With Category Priority And Status Ppt PowerPoint Presentation Ideas Themes
This is a task management timeline with category priority and status ppt powerpoint presentation ideas themes. This is a two stage process. The stages in this process are activity tracker, business, marketing.

Example Of Sales And Purchase Processes Diagram Ppt Slides
This is a example of sales and purchase processes diagram ppt slides. This is a two stage process. The stages in this process are example of sales and purchase processes diagram ppt slides.

Business Framework Brand Equity Development PowerPoint Presentation
This power point diagram slide has been crafted with graphic of two axial flow chart. This chart refers to the concept of brand equity development. Display this concept in your presentations and get detailed information about brand architecture.

Business Framework Reducing Profit Leakage And Maximizing Roi PowerPoint Presentation
Two funnels with interconnection has been used to design this Power Point template slide. This diagram slide contains the concept of reducing profit leakage and maximizing the ROI. Use this PPT slide for business and finance related presentations.

Leading And Lagging Indicators Diagram Example Of Ppt
This is a leading and lagging indicators diagram example of ppt. This is a two stage process. The stages in this process are legging indicator, management ability, employee engagement, leading indicator, process improvement, financial performance, customer loyalty.

Example Of B2b Customer Success Lifecycle Seas Diagram Ppt Slides
This is a example of b2b customer success lifecycle seas diagram ppt slides. This is a two stage process. The stages in this process are conversion, lifetime value management, adoption, conversion, lifetime value management, adoption.
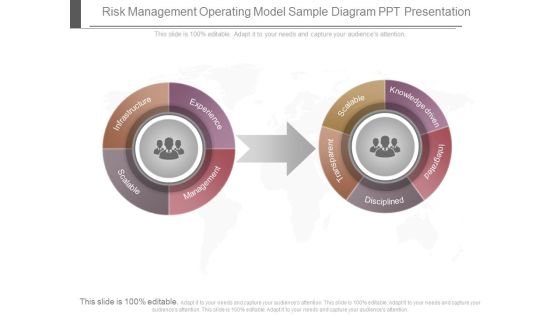
Risk Management Operating Model Sample Diagram Ppt Presentation
This is a risk management operating model sample diagram ppt presentation. This is a two stage process. The stages in this process are infrastructure, scalable, management, experience, transparent, scalable, knowledge driven, integrated, disciplined.
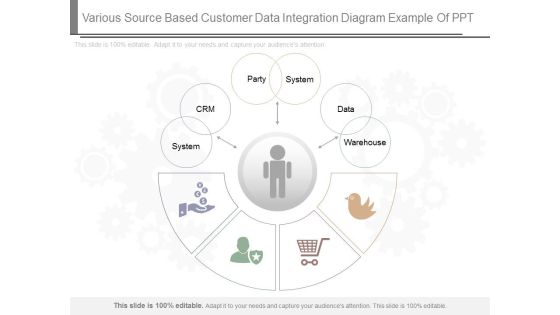
Various Source Based Customer Data Integration Diagram Example Of Ppt
This is a various source based customer data integration diagram example of ppt. This is a two stage process. The stages in this process are system, crm, party, system, data, warehouse.
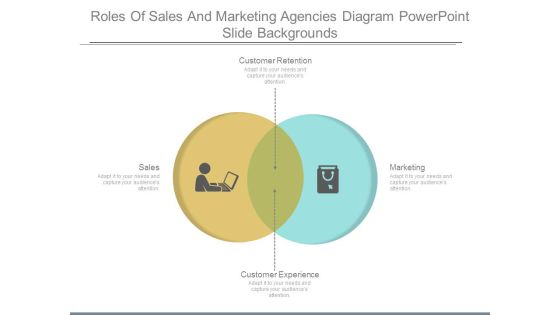
Roles Of Sales And Marketing Agencies Diagram Powerpoint Slide Backgrounds
This is a roles of sales and marketing agencies diagram powerpoint slide backgrounds. This is a two stage process. The stages in this process are customer retention, marketing, customer experience, sales.

Process Of Brand Measurement Sample Diagram Ppt Slides
This is a process of brand measurement sample diagram ppt slides. This is a two stage process. The stages in this process are online marketing, pay per click, social networks, content creation, execution technologies.
Value Stream Mapping Vs Process Mapping Diagram Ppt Presentation
This is a value stream mapping vs process mapping diagram ppt presentation. This is a two stage process. The stages in this process are value stream mapping, process mapping.

Activity Ratios Template 1 Ppt PowerPoint Presentation Portfolio Diagrams
This is a activity ratios template 1 ppt powerpoint presentation portfolio diagrams. This is a two stage process. The stages in this process are inventory turnover, receivables turnover, business.
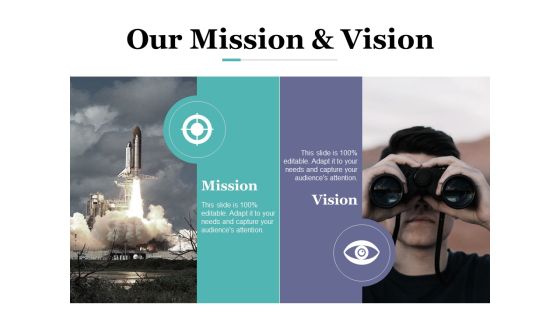
Our Mission And Vision Ppt PowerPoint Presentation Portfolio Diagrams
This is a our mission and vision ppt powerpoint presentation portfolio diagrams. This is a two stage process. The stages in this process are business, mission, vision, management, planning.

It Risk Management Framework Sample Diagram Powerpoint Slide Rules
This is a it risk management framework sample diagram powerpoint slide rules. This is a two stage process. The stages in this process are technology assessment, business assessment, information assessment, integrated requirements, risk quantification, value.

Pros And Cons Of Balanced Scorecard Diagram Example Of Ppt
This is a pros and cons of balanced scorecard diagram example of ppt. This is a two stage process. The stages in this process are strategy side, cost side.
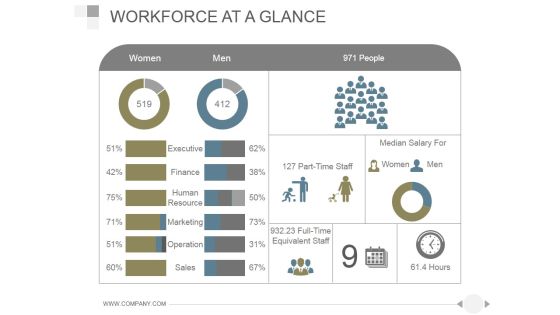
Workforce At A Glance Ppt PowerPoint Presentation Diagrams
This is a workforce at a glance ppt powerpoint presentation diagrams. This is a two stage process. The stages in this process are women, men, people, executive, finance, human resource, marketing.
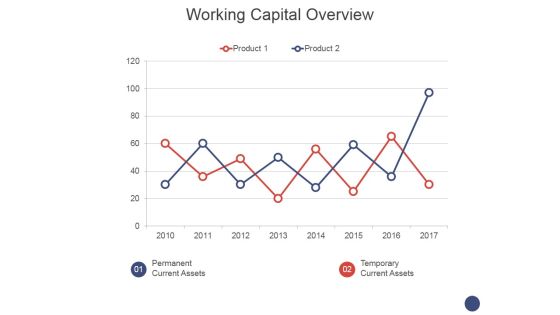
Working Capital Overview Ppt PowerPoint Presentation Layouts Diagrams
This is a working capital overview ppt powerpoint presentation layouts diagrams. This is a two stage process. The stages in this process are permanent current assets, temporary current assets.

Our Goal Ppt PowerPoint Presentation Visual Aids Diagrams
This is a our goal ppt powerpoint presentation visual aids diagrams. This is a two stage process. The stages in this process are business, our goal, marketing, competition, strategy.

Establish Brand Loyalty Ppt PowerPoint Presentation Visual Aids Diagrams
This is a Establish Brand Loyalty Ppt PowerPoint Presentation Visual Aids Diagrams. This is a two stage process. The stages in this process are marketing, business, management, planning, strategy.

Comparison Marketing Ppt Powerpoint Presentation Visual Aids Diagrams
This is a comparison marketing ppt powerpoint presentation visual aids diagrams. This is a two stage process. The stages in this process are comparison, male, female, marketing, strategy .

Quality Cost Report Comparison Ppt PowerPoint Presentation Diagram Lists
This is a quality cost report comparison ppt powerpoint presentation diagram lists. This is a two stage process. The stages in this process are business, management, analysis, strategy, marketing.

Communication Goals Template 2 Ppt PowerPoint Presentation Layouts Icons
This is a communication goals template 2 ppt powerpoint presentation layouts icons. This is a two stage process. The stages in this process are megaphone, icons, strategy, business, communication.
Product Features Template 2 Ppt PowerPoint Presentation Icon Mockup
This is a product features template 2 ppt powerpoint presentation icon mockup. This is a two stage process. The stages in this process are product features, feature, icons, strategy.
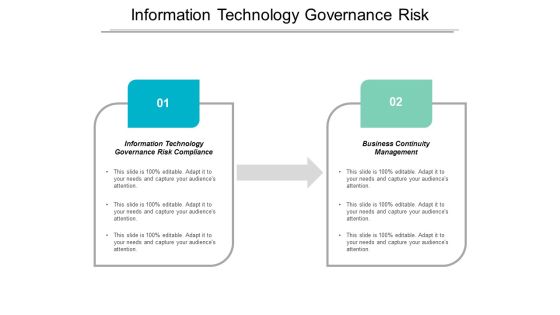
Information Technology Governance Risk Compliance Business Continuity Management Ppt PowerPoint Presentation Portfolio Themes
This is a information technology governance risk compliance business continuity management ppt powerpoint presentation portfolio themes. This is a two stage process. The stages in this process are information technology governance risk compliance, business continuity management.

Quality Control And Quality Assurance Differentiation Ppt PowerPoint Presentation Diagrams
This is a quality control and quality assurance differentiation ppt powerpoint presentation diagrams. This is a two stage process. The stages in this process are quality control, inspection, production process, production process, check quality, quality assurance, prevention.
Solvency Ratios Template 2 Ppt PowerPoint Presentation Icon Sample
This is a solvency ratios template 2 ppt powerpoint presentation icon sample. This is a two stage process. The stages in this process are debt equity ratio, time interest earned ratio.
Inflation Rate Template 2 Ppt PowerPoint Presentation Icon Designs
This is a inflation rate template 2 ppt powerpoint presentation icon designs. This is a two stage process. The stages in this process are net sales, other income, taxes, management, business.

Budgeting Template 2 Ppt PowerPoint Presentation Icon Infographics
This is a budgeting template 2 ppt powerpoint presentation icon infographics. This is a two stage process. The stages in this process are cost item, year, total, type, budgeting template.
Our Strategic Positioning Template 2 Ppt PowerPoint Presentation Icon Deck
This is a our strategic positioning template 2 ppt powerpoint presentation icon deck. This is a two stage process. The stages in this process are business, chess, game, strategy, marketing, analysis.
 Home
Home