Two Phases

Balance Sheet Kpis Ppt PowerPoint Presentation Summary Designs Download
This is a balance sheet kpis ppt powerpoint presentation summary designs download. This is a four stage process. The stages in this process are current assets, current liabilities, total liabilities, operating profit, business.

Pandl Kpis Ppt PowerPoint Presentation Professional Backgrounds
This is a pandl kpis ppt powerpoint presentation professional backgrounds. This is a four stage process. The stages in this process are business, revenue, operating profit, cogs, net profit.

Clustered Bar Ppt PowerPoint Presentation Model Gridlines
This is a clustered bar ppt powerpoint presentation model gridlines. This is a four stage process. The stages in this process are finance, marketing, analysis, management, planning.

Balance Sheet Kpis Ppt PowerPoint Presentation File Picture
This is a balance sheet kpis ppt powerpoint presentation file picture. This is a four stage process. The stages in this process are business, marketing, finance, graph, cagr.

Cash Flow Statement Kpis Ppt PowerPoint Presentation Pictures Graphics
This is a cash flow statement kpis ppt powerpoint presentation pictures graphics. This is a four stage process. The stages in this process are business, marketing, graph, finance, strategy.

Clustered Bar Ppt PowerPoint Presentation Pictures Clipart Images
This is a clustered bar ppt powerpoint presentation pictures clipart images. This is a three stage process. The stages in this process are business, marketing, graph, finance, strategy, unit count.

Competitive Analysis Ppt PowerPoint Presentation Summary Picture
This is a competitive analysis ppt powerpoint presentation summary picture. This is a one stage process. The stages in this process are business, marketing, competitive analysis, finance, graph.

Stacked Line With Markers Ppt PowerPoint Presentation Pictures Design Templates
This is a stacked line with markers ppt powerpoint presentation pictures design templates. This is a one stage process. The stages in this process are business, marketing, finance, in million, graph.

P And L Kpis Tabular Form Ppt PowerPoint Presentation Pictures Gallery
This is a p and l kpis tabular form ppt powerpoint presentation pictures gallery. This is a four stage process. The stages in this process are business, marketing, graph, strategy, finance.

Clustered Column Line Ppt PowerPoint Presentation Summary Example Topics
This is a clustered column line ppt powerpoint presentation summary example topics. This is a four stage process. The stages in this process are clustered column line, growth, marketing, strategy, business.

Balance Sheet Kpis Template 1 Ppt PowerPoint Presentation Show Inspiration
This is a balance sheet kpis template 1 ppt powerpoint presentation show inspiration. This is a four stage process. The stages in this process are business, marketing, graph, current liabilities, total liabilities.

Competitor Comparison Template 1 Ppt PowerPoint Presentation Infographic Template Mockup
This is a competitor comparison template 1 ppt powerpoint presentation infographic template mockup. This is a five stage process. The stages in this process are business, marketing, graph, finance, strategy.

Competitor Market Share And Sales Revenues Ppt PowerPoint Presentation Summary Influencers
This is a competitor market share and sales revenues ppt powerpoint presentation summary influencers. This is a four stage process. The stages in this process are business, marketing, graph, finance, strategy.

Demand Statistics Ppt PowerPoint Presentation Pictures Format Ideas
This is a demand statistics ppt powerpoint presentation pictures format ideas. This is a four stage process. The stages in this process are business, marketing, finance, graph, years.
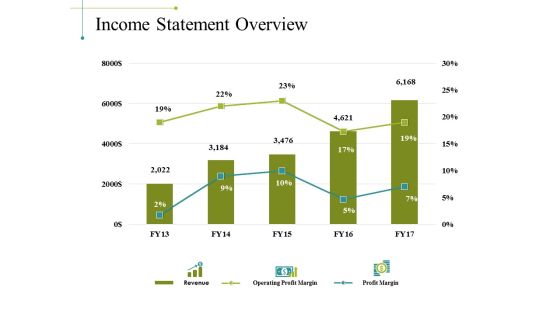
Income Statement Overview Ppt PowerPoint Presentation File Objects
This is a income statement overview ppt powerpoint presentation file objects. This is a three stage process. The stages in this process are business, market revenue, operating profit margin, profit margin.
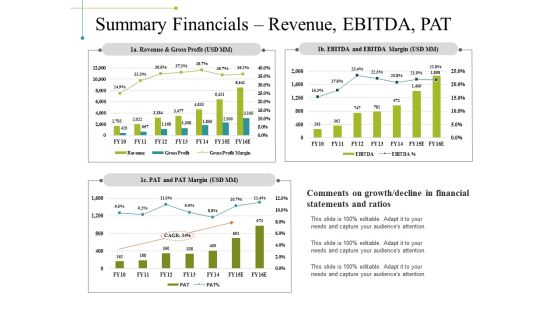
Summary Financials Revenue Ebitda Pat Ppt PowerPoint Presentation Inspiration Templates
This is a summary financials revenue ebitda pat ppt powerpoint presentation inspiration templates. This is a three stage process. The stages in this process are revenue and gross profit, pat and pat margin, ebitda and ebitda margin, business, marketing.

Balance Sheet Graphical Representation Ppt PowerPoint Presentation Gallery Design Templates
This is a balance sheet graphical representation ppt powerpoint presentation gallery design templates. This is a four stage process. The stages in this process are current assets, current liabilities, total assets, total liabilities.

Balance Sheet Kpis Ppt PowerPoint Presentation Slides Download
This is a balance sheet kpis ppt powerpoint presentation slides download. This is a four stage process. The stages in this process are current assets, total assets, current liabilities, total liabilities, business.

Bar Graph Ppt PowerPoint Presentation Summary Format
This is a bar graph ppt powerpoint presentation summary format. This is a three stage process. The stages in this process are bar graph, business, marketing, years, percentage, finance.

Competitor Comparison Template 1 Ppt PowerPoint Presentation Layouts Slide Portrait
This is a competitor comparison template 1 ppt powerpoint presentation layouts slide portrait. This is a four stage process. The stages in this process are business, marketing, graph, finance, strategy.

Competitor Market Share And Sales Revenues Ppt PowerPoint Presentation File Demonstration
This is a competitor market share and sales revenues ppt powerpoint presentation file demonstration. This is a six stage process. The stages in this process are business, marketing, finance, your figures, development.

Demand Statistics Ppt PowerPoint Presentation Pictures Slides
This is a demand statistics ppt powerpoint presentation pictures slides. This is a four stage process. The stages in this process are business, marketing, years, finance, strategy.
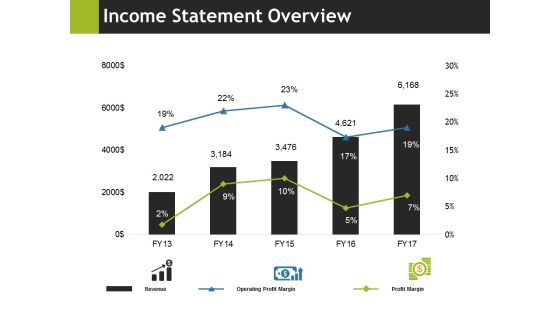
Income Statement Overview Ppt PowerPoint Presentation Professional Portfolio
This is a income statement overview ppt powerpoint presentation professional portfolio. This is a five stage process. The stages in this process are business, marketing, revenue, operating profit margin, profit margin.
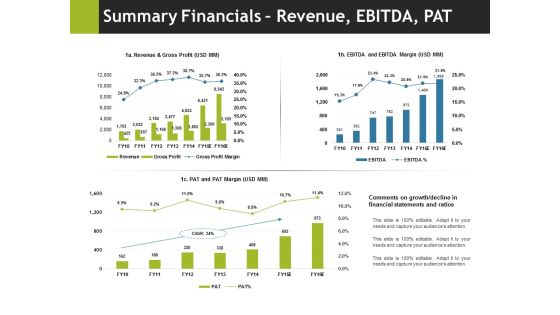
Summary Financials Revenue Ebitda Pat Ppt PowerPoint Presentation Pictures Outline
This is a summary financials revenue ebitda pat ppt powerpoint presentation pictures outline. This is a three stage process. The stages in this process are business, marketing, pat and pat margin, ebitda and ebitda margin, revenue and gross profit.

Balance Sheet Graphical Representation Ppt PowerPoint Presentation Inspiration Example
This is a balance sheet graphical representation ppt powerpoint presentation inspiration example. This is a four stage process. The stages in this process are business, current assets, current liabilities, total liabilities, total assets.

Cash Flow Statement Graphical Representation Ppt PowerPoint Presentation Professional Graphics Tutorials
This is a cash flow statement graphical representation ppt powerpoint presentation professional graphics tutorials. This is a four stage process. The stages in this process are business, operations, financing activities, net increase in cash, investing activities.
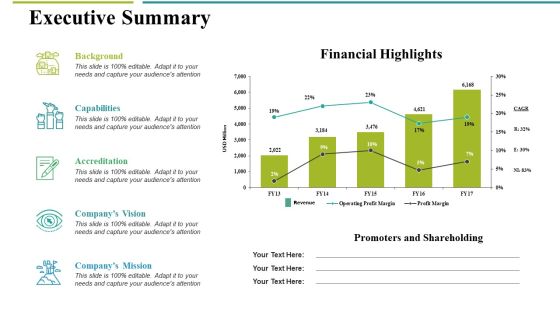
Executive Summary Ppt PowerPoint Presentation Show Topics
This is a executive summary ppt powerpoint presentation show topics. This is a five stage process. The stages in this process are background, capabilities, accreditation, company s vision, company s mission.

Income Statement Graphical Representation Ppt PowerPoint Presentation Pictures Design Templates
This is a income statement graphical representation ppt powerpoint presentation pictures design templates. This is a four stage process. The stages in this process are revenue, operating profit, net profit, cogs, business.
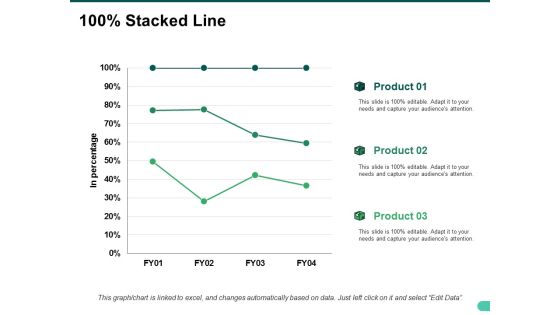
Stacked Line Ppt PowerPoint Presentation Slides Show
This is a stacked line ppt powerpoint presentation slides show. This is a three stage process. The stages in this process are in percentage, business, marketing, strategy, finance.

Stacked Area Clustered Column Ppt PowerPoint Presentation Sample
This is a stacked area clustered column ppt powerpoint presentation sample. This is a three stage process. The stages in this process are business, marketing, strategy, planning, finance.

Bar Graph Ppt PowerPoint Presentation Layouts Portrait
This is a bar graph ppt powerpoint presentation layouts portrait. This is a three stage process. The stages in this process are bar graph, finance, marketing, strategy, business.

Bar Graph Ppt PowerPoint Presentation File Display
This is a bar graph ppt powerpoint presentation file display. This is a four stage process. The stages in this process are bar graph, marketing, strategy, finance, analysis.

Bar Graph Ppt PowerPoint Presentation Styles Visual Aids
This is a bar graph ppt powerpoint presentation styles visual aids. This is a three stage process. The stages in this process are bar, marketing, strategy, finance, planning.

Clustered Bar Ppt PowerPoint Presentation Pictures Guidelines
This is a clustered bar ppt powerpoint presentation pictures guidelines. This is a three stage process. The stages in this process are clustered bar, finance, marketing, strategy, business.

Balance Sheet Graphical Representation Ppt PowerPoint Presentation Infographics Layouts
This is a balance sheet graphical representation ppt powerpoint presentation infographics layouts. This is a four stage process. The stages in this process are business, current assets, total assets, total liabilities, current liabilities.

Cash Flow Statement Graphical Representation Ppt PowerPoint Presentation Professional Show
This is a cash flow statement graphical representation ppt powerpoint presentation professional show. This is a four stage process. The stages in this process are business, operations, investing activities, net increase in cash, financing activities.
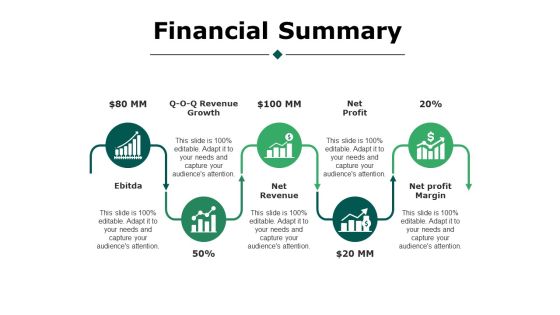
Financial Summary Ppt PowerPoint Presentation Styles Portfolio
This is a financial summary ppt powerpoint presentation styles portfolio. This is a five stage process. The stages in this process are business, ebitda, revenue growth, net revenue, net profit, net profit margin.
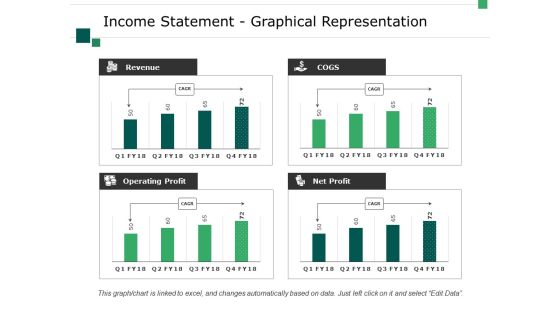
Income Statement Graphical Representation Ppt PowerPoint Presentation Visual Aids Layouts
This is a income statement graphical representation ppt powerpoint presentation visual aids layouts. This is a four stage process. The stages in this process are business, marketing, revenue, operating profit, net profit, cogs.

Executive Summary Ppt PowerPoint Presentation Outline Example Topics
This is a executive summary ppt powerpoint presentation outline example topics. This is a five stage process. The stages in this process are background, capabilities, accreditation, company s vision, company s mission.
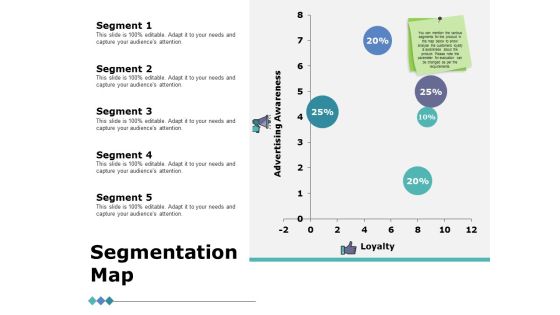
Segmentation Map Ppt PowerPoint Presentation Infographics Guide
This is a segmentation map ppt powerpoint presentation infographics guide. This is a five stage process. The stages in this process are business, marketing, strategy, planning, finance.
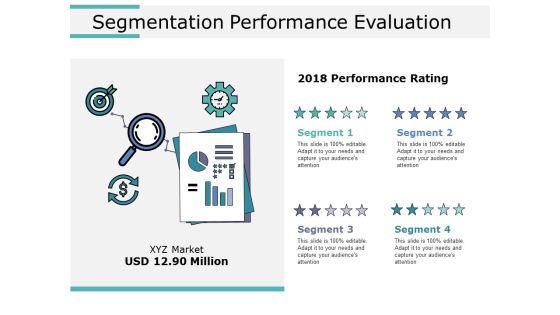
Segmentation Performance Evaluation Ppt PowerPoint Presentation Show Brochure
This is a segmentation performance evaluation ppt powerpoint presentation show brochure. This is a four stage process. The stages in this process are business, marketing, strategy, planning, finance.
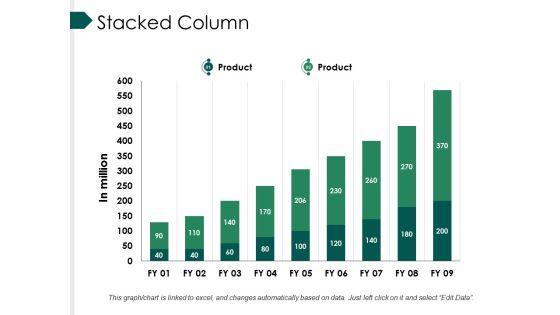
Stacked Column Ppt PowerPoint Presentation Professional Infographics
This is a stacked column ppt powerpoint presentation professional infographics. This is a nine stage process. The stages in this process are bar, marketing, strategy, finance, teamwork.
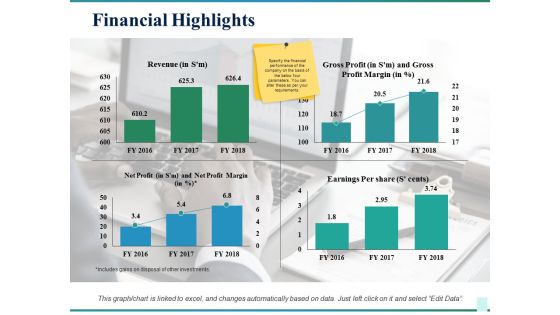
Financial Highlights Ppt PowerPoint Presentation Infographic Template Slide Download
This is a financial highlights ppt powerpoint presentation infographic template slide download. This is a four stage process. The stages in this process are business, revenue, gross profit, earnings per share, net profit, marketing.

Sales Activities Dashboard Ppt PowerPoint Presentation Show Skills
This is a sales activities dashboard ppt powerpoint presentation show skills. This is a four stage process. The stages in this process are total activities, closed activities, activities per won deal, open activities, this month.
Sales Kpi Tracker Ppt PowerPoint Presentation Pictures Layout Ideas
This is a sales kpi tracker ppt powerpoint presentation pictures layout ideas. This is a four stage process. The stages in this process are opportunities won, top products in revenue, leads created, win ratio vs last yr, open deals vs.

Sales Revenue Product Ppt PowerPoint Presentation Outline Portfolio
This is a sales revenue product ppt powerpoint presentation outline portfolio. This is a three stage process. The stages in this process are total income product, total revenue, product wise revenue, sales, business.

Current Financial Highlights Ppt PowerPoint Presentation Professional Slide Download
This is a current financial highlights ppt powerpoint presentation professional slide download. This is a four stage process. The stages in this process are revenue, gross profit, net profit, earnings per share.
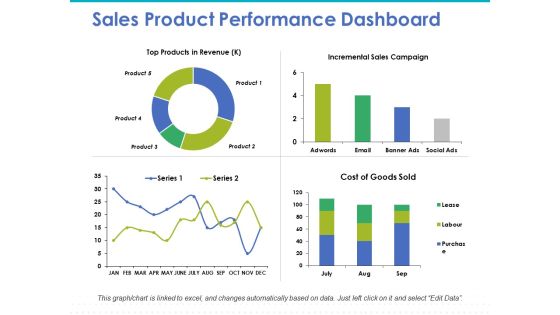
Sales Product Performance Dashboard Ppt PowerPoint Presentation Model Graphics Design
This is a sales product performance dashboard ppt powerpoint presentation model graphics design. This is a four stage process. The stages in this process are top products in revenue, incremental sales, cost of goods.

Clustered Column Line Ppt PowerPoint Presentation Model Graphics Tutorials
This is a clustered column line ppt powerpoint presentation model graphics tutorials. This is a three stage process. The stages in this process are business, marketing, in percentage, finance, graph.
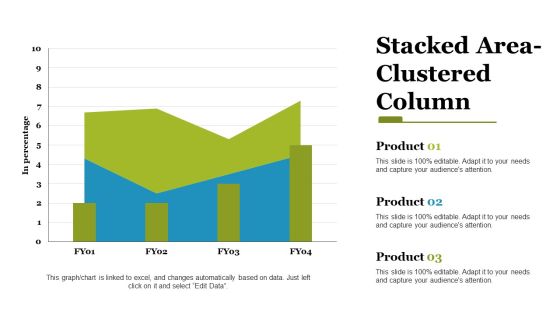
stacked area clustered column ppt powerpoint presentation styles files
This is a stacked area clustered column ppt powerpoint presentation styles files. This is a three stage process. The stages in this process are stacked area, clustered column, finance, marketing, strategy, business.

Sales Projections Ppt PowerPoint Presentation Model Examples
This is a sales projections ppt powerpoint presentation model examples. This is a five stage process. The stages in this process are on sales, in years, bar graph.

Bar Graph Ppt PowerPoint Presentation Ideas Design Inspiration
This is a bar graph ppt powerpoint presentation ideas design inspiration. This is a five stage process. The stages in this process are bar, marketing, strategy, planning, finance.

Bar Graph Ppt PowerPoint Presentation Layouts Backgrounds
This is a bar graph ppt powerpoint presentation layouts backgrounds. This is a one stage process. The stages in this process are business, marketing, finance, bar graph, strategy.

Predictive Analytics Benefits Ppt PowerPoint Presentation Professional Samples
This is a predictive analytics benefits ppt powerpoint presentation professional samples. This is a five stage process. The stages in this process are business, finance, marketing, strategy, analysis.

Clustered Bar Ppt PowerPoint Presentation Professional Guidelines
This is a clustered bar ppt powerpoint presentation professional guidelines. This is a three stage process. The stages in this process are clustered bar, finance, marketing, strategy, analysis.

Sales Performance Dashboard Template Ppt PowerPoint Presentation Slides Example File
This is a sales performance dashboard template ppt powerpoint presentation slides example file. This is a eight stage process. The stages in this process are business, marketing, strategy, finance, planning.

Stacked Bar Ppt PowerPoint Presentation Layouts Brochure
This is a stacked bar ppt powerpoint presentation layouts brochure. This is a four stage process. The stages in this process are business, marketing, strategy, planning, finance.

Financial Ppt PowerPoint Presentation Layouts Example
This is a financial ppt powerpoint presentation layouts example. This is a three stage process. The stages in this process are business, marketing, maximum, medium, minimum, financial.

Sales Performance Dashboard Template Ppt PowerPoint Presentation Professional Elements
This is a sales performance dashboard template ppt powerpoint presentation professional elements. This is a eight stage process. The stages in this process are sales comparison, sales by product category, sales by month, brand profitability, revenue.

Bar Graph Ppt PowerPoint Presentation Slides Slideshow
This is a bar graph ppt powerpoint presentation slides slideshow. This is a three stage process. The stages in this process are business, finance, marketing, strategy, planning.

 Home
Home