Two Phases

Combo Chart Ppt PowerPoint Presentation Visual Aids Files
This is a combo chart ppt powerpoint presentation visual aids files. This is a three stage process. The stages in this process are finance, marketing, management, investment, analysis.

Area Chart Investment Ppt PowerPoint Presentation Infographics Summary
This is a area chart investment ppt powerpoint presentation infographics summary. This is a three stage process. The stages in this process are finance, marketing, management, investment, analysis.

Clustered Bar Chart Ppt PowerPoint Presentation Summary Templates
This is a clustered bar chart ppt powerpoint presentation summary templates. This is a three stage process. The stages in this process are finance, marketing, management, investment, analysis.

Pie Chart Finance Ppt PowerPoint Presentation Inspiration Introduction
This is a pie chart finance ppt powerpoint presentation inspiration introduction. This is a three stage process. The stages in this process are finance, marketing, analysis, business, investment.

Bar Chart Slide Ppt PowerPoint Presentation Summary Example File
This is a bar chart slide ppt powerpoint presentation summary example file. This is a three stage process. The stages in this process are percentage, marketing, management, product.

Column Chart Investment Ppt PowerPoint Presentation Professional Pictures
This is a column chart investment ppt powerpoint presentation professional pictures. This is a three stage process. The stages in this process are finance, analysis, business, investment, marketing.

Stacked Bar Chart Ppt PowerPoint Presentation Gallery Outfit
This is a stacked bar chart ppt powerpoint presentation gallery outfit. This is a three stage process. The stages in this process are finance, marketing, management, investment, analysis.

Area Chart Ppt PowerPoint Presentation File Design Inspiration
This is a area chart ppt powerpoint presentation file design inspiration. This is a three stage process. The stages in this process are percentage, product, business, management, marketing.

Combo Chart Financial Ppt PowerPoint Presentation Layouts Layouts
This is a combo chart financial ppt powerpoint presentation layouts layouts. This is a three stage process. The stages in this process are finance, marketing, management, investment, analysis.

Combo Chart Finance Ppt PowerPoint Presentation Portfolio Templates
This is a combo chart finance ppt powerpoint presentation portfolio templates. This is a three stage process. The stages in this process are finance, analysis, business, investment, marketing.

Area Chart Financial Ppt PowerPoint Presentation Outline Information
This is a area chart financial ppt powerpoint presentation outline information. This is a three stage process. The stages in this process are percentage, product, business, management, marketing.

Area Chart Percentage Ppt PowerPoint Presentation Gallery Outline
This is a area chart percentage ppt powerpoint presentation gallery outline. This is a three stage process. The stages in this process are business, management, marketing, percentage, product.

Scatter Bubble Chart Ppt PowerPoint Presentation Outline Demonstration
This is a scatter bubble chart ppt powerpoint presentation outline demonstration. This is a three stage process. The stages in this process are percentage, product, management, marketing, business.

Bar Chart Product Ppt PowerPoint Presentation Portfolio Visuals
This is a bar chart product ppt powerpoint presentation portfolio visuals. This is a three stage process. The stages in this process are business, management, marketing, percentage, product.
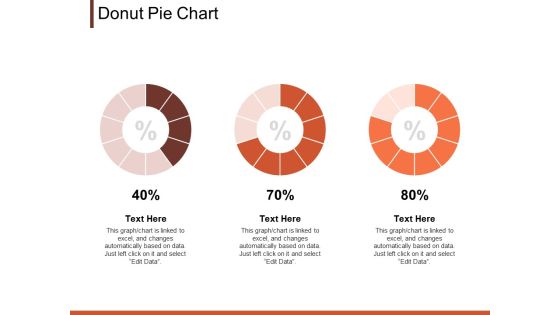
Donut Pie Chart Marketing Ppt PowerPoint Presentation Clipart
This is a donut pie chart marketing ppt powerpoint presentation clipart. This is a three stage process. The stages in this process are finance, analysis, business, investment, marketing.

Scatter Chart Financial Ppt PowerPoint Presentation Model Deck
This is a scatter chart financial ppt powerpoint presentation model deck. This is a one stage process. The stages in this process are business, management, marketing, percentage, product.

Pie Chart Finance Ppt PowerPoint Presentation Professional Styles
This is a pie chart finance ppt powerpoint presentation professional styles. This is a three stage process. The stages in this process are management, marketing, business, strategy, finance.

Data Collection Scatter Diagram Ppt PowerPoint Presentation Good
This is a data collection scatter diagram ppt powerpoint presentation good. This is a three stage process. The stages in this process are product, business, marketing, finance, data collection.

Capital Expenditure Details Fy 18 Ppt PowerPoint Presentation Diagram Images
This is a capital expenditure details fy 18 ppt powerpoint presentation diagram images. This is a six stage process. The stages in this process are business, finance, analysis, strategy, marketing.
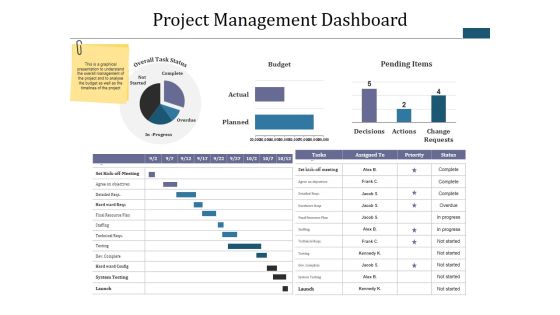
Project Management Dashboard Ppt PowerPoint Presentation Infographic Template Diagrams
This is a project management dashboard ppt powerpoint presentation infographic template diagrams. This is a three stage process. The stages in this process are budget, pending items, complete, overdue, not started.

Data Collection Scatter Diagram Ppt PowerPoint Presentation Summary Deck
This is a data collection scatter diagram ppt powerpoint presentation summary deck. This is a three stage process. The stages in this process are business, marketing, strategy, finance, analysis.

Data Collection Scatter Diagram Ppt PowerPoint Presentation Professional Smartart
This is a data collection scatter diagram ppt powerpoint presentation professional smartart. This is a three stage process. The stages in this process are business, marketing, finance, graph, strategy.
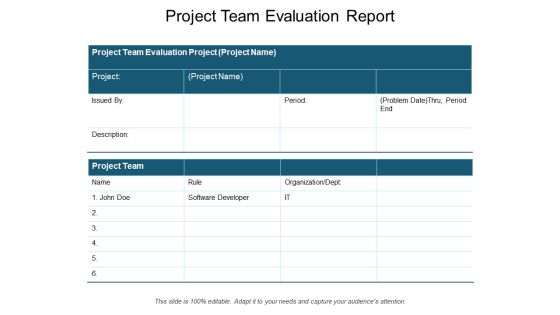
Project Team Evaluation Report Ppt PowerPoint Presentation File Diagrams
This is a project team evaluation report ppt powerpoint presentation file diagrams. This is a four stage process. The stages in this process are project analysis, project review, project performance management.

Lead Scoring Chart Powerpoint Slide Background
This is a lead scoring chart powerpoint slide background. This is a six stage process. The stages in this process are measurable roi on lead generation program, increased conversion rates from qualified lead to opportunity, increased sales productivity and effectiveness, shortened sales cycle, better forecast and pipeline visibility, better alignment of marketing and sales efforts.
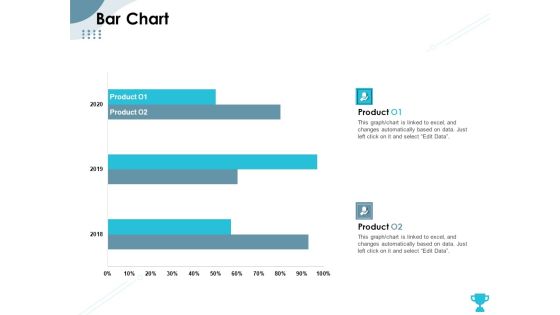
Strategies Take Your Retail Business Ahead Competition Bar Chart Slides PDF
Presenting this set of slides with name strategies take your retail business ahead competition bar chart slides pdf. The topics discussed in these slides are product 1, product 2. This is a completely editable PowerPoint presentation and is available for immediate download. Download now and impress your audience.

data collection and analysis control chart ppt powerpoint presentation styles
This is a data collection and analysis control chart ppt powerpoint presentation styles. This is a one stage process. The stages in this process are upper limit, centerline, plotted points, lower limit, point labels.

High Low Close Chart Ppt Powerpoint Presentation Gallery Slides
This is a high low close chart ppt powerpoint presentation gallery slides. This is a five stage process. The stages in this process are close, volume, high, low, graph.

Our Charts And Graphs Ppt PowerPoint Presentation File Visuals
This is a our charts and graphs ppt powerpoint presentation file visuals. This is a one stage process. The stages in this process are business, strategy, marketing, analysis, finance.

Clustered Column Line Chart Ppt PowerPoint Presentation Professional Slides
This is a clustered column line chart ppt powerpoint presentation professional slides. This is a four stage process. The stages in this process are bar, finance, business, marketing, growth.

High Low Close Chart Ppt PowerPoint Presentation Layouts Guide
This is a high low close chart ppt powerpoint presentation layouts guide. This is a ten stage process. The stages in this process are high, volume, low, business, marketing, finance.

High Low Close Chart Ppt PowerPoint Presentation Ideas Brochure
This is a high low close chart ppt powerpoint presentation ideas brochure. This is a three stage process. The stages in this process are in percentage, product, business, marketing, finance.
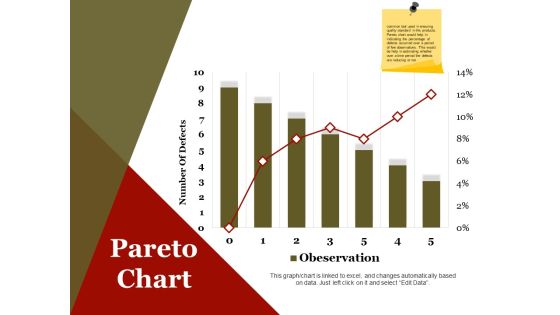
Pareto Chart Ppt PowerPoint Presentation Infographics Design Inspiration
This is a pareto chart ppt powerpoint presentation infographics design inspiration. This is a seven stage process. The stages in this process are number of defects, business, marketing, finance.

High Low Close Chart Ppt PowerPoint Presentation Layouts Objects
This is a high low close chart ppt powerpoint presentation layouts objects. This is a five stage process. The stages in this process are high, volume, low, business, marketing.

Pareto Chart Ppt PowerPoint Presentation File Infographic Template
This is a pareto chart ppt powerpoint presentation file infographic template. This is a six stage process. The stages in this process are number of defects, business, marketing, graph.
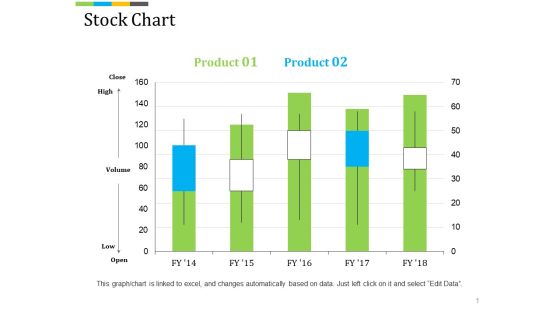
Stock Chart Ppt PowerPoint Presentation Professional Background Image
This is a stock chart ppt powerpoint presentation professional background image. This is a five stage process. The stages in this process are high, volume, low, finance, business, marketing.

Stock Chart Ppt PowerPoint Presentation Summary File Formats
This is a stock chart ppt powerpoint presentation summary file formats. This is a five stage process. The stages in this process are high, volume, low, business, graph, finance.

Column Chart Ppt PowerPoint Presentation Show Master Slide
This is a column chart ppt powerpoint presentation show master slide. This is a six stage process. The stages in this process are financial, years, business, marketing, finance, graph.
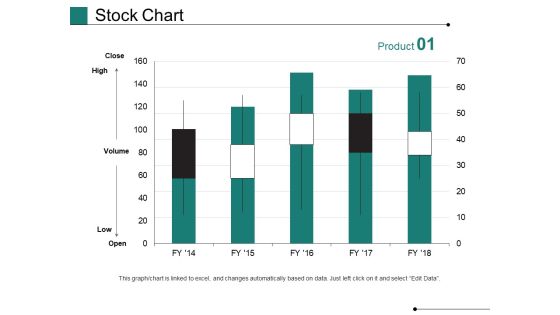
Stock Chart Ppt PowerPoint Presentation Pictures Graphics Design
This is a stock chart ppt powerpoint presentation pictures graphics design. This is a five stage process. The stages in this process are high, volume, low, business, marketing, graph.

Scatter Bubble Chart Ppt PowerPoint Presentation Gallery Example Introduction
This is a scatter bubble chart ppt powerpoint presentation gallery example introduction. This is a eight stage process. The stages in this process are business, marketing, finance, bubble, scatter.
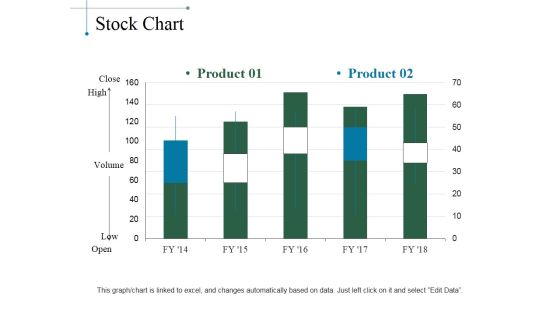
Stock Chart Ppt PowerPoint Presentation Layouts Designs Download
This is a stock chart ppt powerpoint presentation layouts designs download. This is a five stage process. The stages in this process are product, close, high, volume, low, open.

Clustered Column Chart Ppt PowerPoint Presentation Show Slideshow
This is a clustered column chart ppt powerpoint presentation show slideshow. This is a six stage process. The stages in this process are financial year in, sales in percentage, business, marketing, finance.

Column Chart Ppt PowerPoint Presentation Model Background Images
This is a column chart ppt powerpoint presentation model background images. This is a six stage process. The stages in this process are bar graph, marketing, finance, strategy, planning.

Open High Low Close Chart Ppt PowerPoint Presentation Styles Example
This is a open high low close chart ppt powerpoint presentation styles example. This is a four stage process. The stages in this process are business, marketing, finance, strategy, planning.

Clustered Column Line Chart Ppt PowerPoint Presentation Inspiration Graphics Pictures
This is a clustered column line chart ppt powerpoint presentation inspiration graphics pictures. This is a four stage process. The stages in this process are business, marketing, strategy, planning, finance.
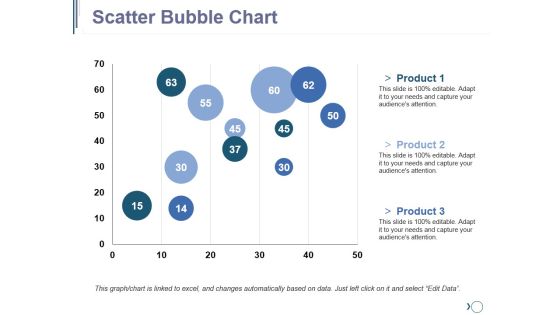
Scatter Bubble Chart Ppt PowerPoint Presentation Outline Graphics Pictures
This is a scatter bubble chart ppt powerpoint presentation outline graphics pictures. This is a three stage process. The stages in this process are finance, planning, business, marketing, strategy.
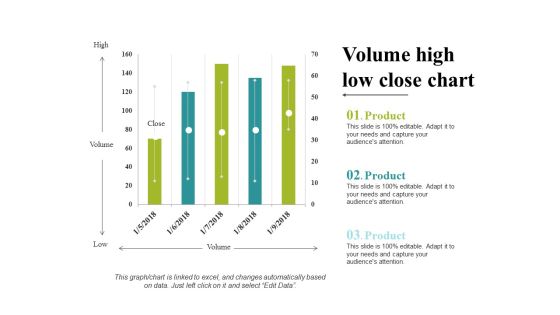
Volume High Low Close Chart Ppt PowerPoint Presentation Portfolio Clipart
This is a volume high low close chart ppt powerpoint presentation portfolio clipart. This is a five stage process. The stages in this process are business, marketing, strategy, planning, finance.
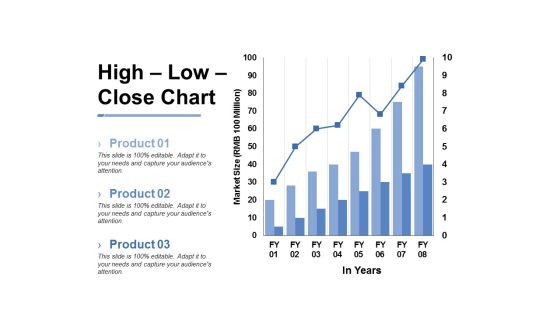
High Low Close Chart Ppt PowerPoint Presentation Inspiration Slide
This is a high low close chart ppt powerpoint presentation inspiration slide. This is a three stage process. The stages in this process are business, marketing, market size, in years, graph.

Combo Chart Ppt PowerPoint Presentation Gallery Design Ideas
This is a combo chart ppt powerpoint presentation gallery design ideas. This is a three stage process. The stages in this process are business, financial years, sales in percentage, finance, graph.

Area Chart Ppt PowerPoint Presentation Layouts Graphic Images
This is a area chart ppt powerpoint presentation layouts graphic images. This is a three stage process. The stages in this process are business, in years, marketing, in percentage, finance, graph.

Pareto Chart Template 1 Ppt PowerPoint Presentation File Ideas
This is a pareto chart template 1 ppt powerpoint presentation file ideas. This is a eight stage process. The stages in this process are business, finance, marketing, strategy, analysis.

Bar Chart Finance Ppt PowerPoint Presentation Infographics Background Images
This is a bar chart finance ppt powerpoint presentation infographics background images. This is a seven stages process. The stages in this process are alpha testing, beta testing, full scale show.

Combo Chart Finance Ppt PowerPoint Presentation Infographic Template Microsoft
This is a combo chart finance ppt powerpoint presentation infographic template microsoft. This is a three stage process. The stages in this process are finance, marketing, management, investment, analysis.
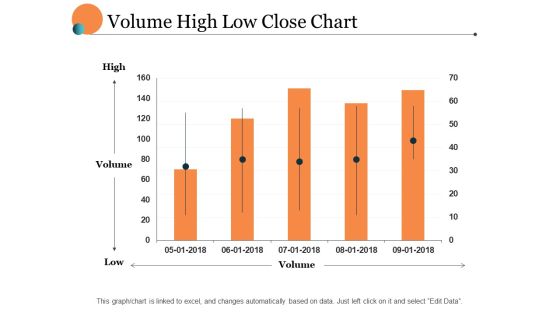
Volume High Low Close Chart Ppt PowerPoint Presentation Portfolio Layout
This is a volume high low close chart ppt powerpoint presentation portfolio layout. This is a five stage process. The stages in this process are finance, marketing, management, investment, analysis.

Clustered Column Chart Ppt PowerPoint Presentation Professional Ideas
This is a clustered column chart ppt powerpoint presentation professional ideas. This is a three stage process. The stages in this process are product, sales in percentage, column, years.

Control Charts Sample Value Ppt PowerPoint Presentation Infographics Demonstration
This is a control charts sample value ppt powerpoint presentation infographics demonstration. This is a five stage process. The stages in this process are product, percentage, marketing, business, management.

Control Charts Template 1 Ppt PowerPoint Presentation Show Graphics Design
This is a control charts template 1 ppt powerpoint presentation show graphics design. This is a one stage process. The stages in this process are business, finance, marketing, strategy, analysis.
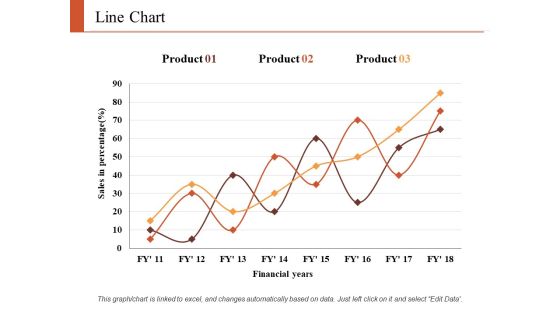
Line Chart Finance Ppt PowerPoint Presentation Infographic Template Graphics Tutorials
This is a line chart finance ppt powerpoint presentation infographic template graphics tutorials. This is a three stage process. The stages in this process are finance, marketing, analysis, business, investment.

Pie Chart Finance Ppt PowerPoint Presentation Styles File Formats
This is a pie chart finance ppt powerpoint presentation styles file formats. This is a four stage process. The stages in this process are finance, analysis, business, investment, marketing.

Pie Chart Marketing Finance Ppt PowerPoint Presentation Gallery Good
This is a pie chart marketing finance ppt powerpoint presentation gallery good. This is a three stage process. The stages in this process are finance, analysis, business, investment, marketing.

Donut Pie Chart Finance Ppt PowerPoint Presentation Inspiration Graphics
This is a donut pie chart finance ppt powerpoint presentation inspiration graphics. This is a three stage process. The stages in this process are finance, analysis, business, investment, marketing.

Daunt Pie Chart Investment Ppt PowerPoint Presentation Infographic Template Aids
This is a daunt pie chart investment ppt powerpoint presentation infographic template aids. This is a four stage process. The stages in this process are finance, analysis, business, investment, marketing.

Area Chart Investment Ppt PowerPoint Presentation Summary Design Inspiration
This is a area chart investment ppt powerpoint presentation summary design inspiration. This is a three stage process. The stages in this process are finance, marketing, management, investment, analysis.

Clustered Column Chart Planning Ppt PowerPoint Presentation Portfolio Information
This is a clustered column chart planning ppt powerpoint presentation portfolio information. This is a four stage process. The stages in this process are finance, marketing, analysis, business, investment.
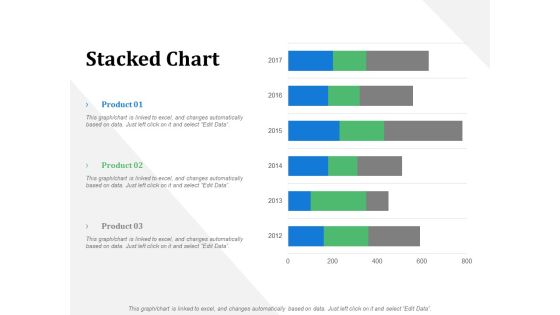
Stacked Chart Business Marketing Ppt PowerPoint Presentation File Design Ideas
This is a stacked chart business marketing ppt powerpoint presentation file design ideas. This is a three stage process. The stages in this process are business, management, marketing, product, percentage.

Clustered Column Chart Investment Ppt PowerPoint Presentation Infographic Template Clipart
This is a clustered column chart investment ppt powerpoint presentation infographic template clipart. This is a four stage process. The stages in this process are finance, analysis, business, investment, marketing.

Combo Chart Finance Marketing Ppt PowerPoint Presentation File Guidelines
This is a combo chart finance marketing ppt powerpoint presentation file guidelines. This is a three stage process. The stages in this process are finance, analysis, business, investment, marketing.

Area Chart Finance Ppt PowerPoint Presentation Styles Designs Download
This is a area chart finance ppt powerpoint presentation styles designs download. This is a three stage process. The stages in this process are finance, analysis, business, investment, marketing.

Bubble Chart Product Ppt PowerPoint Presentation Inspiration Design Ideas
This is a bubble chart product ppt powerpoint presentation inspiration design ideas. This is a one stage process. The stages in this process are business, management, marketing, product, percentage.

Clustered Column Chart Finance Ppt PowerPoint Presentation Gallery Styles
This is a clustered column chart finance ppt powerpoint presentation gallery styles. This is a three stage process. The stages in this process are finance, analysis, business, investment, marketing.
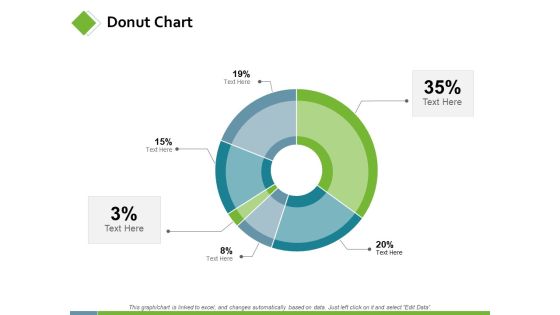
Donut Chart Marketing Planning Ppt PowerPoint Presentation Model Slideshow
This is a donut chart marketing planning ppt powerpoint presentation model slideshow. This is a six stage process. The stages in this process are finance, analysis, business, investment, marketing.
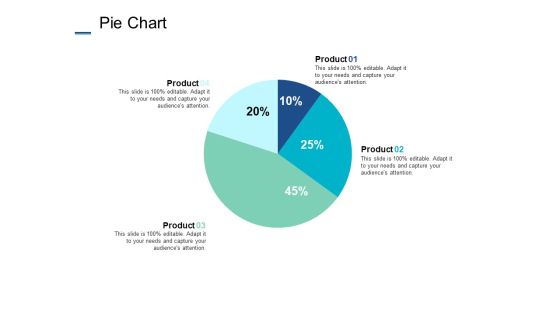
Pie Chart Finance Marketing Ppt PowerPoint Presentation Styles Outfit
This is a pie chart finance marketing ppt powerpoint presentation styles outfit. This is a four stage process. The stages in this process are finance, analysis, business, investment, marketing.

Pie Chart Marketing Finance Ppt PowerPoint Presentation File Guidelines
This is a pie chart marketing finance ppt powerpoint presentation file guidelines. This is a three stage process. The stages in this process are finance, analysis, business, investment, marketing.

Area Chart Finance Marketing Ppt PowerPoint Presentation Gallery Graphics Design
This is a area chart finance marketing ppt powerpoint presentation gallery graphics design. This is a three stage process. The stages in this process are finance, analysis, business, investment, marketing.
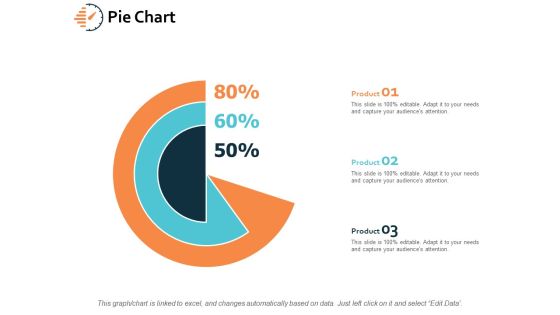
Pie Chart Investment Finance Ppt PowerPoint Presentation File Influencers
This is a pie chart investment finance ppt powerpoint presentation file influencers. This is a three stage process. The stages in this process are finance, analysis, business, investment, marketing.

Combo Chart Investment Ppt PowerPoint Presentation Summary Infographic Template
This is a combo chart investment ppt powerpoint presentation summary infographic template. This is a three stage process. The stages in this process are finance, analysis, business, investment, marketing.

Clustered Chart Finance Marketing Ppt PowerPoint Presentation Layouts Outfit
This is a clustered chart finance marketing ppt powerpoint presentation layouts outfit. This is a four stage process. The stages in this process are finance, analysis, business, investment, marketing.

Bar Chart Finance Marketing Ppt PowerPoint Presentation File Good
This is a bar chart finance marketing ppt powerpoint presentation file good. This is a three stage process. The stages in this process are finance, marketing, management, investment, analysis.

Bar Chart Management Investment Ppt PowerPoint Presentation File Rules
This is a bar chart management investment ppt powerpoint presentation file rules. This is a three stage process. The stages in this process are finance, marketing, management, investment, analysis.
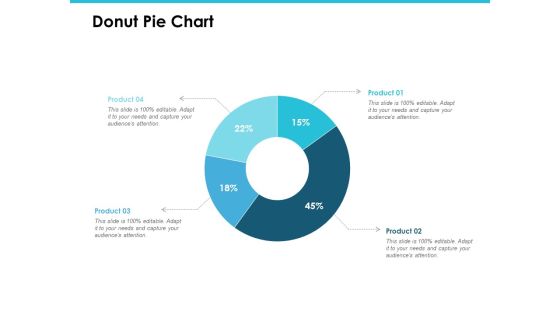
Donut Pie Chart Investment Analysis Ppt PowerPoint Presentation Gallery Introduction
This is a donut pie chart investment analysis ppt powerpoint presentation gallery introduction. This is a four stage process. The stages in this process are finance, marketing, management, investment, analysis.
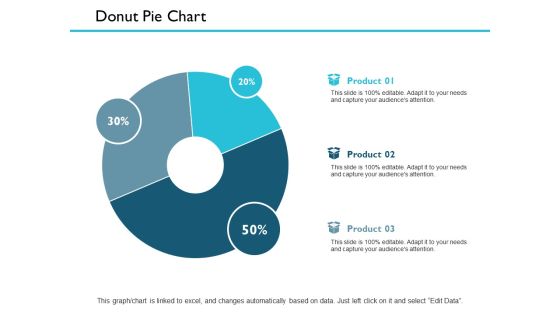
Donut Pie Chart Finance Ppt PowerPoint Presentation Outline Smartart
This is a donut pie chart finance ppt powerpoint presentation outline smartart. This is a three stage process. The stages in this process are management, marketing, business, strategy, finance.
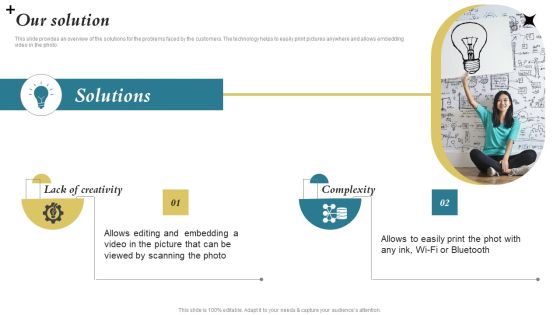
Portable Printing Company Capital Raising Deck Our Solution Diagrams PDF
This slide provides an overview of the solutions for the problems faced by the customers. The technology helps to easily print pictures anywhere and allows embedding video in the photo. Whether you have daily or monthly meetings, a brilliant presentation is necessary. Portable Printing Company Capital Raising Deck Our Solution Diagrams PDF can be your best option for delivering a presentation. Represent everything in detail using Portable Printing Company Capital Raising Deck Our Solution Diagrams PDF and make yourself stand out in meetings. The template is versatile and follows a structure that will cater to your requirements. All the templates prepared by Slidegeeks are easy to download and edit. Our research experts have taken care of the corporate themes as well. So, give it a try and see the results.

Product Price Catalogue Chart With Rate Allocation Infographics PDF
This slide showcases list chart that can help consumer to make comparative assessment about price of product for purchasing different amount of units. Its key components are product, rate allocated at 1 unit, 2 unit and more than 3 units purchase Pitch your topic with ease and precision using this product price catalogue chart with rate allocation infographics pdf. This layout presents information on product price catalogue chart with rate allocation. It is also available for immediate download and adjustment. So, changes can be made in the color, design, graphics or any other component to create a unique layout.

Infographic Of Three Growth Elements Powerpoint Template
The above PPT template displays three steps infographic diagram. This diagram helps to exhibit three growth elements. Adjust the above diagram in your business presentations to visually support your content.
Half Yearly Effective IT Data Governance Execution Roadmap For Business Icons
We present our half yearly effective it data governance execution roadmap for business icons. This PowerPoint layout is easy to edit so you can change the font size, font type, color, and shape conveniently. In addition to this, the PowerPoint layout is Google Slides compatible, so you can share it with your audience and give them access to edit it. Therefore, download and save this well researched half yearly effective it data governance execution roadmap for business icons in different formats like PDF, PNG, and JPG to smoothly execute your business plan.
Lean Six Sigma Half Yearly Roadmap For Effective Project Management Icons
Introducing our lean six sigma half yearly roadmap for effective project management icons. This PPT presentation is Google Slides compatible, therefore, you can share it easily with the collaborators for measuring the progress. Also, the presentation is available in both standard screen and widescreen aspect ratios. So edit the template design by modifying the font size, font type, color, and shapes as per your requirements. As this PPT design is fully editable it can be presented in PDF, JPG and PNG formats.
Medical Services Market Intelligence Reporting And Solutions Half Yearly Roadmap Icons
Introducing our medical services market intelligence reporting and solutions half yearly roadmap icons. This PPT presentation is Google Slides compatible, therefore, you can share it easily with the collaborators for measuring the progress. Also, the presentation is available in both standard screen and widescreen aspect ratios. So edit the template design by modifying the font size, font type, color, and shapes as per your requirements. As this PPT design is fully editable it can be presented in PDF, JPG and PNG formats.
Half Yearly Trust Ecosystem Update On Philosophy Of Existence Roadmap Icons
Introducing our half yearly trust ecosystem update on philosophy of existence roadmap icons. This PPT presentation is Google Slides compatible, therefore, you can share it easily with the collaborators for measuring the progress. Also, the presentation is available in both standard screen and widescreen aspect ratios. So edit the template design by modifying the font size, font type, color, and shapes as per your requirements. As this PPT design is fully editable it can be presented in PDF, JPG and PNG formats.

Our Goal Ppt PowerPoint Presentation Diagrams
This is a our goal ppt powerpoint presentation diagrams. This is a six stage process. The stages in this process are business, strategy, marketing, target, icons, process.
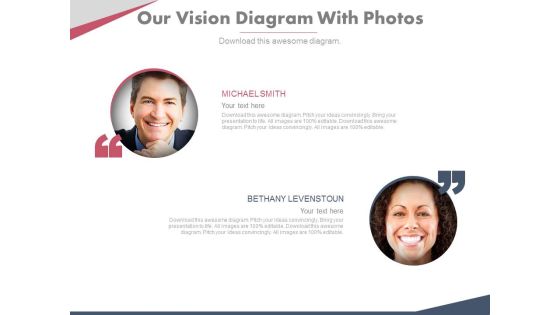
Our Vision Diagram With Photos Powerpoint Slides
This PowerPoint template displays pictures of corporate team members. You may download this PPT slide to depict corporate vision in convincing manner. Add this slide to your presentation and impress your superiors.

Team Profile Tags Introduction Diagram Powerpoint Slides
This PPT slide contains graphics of team profile tags. You may use this PowerPoint template for introduction of your team. Download this team introduction slide design to deliver amazing presentations.
Half Yearly Functional Roadmap With Departments Role In Cardiovascular Treatment Icons
Presenting our jaw dropping half yearly functional roadmap with departments role in cardiovascular treatment icons. You can alternate the color, font size, font type, and shapes of this PPT layout according to your strategic process. This PPT presentation is compatible with Google Slides and is available in both standard screen and widescreen aspect ratios. You can also download this well researched PowerPoint template design in different formats like PDF, JPG, and PNG. So utilize this visually appealing design by clicking the download button given below.

Scatter Bubble Chart Ppt PowerPoint Presentation Gallery Inspiration
This is a scatter bubble chart ppt powerpoint presentation gallery inspiration. This is a seven stage process. The stages in this process are scatter, bubble, chart, business, management.

Action Plan To Enhance Process To Engage Customers In Business Offerings Summary PDF
This slide provides process to engage customers in business offerings that includes journey from unknown visitor to repetitive customer behavior such as attract and identify, interact, close, support and retain. Retrieve professionally designed Action Plan To Enhance Process To Engage Customers In Business Offerings Summary PDF to effectively convey your message and captivate your listeners. Save time by selecting pre-made slideshows that are appropriate for various topics, from business to educational purposes. These themes come in many different styles, from creative to corporate, and all of them are easily adjustable and can be edited quickly. Access them as PowerPoint templates or as Google Slides themes. You dont have to go on a hunt for the perfect presentation because Slidegeeks got you covered from everywhere.
Year 2016 Text With Icons Powerpoint Template
This PowerPoint template contains year 2016 text with icons. This diagram has been designed to exhibit concept of future planning. Use this diagram to set targets and to measure performance in your presentations.
Employee Picture With Four Icons Powerpoint Slides
This PowerPoint template has been designed with employee picture and four icons. This diagram is excellent visual tools to display leading employee and strategic planning. Capture the attention of your audience using this PPT diagram slide.
Team Profiles With Business Icons Powerpoint Slides
This PowerPoint template contains linear diagram of team profiles and business icons. This PowerPoint template helps to exhibit team?s communication and strategic planning. Use this diagram slide to build an exclusive presentation

Steps To Conduct Sales Risks Assessment Ppt Summary Graphics Download PDF
Are you searching for a Steps To Conduct Sales Risks Assessment Ppt Summary Graphics Download PDF that is uncluttered, straightforward, and original Its easy to edit, and you can change the colors to suit your personal or business branding. For a presentation that expresses how much effort you have put in, this template is ideal With all of its features, including tables, diagrams, statistics, and lists, its perfect for a business plan presentation. Make your ideas more appealing with these professional slides. Download Steps To Conduct Sales Risks Assessment Ppt Summary Graphics Download PDF from Slidegeeks today.

Six Steps Of Knowledge Management System Ppt PowerPoint Presentation Gallery File Formats PDF
Presenting six steps of knowledge management system ppt powerpoint presentation gallery file formats pdf to dispense important information. This template comprises six stages. It also presents valuable insights into the topics including knowledge acquisition and generation, knowledge capture, knowledge organization, knowledge storage, knowledge sharing, knowledge application. This is a completely customizable PowerPoint theme that can be put to use immediately. So, download it and address the topic impactfully.
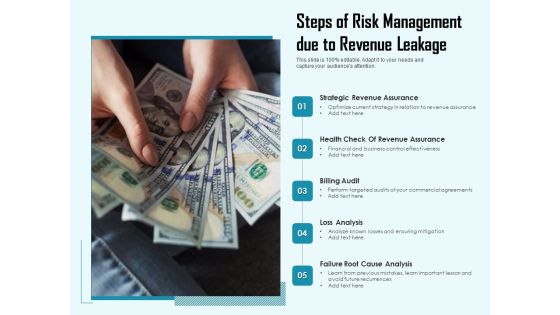
Steps Of Risk Management Due To Revenue Leakage Ppt PowerPoint Presentation Ideas Skills PDF
Presenting steps of risk management due to revenue leakage ppt powerpoint presentation ideas skills pdf to dispense important information. This template comprises five stages. It also presents valuable insights into the topics including strategic revenue assurance, health check of revenue assurance, billing audit, loss analysis, failure root cause analysis. This is a completely customizable PowerPoint theme that can be put to use immediately. So, download it and address the topic impactfully.
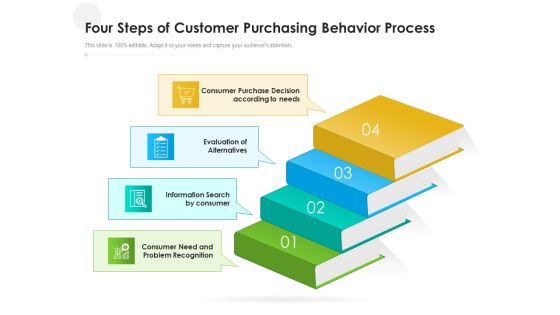
Four Steps Of Customer Purchasing Behavior Process Ppt PowerPoint Presentation File Shapes PDF
Presenting four steps of customer purchasing behavior process ppt powerpoint presentation file shapes pdf to dispense important information. This template comprises four stages. It also presents valuable insights into the topics including consumer purchase decision according to needs, evaluation of alternatives, information search by consumer. This is a completely customizable PowerPoint theme that can be put to use immediately. So, download it and address the topic impactfully.

Impacts Of Poor Common Data Environment Ppt Model Slide PDF
The following slide showcases impacts of poor data. It covers rework, time waste and money loss. Presenting Impacts Of Poor Common Data Environment Ppt Model Slide PDF to dispense important information. This template comprises three stages. It also presents valuable insights into the topics including Rework, Time Waste, Money Loss. This is a completely customizable PowerPoint theme that can be put to use immediately. So, download it and address the topic impactfully.

Diagram For Risk Assessment Methodology Powerpoint Slides
This PowerPoint template contains graphics of three circles with business icons. You may download this PPT slide design to display risk assessment methodology. You can easily customize this template to make it more unique as per your need.

Diagram Of Marketing Research Questions Powerpoint Slides
This PowerPoint template has been designed with four text tags and icons. This PPT slide can be used to prepare marketing research questions. You can download finance PowerPoint template to prepare awesome presentations.
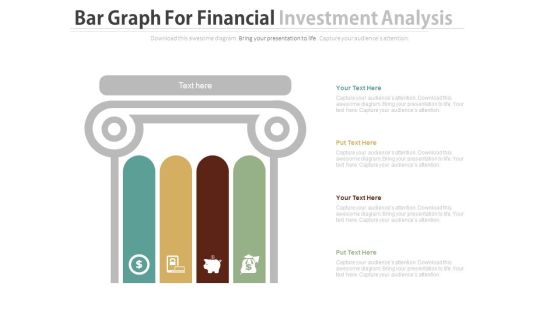
Financial Saving And Investment Diagram Powerpoint Slides
This PowerPoint template has been designed with professional graphics with finance icons. This PPT slide can be used to display financial saving and investment concepts. You can download finance PowerPoint template to prepare awesome presentations.

Circular Diagram For Target Planning Powerpoint Slides
This PowerPoint template is useful for making presentations on business goals and strategy formation. This PPT background has a design of business icons around target board. This PPT slide is suitable for topics like corporate strategic planning.

Rebranding Brand Fresh Face Development Case Study Brand Overhaul For Revamped Rebranding Icons PDF
This slide provides information regarding case study showcasing logo rebranding for brand performance management. It includes details about rebranding goal, rebranding initiatives taken, etc. Retrieve professionally designed Rebranding Brand Fresh Face Development Case Study Brand Overhaul For Revamped Rebranding Icons PDF to effectively convey your message and captivate your listeners. Save time by selecting pre-made slideshows that are appropriate for various topics, from business to educational purposes. These themes come in many different styles, from creative to corporate, and all of them are easily adjustable and can be edited quickly. Access them as PowerPoint templates or as Google Slides themes. You dont have to go on a hunt for the perfect presentation because Slidegeeks got you covered from everywhere.
IOS Application Development Pros And Cons For Native Mobile App Development Icons PDF
This slide highlights the pros and cons for native apps based on UX, overall performance, access, cost effectiveness, etc. Retrieve professionally designed IOS Application Development Pros And Cons For Native Mobile App Development Icons PDF to effectively convey your message and captivate your listeners. Save time by selecting pre made slideshows that are appropriate for various topics, from business to educational purposes. These themes come in many different styles, from creative to corporate, and all of them are easily adjustable and can be edited quickly. Access them as PowerPoint templates or as Google Slides themes. You do not have to go on a hunt for the perfect presentation because Slidegeeks got you covered from everywhere.
Target Ppt PowerPoint Presentation Themes
This is a target ppt powerpoint presentation themes. This is a one stage process. The stages in this process are business, marketing, target, services, success.
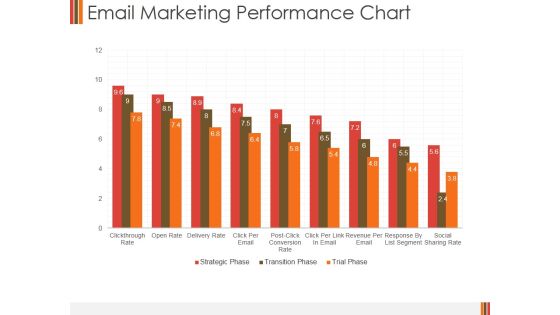
Email Marketing Performance Chart Ppt PowerPoint Presentation Portfolio Inspiration
This is a email marketing performance chart ppt powerpoint presentation portfolio inspiration. This is a nine stage process. The stages in this process are business, finance, marketing, performance chart, strategy, analysis.

Bubble Chart Ppt PowerPoint Presentation Layouts Design Ideas
This is a bubble chart ppt powerpoint presentation layouts design ideas. This is a eight stage process. The stages in this process are in percentage, profit, bubble chart, business, marketing.

Our Graphs And Charts Ppt PowerPoint Presentation Infographics Infographics
This is a our graphs and charts ppt powerpoint presentation infographics infographics. This is a one stage process. The stages in this process are business, strategy, analysis, pretention, chart and graph.

Bubble Chart Ppt PowerPoint Presentation Portfolio Visual Aids
This is a bubble chart ppt powerpoint presentation portfolio visual aids. This is a three stage process. The stages in this process are bubble chart, product, business, marketing, success.

Column Chart Template 1 Ppt PowerPoint Presentation Professional Backgrounds
This is a column chart template 1 ppt powerpoint presentation professional backgrounds. This is a nine stage process. The stages in this process are column chart, product, growth, strategy, analysis, business.
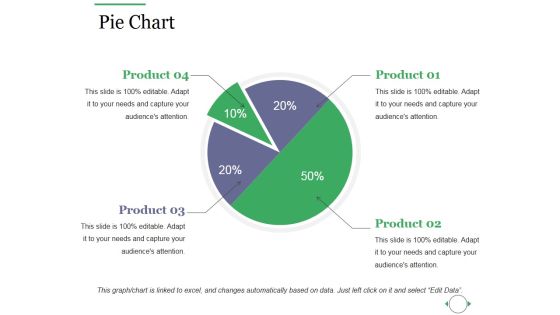
Pie Chart Ppt PowerPoint Presentation Infographic Template Summary
This is a pie chart ppt powerpoint presentation infographic template summary. This is a four stage process. The stages in this process are pie chart, marketing, strategy, analysis, business.
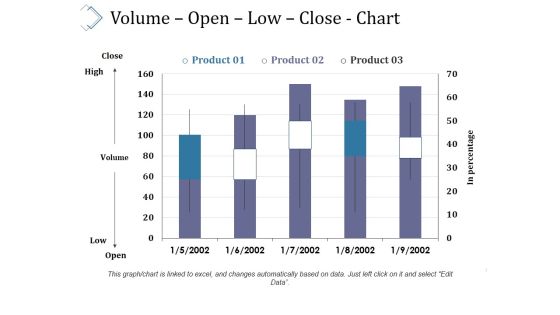
Volume Open Low Close Chart Ppt PowerPoint Presentation Summary Grid
This is a volume open low close chart ppt powerpoint presentation summary grid. This is a three stage process. The stages in this process are volume, open, low, close, chart.
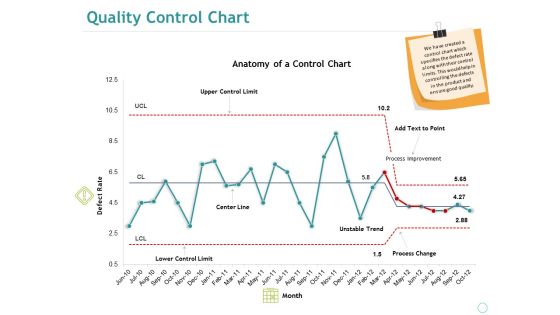
Quality Control Chart Ppt PowerPoint Presentation Summary Sample
This is a quality control chart ppt powerpoint presentation summary sample. This is a one stage process. The stages in this process are anatomy of a control chart, defect rate, upper control limit, center line, lower control limit.

Control Chart Template 1 Ppt PowerPoint Presentation Infographic Template Deck
This is a control chart template 1 ppt powerpoint presentation infographic template deck. This is a one stage process. The stages in this process are control chart, growth, finance, marketing, strategy, business.

Pie Chart Ppt PowerPoint Presentation Infographic Template Vector
This is a pie chart ppt powerpoint presentation infographic template vector. This is a five stage process. The stages in this process are pie chart, finance, analysis, investment, business.

Control Charts Average Ppt PowerPoint Presentation Ideas Demonstration
This is a control charts average ppt powerpoint presentation ideas demonstration. This is a one stage process. The stages in this process are control charts, sub group average, sub group numbers, finance, business.

Combo Chart Finance Ppt PowerPoint Presentation Show Elements
This is a combo chart finance ppt powerpoint presentation show elements. This is a three stage process. The stages in this process are combo chart, finance, marketing, management, investment.

Area Chart Finance Ppt PowerPoint Presentation Infographics Design Ideas
This is a area chart finance ppt powerpoint presentation infographics design ideas. This is a three stage process. The stages in this process are area chart, finance, marketing, management, investment.

Bar Chart Finance Ppt Powerpoint Presentation Styles Skills
This is a bar chart finance ppt powerpoint presentation styles skills. This is a three stage process. The stages in this process are bar chart, finance, marketing, management, analysis.

Donut Chart Finance Ppt Powerpoint Presentation Infographic Template Slide Download
This is a donut chart finance ppt powerpoint presentation infographic template slide download. This is a three stage process. The stages in this process are donut chart, finance, marketing, management, analysis.

Combo Chart Analysis Management Ppt PowerPoint Presentation Professional Gridlines
This is a combo chart analysis management ppt powerpoint presentation professional gridlines. This is a three stage process. The stages in this process are combo chart, finance, marketing, business, analysis.

Combo Chart Finance Ppt PowerPoint Presentation Outline Example
This is a combo chart finance ppt powerpoint presentation outline example. This is a three stage process. The stages in this process are bar chart, finance, marketing, business, analysis.

Stacked Column Chart Ppt PowerPoint Presentation Professional Aids
This is a stacked column chart ppt powerpoint presentation professional aids. This is a three stage process. The stages in this process are bar chart, finance, marketing, business, analysis.

Combo Chart Finance Marketing Ppt PowerPoint Presentation Layouts Design Templates
This is a combo chart finance marketing ppt powerpoint presentation layouts design templates. This is a three stage process. The stages in this process are combo chart, finance, marketing, business, analysis.

Area Chart Finance Ppt PowerPoint Presentation Professional File Formats
This is a area chart finance ppt powerpoint presentation professional file formats . This is a three stage process. The stages in this process are area chart, finance, marketing, management, investment.

Area Chart Finance Ppt PowerPoint Presentation Gallery Pictures
This is a area chart finance ppt powerpoint presentation gallery pictures . This is a three stage process. The stages in this process are area chart, finance, marketing, management, investment.

Strategies For Dynamic Supply Chain Agility Segmenting The Vendors Based On Overall Performance Diagrams PDF
This slide showcases the classification of potential vendors into defined groups based on their performance scores. It also indicates that vendor 1 will get placed into group A and vendor 2 into group B. Do you have to make sure that everyone on your team knows about any specific topic I yes, then you should give Strategies For Dynamic Supply Chain Agility Segmenting The Vendors Based On Overall Performance Diagrams PDF a try. Our experts have put a lot of knowledge and effort into creating this impeccable Strategies For Dynamic Supply Chain Agility Segmenting The Vendors Based On Overall Performance Diagrams PDF. You can use this template for your upcoming presentations, as the slides are perfect to represent even the tiniest detail. You can download these templates from the Slidegeeks website and these are easy to edit. So grab these today.

Business Services Revenue Generated By Categories Engineering Company Financial Analysis Report Graphics PDF
The following slide highlights the business revenue generated by the engineering company in a given year. It shows revenue share from cities, players and geography, Cities include Tier I, Tier II, and Tier III, Players include government and private builders, geography includes north America, Europe and Asia pacific.If you are looking for a format to display your unique thoughts, then the professionally designed Business Services Revenue Generated By Categories Engineering Company Financial Analysis Report Graphics PDF is the one for you. You can use it as a Google Slides template or a PowerPoint template. Incorporate impressive visuals, symbols, images, and other charts. Modify or reorganize the text boxes as you desire. Experiment with shade schemes and font pairings. Alter, share or cooperate with other people on your work. Download Business Services Revenue Generated By Categories Engineering Company Financial Analysis Report Graphics PDF and find out how to give a successful presentation. Present a perfect display to your team and make your presentation unforgettable.
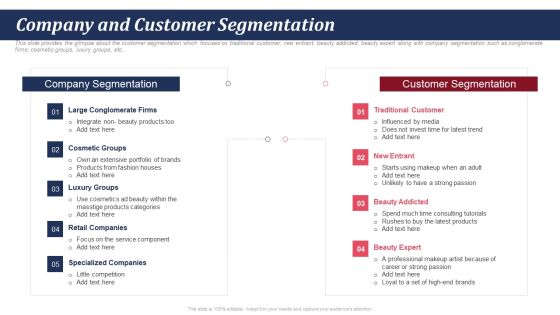
Pitch Deck For Self Care And Grooming Items Company And Customer Segmentation Ppt Infographic Template Themes PDF
This slide provides the glimpse about the customer segmentation which focuses on traditional customer, new entrant, beauty addicted, beauty expert along with company segmentation such as conglomerate firms, cosmetic groups, luxury groups, etc. This is a pitch deck for self care and grooming items company and customer segmentation ppt infographic template themes pdf template with various stages. Focus and dispense information on four stages using this creative set, that comes with editable features. It contains large content boxes to add your information on topics like company segmentation, customer segmentation. You can also showcase facts, figures, and other relevant content using this PPT layout. Grab it now.

CSR Report On Corporate Climate Strategy Brochure PDF
This slide illustrates climate strategy report as a key pillar of CSR. It includes purchased power and 5 year trends reduction in Greenhouse gas emissions etc. Showcasing this set of slides titled CSR Report On Corporate Climate Strategy Brochure PDF. The topics addressed in these templates are Purchased Power, Trends Reduction, Climate Strategy Report. All the content presented in this PPT design is completely editable. Download it and make adjustments in color, background, font etc. as per your unique business setting.

Steps To Develop Effective Digital Transformation And Innovation Strategy Sample PDF
This slide showcase the action planning steps in order to execute innovation strategies. It includes steps such as determining objective and approach, customer and competitor analysis, value proposition and core capabilities, etc. Presenting Steps To Develop Effective Digital Transformation And Innovation Strategy Sample PDF to dispense important information. This template comprises five stages. It also presents valuable insights into the topics including Define Value Proposition, Develop Core Capabilities, Determine Objective. This is a completely customizable PowerPoint theme that can be put to use immediately. So, download it and address the topic impactfully.

Steps Of ERP Data Migration Strategy Ppt PowerPoint Presentation Gallery Graphic Tips PDF
This slide showcases the steps of building the strategy for business ERP system data migration. The steps includes such as planning, preparation, design, execution, testing and maintenance. Presenting Steps Of ERP Data Migration Strategy Ppt PowerPoint Presentation Gallery Graphic Tips PDF to dispense important information. This template comprises six stages. It also presents valuable insights into the topics including Maintenance, Testing, Execution, Design. This is a completely customizable PowerPoint theme that can be put to use immediately. So, download it and address the topic impactfully.

Seven Step Public Promotion Marketing Strategy Development Process Ppt Outline Layout Ideas PDF
Following slide showcases seven steps process to develop public relation marketing strategy which can be used by business to increase customer retention rate. It includes steps such as define objectives, determine top players, develop content strategy, customized pitches, strengthen relation with players, content distribution and content scheduling. Presenting Seven Step Public Promotion Marketing Strategy Development Process Ppt Outline Layout Ideas PDF to dispense important information. This template comprises seven stages. It also presents valuable insights into the topics including Develop Content Strategy, Strengthen Relationship, Content Scheduling, Customized Pitches. This is a completely customizable PowerPoint theme that can be put to use immediately. So, download it and address the topic impactfully.
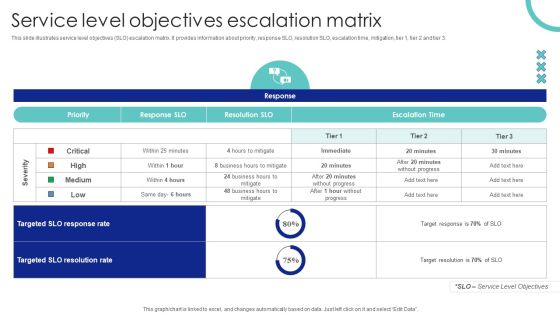
Service Level Objectives Escalation Matrix Ppt PowerPoint Presentation File Diagrams PDF
This slide illustrates service level objectives SLO escalation matrix. It provides information about priority, response SLO, resolution SLO, escalation time, mitigation, tier 1, tier 2 and tier 3. Slidegeeks is here to make your presentations a breeze with Service Level Objectives Escalation Matrix Ppt PowerPoint Presentation File Diagrams PDF With our easy to use and customizable templates, you can focus on delivering your ideas rather than worrying about formatting. With a variety of designs to choose from, you are sure to find one that suits your needs. And with animations and unique photos, illustrations, and fonts, you can make your presentation pop. So whether you are giving a sales pitch or presenting to the board, make sure to check out Slidegeeks first.
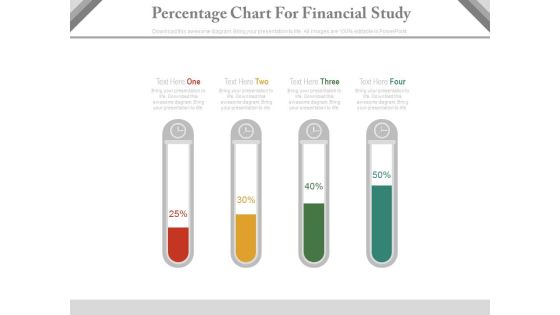
Test Tubes Percentage Chart For Financial Analysis Powerpoint Slides
This PPT slide contains test tubes percentage chart. You may download this PowerPoint template for financial analysis in your presentations. Make outstanding business presentation with this template.

Selection Of The Optimal Portfolio Chart Ppt Slides
This is a selection of the optimal portfolio chart ppt slides. This is a five stage process. The stages in this process are business, finance, marketing.
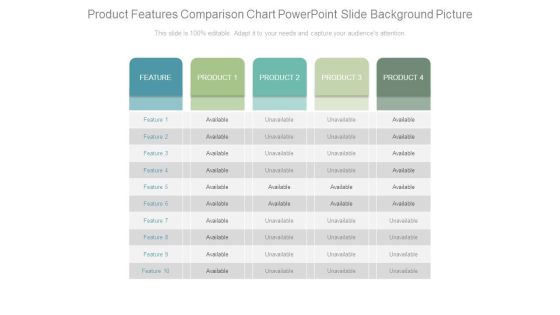
Product Features Comparison Chart Powerpoint Slide Background Picture
This is a product features comparison chart powerpoint slide background picture. This is a four stage process. The stages in this process are feature, product, available, unavailable.
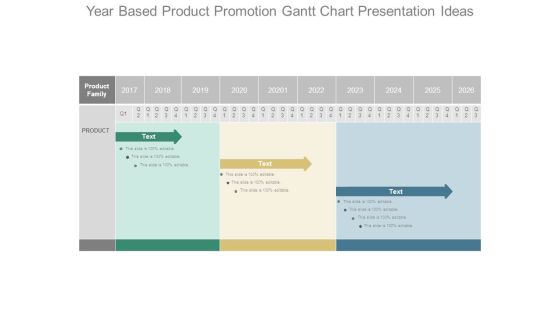
Year Based Product Promotion Gantt Chart Presentation Ideas
This is a year based product promotion gantt chart presentation ideas. This is a three stage process. The stages in this process are product family, product.

Competitive Environment Change Analysis Chart Ppt Slide Template
This is a competitive environment change analysis chart ppt slide template. This is a four stage process. The stages in this process are competitive landscape, brand.

Changes In Competitive Environment Landscape Chart Powerpoint Layout
This is a changes in competitive environment landscape chart powerpoint layout. This is a four stage process. The stages in this process are competitive landscape, brand.

Work Plan Activities Chart Sample Of Ppt Presentation
This is a work plan activities chart sample of ppt presentation. This is a ten stage process. The stages in this process are table, management, business, strategy, presentation.

Business Operational Plan Pie Charts Ppt PowerPoint Presentation Templates
This is a business operational plan pie charts ppt powerpoint presentation templates. This is a three stage process. The stages in this process are finance, business, marketing, percentage.

Competitive Analysis Bubble Chart Ppt PowerPoint Presentation Templates
This is a competitive analysis bubble chart ppt powerpoint presentation templates. This is a six stage process. The stages in this process are product, business, management, marketing, strategy.
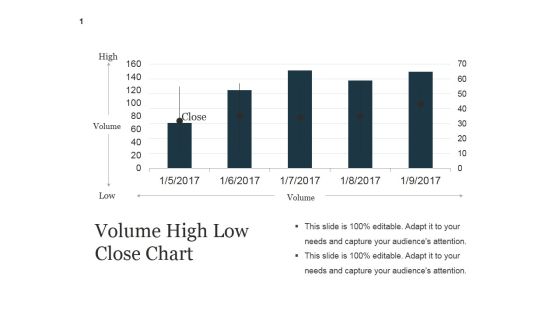
Volume High Low Close Chart Ppt PowerPoint Presentation Guide
This is a volume high low close chart ppt powerpoint presentation guide. This is a five stage process. The stages in this process are high, volume, close, low.
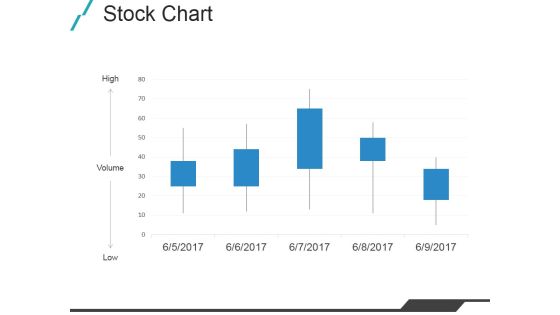
Stock Chart Ppt PowerPoint Presentation Outline Slide Portrait
This is a stock chart ppt powerpoint presentation outline slide portrait. This is a five stage process. The stages in this process are high, volume, low, business.

Stock Chart Ppt PowerPoint Presentation Infographic Template Clipart Images
This is a stock chart ppt powerpoint presentation infographic template clipart images. This is a five stage process. The stages in this process are high, volume, low, close.

Activity Planning Chart Ppt PowerPoint Presentation Show Layout
This is a activity planning chart ppt powerpoint presentation show layout. This is a six stage process. The stages in this process are activities, activity, business, table, management.

Bar Chart Ppt PowerPoint Presentation Styles Graphics Example
This is a bar chart ppt powerpoint presentation styles graphics example. This is a nine stage process. The stages in this process are graph, growth, success, business, finance.

Combo Chart Ppt Powerpoint Presentation Infographic Template File Formats
This is a combo chart ppt powerpoint presentation infographic template file formats. This is a four stage process. The stages in this process are product, growth, management, business.

High Low Close Chart Ppt PowerPoint Presentation Infographics Shapes
This is a high low close chart ppt powerpoint presentation infographics shapes. This is a five stage process. The stages in this process are close, volume, high, low.

Stock Chart Ppt PowerPoint Presentation Summary Background Designs
This is a stock chart ppt powerpoint presentation summary background designs. This is a five stage process. The stages in this process are high, volume, low.

Stock Chart Ppt PowerPoint Presentation Summary Graphics Pictures
This is a stock chart ppt powerpoint presentation summary graphics pictures. This is a five stage process. The stages in this process are high, volume, low, close, finance.
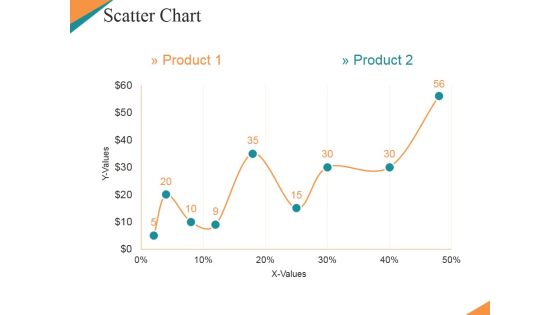
Scatter Chart Ppt PowerPoint Presentation Model Clipart Images
This is a scatter chart ppt powerpoint presentation model clipart images. This is a nine stage process. The stages in this process are finance, management, strategy, marketing, business.

Bar Chart Ppt PowerPoint Presentation Infographic Template Example
This is a bar chart ppt powerpoint presentation infographic template example. This is a seven stage process. The stages in this process are business, finance, marketing, percentage.
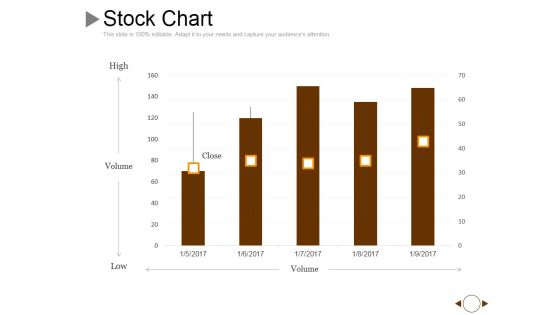
Stock Chart Ppt PowerPoint Presentation Gallery Graphics Example
This is a stock chart ppt powerpoint presentation gallery graphics example. This is a five stage process. The stages in this process are volume, high, low, close.
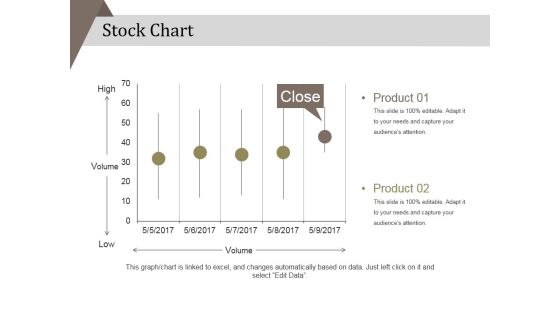
Stock Chart Ppt PowerPoint Presentation Portfolio Background Designs
This is a stock chart ppt powerpoint presentation portfolio background designs. This is a five stage process. The stages in this process are product, high, low .

Doughnut Chart Ppt PowerPoint Presentation Visual Aids Files
This is a doughnut chart ppt powerpoint presentation visual aids files. This is a three stage process. The stages in this process are finance, donut, percentage, business, marketing.

High Low Close Chart Ppt PowerPoint Presentation Infographics Templates
This is a high low close chart ppt powerpoint presentation infographics templates. This is a nine stage process. The stages in this process are high, volume, low, close.

Stock Chart Ppt PowerPoint Presentation Pictures Graphics Tutorials
This is a stock chart ppt powerpoint presentation pictures graphics tutorials. This is a five stage process. The stages in this process are high, volume, low, product, business.

Donut Pie Chart Ppt PowerPoint Presentation Show Topics
This is a donut pie chart ppt powerpoint presentation show topics. This is a three stage process. The stages in this process are percentage, finance, donut, business.
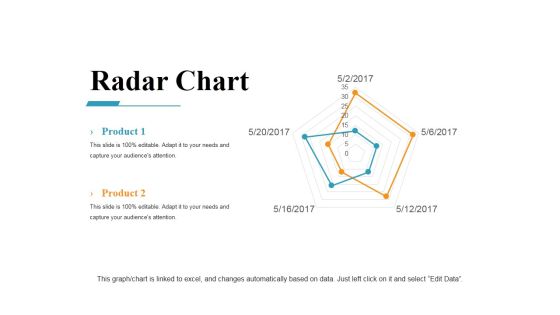
Radar Chart Ppt PowerPoint Presentation Ideas Master Slide
This is a radar chart ppt powerpoint presentation ideas master slide. This is a five stage process. The stages in this process are radar, business, marketing, strategy, finance.

Combo Chart Ppt PowerPoint Presentation Infographic Template Maker
This is a combo chart ppt powerpoint presentation infographic template maker. This is a three stage process. The stages in this process are business, finance, growth, investment, marketing.

Area Chart Product Finance Ppt PowerPoint Presentation Guide
This is a area chart product finance ppt powerpoint presentation guide. This is a four stage process. The stages in this process are business, management, financial, marketing, sales.
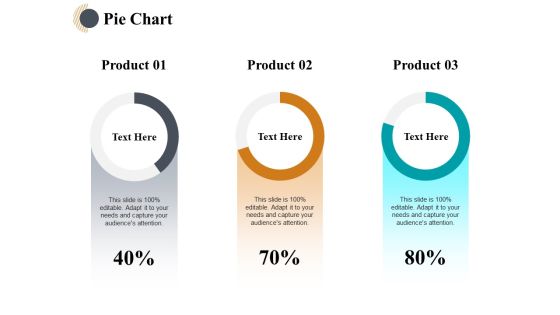
Pie Chart Finance Ppt PowerPoint Presentation Outline Pictures
This is a pie chart finance ppt powerpoint presentation outline pictures. This is a three stage process. The stages in this process are finance, analysis, business, investment, marketing.

Clustered Column Chart Ppt PowerPoint Presentation Ideas Picture
This is a clustered column chart ppt powerpoint presentation ideas picture. This is a three stage process. The stages in this process are percentage, product, management, marketing.

Area Chart Finance Ppt PowerPoint Presentation Infographics Deck
This is a area chart finance ppt powerpoint presentation infographics deck. This is a three stage process. The stages in this process are finance, marketing, management, investment, analysis.

Combo Chart Finance Ppt PowerPoint Presentation Styles Example
This is a combo chart finance ppt powerpoint presentation styles example. This is a three stage process. The stages in this process are finance, marketing, management, investment, analysis.

area chart finance ppt powerpoint presentation pictures format
This is a area chart finance ppt powerpoint presentation pictures format. This is a three stage process. The stages in this process are finance, marketing, management, investment, analysis.
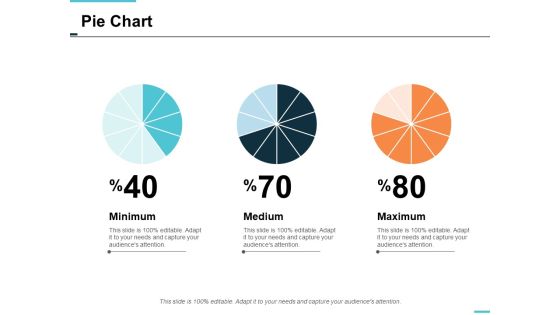
pie chart finance ppt powerpoint presentation styles skills
This is a pie chart finance ppt powerpoint presentation styles skills. This is a three stage process. The stages in this process are finance, marketing, management, investment, analysis.

Clustered Chart Finance Ppt PowerPoint Presentation Summary Guide
This is a clustered chart finance ppt powerpoint presentation summary guide. This is a three stage process. The stages in this process are finance, marketing, management, investment, analysis.

Combo Chart Finance Ppt PowerPoint Presentation Portfolio Guidelines
This is a combo chart finance ppt powerpoint presentation portfolio guidelines. This is a three stage process. The stages in this process are finance, marketing, management, investment, analysis.
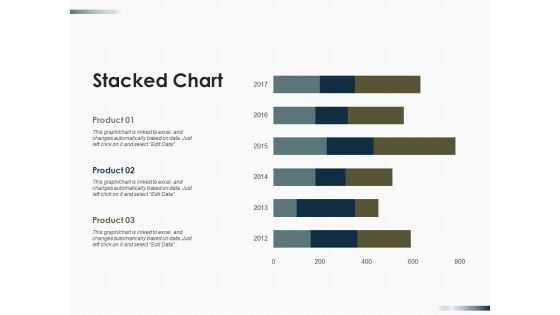
Stacked Chart Finance Ppt PowerPoint Presentation Outline Infographics
This is a stacked chart finance ppt powerpoint presentation outline infographics. This is a three stage process. The stages in this process are finance, marketing, management, investment, analysis.

Stacked Column Chart Ppt PowerPoint Presentation Slides Files
This is a stacked column chart ppt powerpoint presentation slides files. This is a three stage process. The stages in this process are percentage, product, business, marketing.

Area Chart Contribution Ppt PowerPoint Presentation Gallery Structure
This is a area chart contribution ppt powerpoint presentation gallery structure. This is a three stage process. The stages in this process are business, management, strategy, analysis, marketing.

Donut Chart Management Ppt Powerpoint Presentation Slides Aids
This is a donut chart management ppt powerpoint presentation slides aids. This is a six stage process. The stages in this process are finance, marketing, management, investment, analysis.

Column Chart Finance Ppt Powerpoint Presentation Summary Visuals
This is a column chart finance ppt powerpoint presentation summary visuals. This is a four stage process. The stages in this process are finance, marketing, management, investment, analysis.

area chart finance ppt powerpoint presentation layouts ideas
This is a area chart finance ppt powerpoint presentation layouts ideas. This is a three stage process. The stages in this process are finance, marketing, management, investment, analysis.
 Home
Home