Two Parts

Software Dashboard Manager Test Diagram Presentation Examples
This is a software dashboard manager test diagram presentation examples. This is a four stage process. The stages in this process are issues by risk level, reported issues, location on map, top contributing factors.

Supply Chain Metrics And Kpi Examples Presentation Visuals
This is a supply chain metrics and kpi examples presentation visuals. This is a four stage process. The stages in this process are carrying cost of inventory, inventory turnover, order tracking, rate of return.
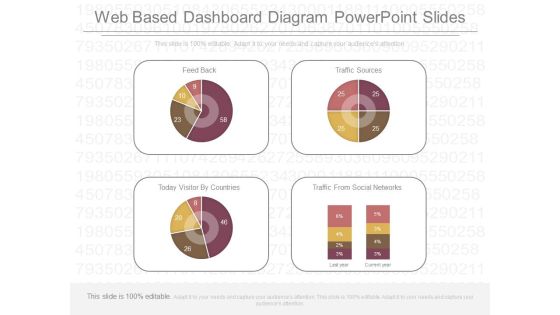
Web Based Dashboard Diagram Powerpoint Slides
This is a web based dashboard diagram powerpoint slides. This is a four stage process. The stages in this process are feed back, traffic sources, today visitor by countries, traffic from social networks.

Enterprise Dashboard Ppt Presentation Powerpoint Example
This is a enterprise dashboard ppt presentation powerpoint example. This is a three stage process. The stages in this process are balance scorecard, enterprise performance, industry trends.
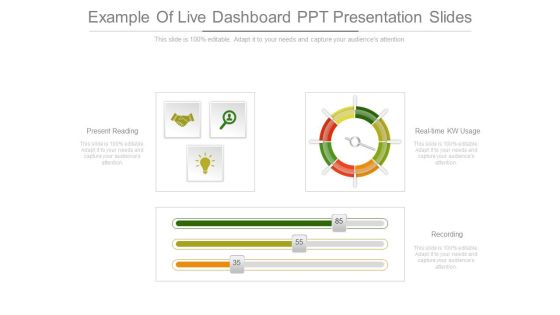
Example Of Live Dashboard Ppt Presentation Slides
This is a example of live dashboard ppt presentation slides. This is a three stage process. The stages in this process are present reading, real time kw usage, recording.
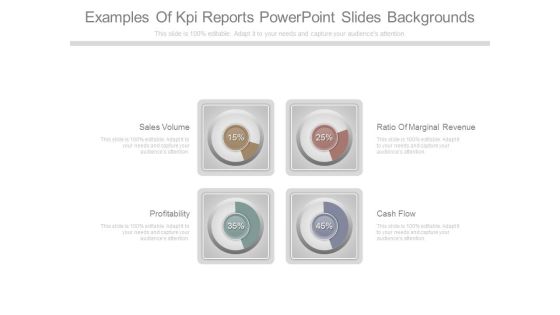
Examples Of Kpi Reports Powerpoint Slides Backgrounds
This is a examples of kpi reports powerpoint slides backgrounds. This is a four stage process. The stages in this process are sales volume, profitability, ratio of marginal revenue, cash flow.
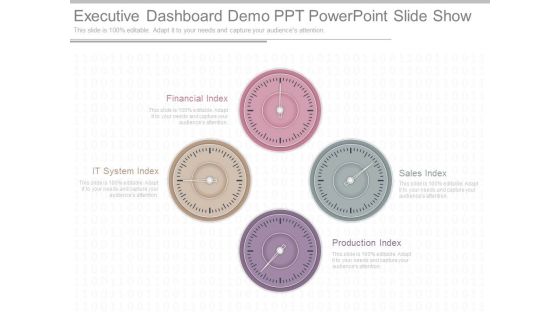
Executive Dashboard Demo Ppt Powerpoint Slide Show
This is a executive dashboard demo ppt powerpoint slide show. This is a four stage process. The stages in this process are financial index, it system index, production index, sales index.

Executive Dashboard Design Business Diagram Powerpoint Slides
This is a executive dashboard design business diagram powerpoint slides. This is a three stage process. The stages in this process are jan, feb, mar, apr, may.
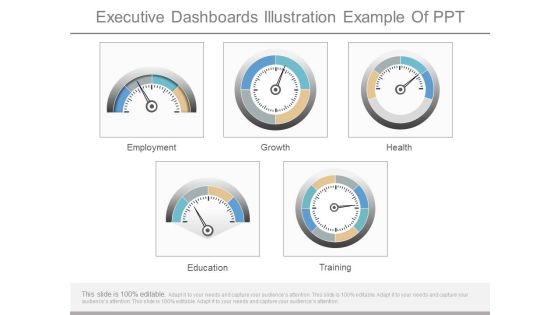
Executive Dashboards Illustration Example Of Ppt
This is a executive dashboards illustration example of ppt. This is a five stage process. The stages in this process are employment, growth, health, education, training.
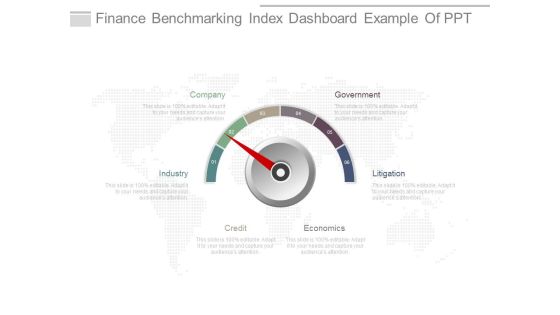
Finance Benchmarking Index Dashboard Example Of Ppt
This is a finance benchmarking index dashboard example of ppt. This is a six stage process. The stages in this process are industry, company, government, litigation, economics, credit.
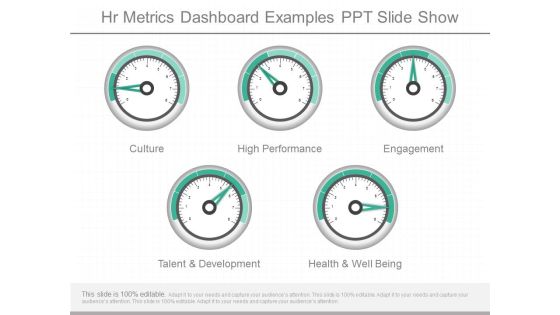
Hr Metrics Dashboard Examples Ppt Slide Show
This is a hr metrics dashboard examples ppt slide show. This is a five stage process. The stages in this process are culture, high performance, engagement, talent and development, health and well being.
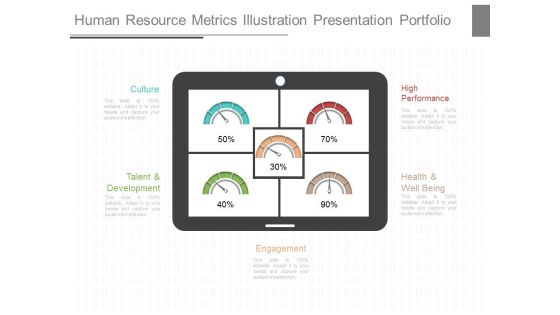
Human Resource Metrics Illustration Presentation Portfolio
This is a human resource metrics illustration presentation portfolio. This is a five stage process. The stages in this process are culture, high performance, talent and development, health and well being, engagement.
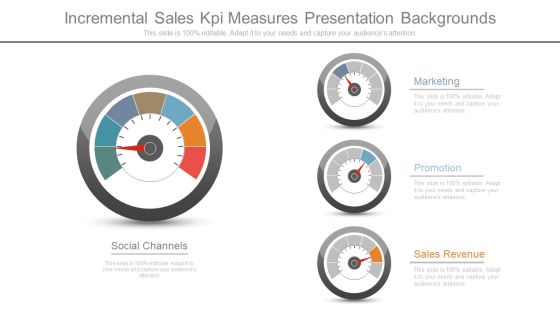
Incremental Sales Kpi Measures Presentation Backgrounds
This is a incremental sales kpi measures presentation backgrounds. This is a four stage process. The stages in this process are marketing, promotion, sales revenue, social channels.
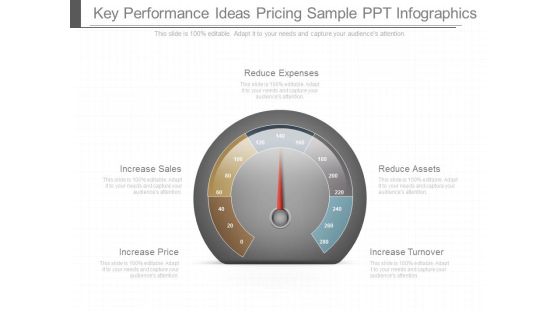
Key Performance Ideas Pricing Sample Ppt Infographics
This is a key performance ideas pricing sample ppt infographics. This is a five stage process. The stages in this process are increase price, increase sales, reduce expenses, reduce assets, increase turnover.

Key Performance Indicator Dashboard Diagram Example Of Ppt
This is a key performance indicator dashboard diagram example of ppt. This is a five stage process. The stages in this process are relationships, account plans, account strategy, setting tools, reporting.

Kpi Dashboard Diagram Example Of Ppt Presentation
This is a kpi dashboard diagram example of ppt presentation. This is a five stage process. The stages in this process are business, direction, objectives, data, study.

Kpi Dashboard Ppt Presentation Background Images
This is a kpi dashboard ppt presentation background images. This is a three stage process. The stages in this process are revenue, labor cost, customer satisfaction.
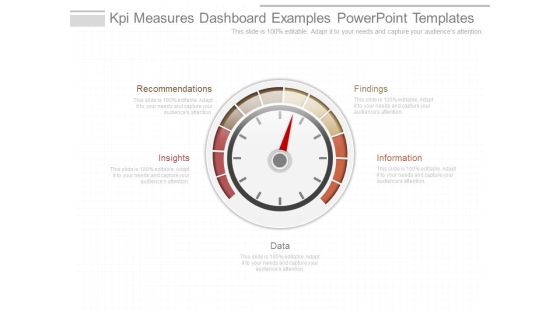
Kpi Measures Dashboard Examples Powerpoint Templates
This is a kpi measures dashboard examples powerpoint templates. This is a four stage process. The stages in this process are recommendations, insights, data, information, findings.

Kpi Reporting Dashboard Powerpoint Slide Background Designs
This is a kpi reporting dashboard powerpoint slide background designs. This is a three stage process. The stages in this process are stability, model assessment, characteristic.
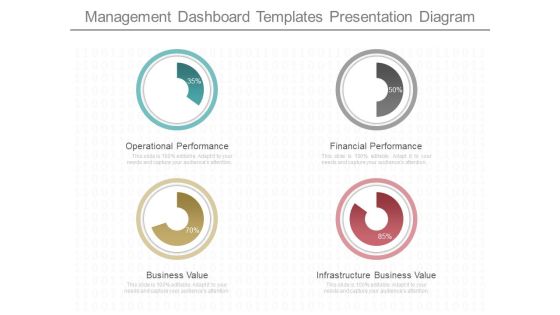
Management Dashboard Templates Presentation Diagram
This is a management dashboard templates presentation diagram. This is a four stage process. The stages in this process are operational performance, business value, financial performance, infrastructure business value.

Manufacturing Kpi Examples Powerpoint Slides
This is a manufacturing kpi examples powerpoint slides. This is a six stage process. The stages in this process are planning, production execution, production quality, costing, work order analysis, inventory.
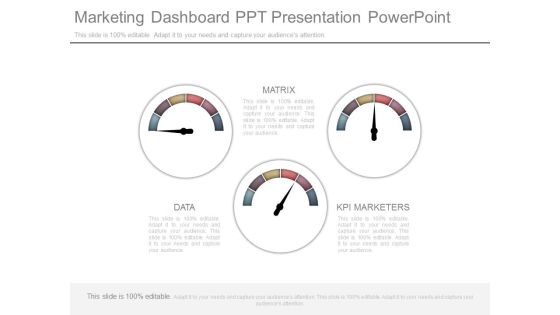
Marketing Dashboard Ppt Presentation Powerpoint
This is a marketing dashboard ppt presentation powerpoint. This is a three stage process. The stages in this process are data, matrix, kpi marketers.

Measuring Competency Template Ppt Samples Download
This is a measuring competency template ppt samples download. This is a four stage process. The stages in this process are knowledge, skill, performance, attitude.

Performance Indicators Dashboard Example Powerpoint Layout
This is a performance indicators dashboard example powerpoint layout. This is a four stage process. The stages in this process are management, resources, processes, analyze solution.
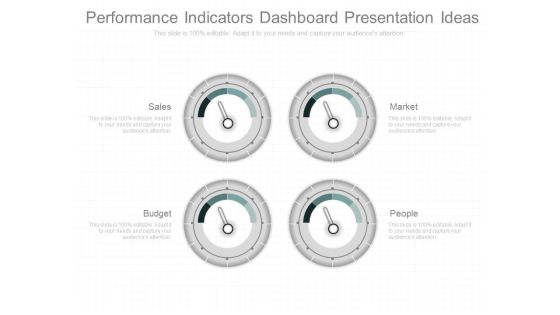
Performance Indicators Dashboard Presentation Ideas
This is a performance indicators dashboard presentation ideas. This is a four stage process. The stages in this process are sales, market, budget, people.

Portfolio Management Dashboard Diagram Powerpoint Slides
This is a portfolio management dashboard diagram powerpoint slides. This is a three stage process. The stages in this process are portfolio delivery roadmap, portfolio financials, project alpha, project beeta, project gama, project zeta, project zeema, schedule, risks, issues, budget.
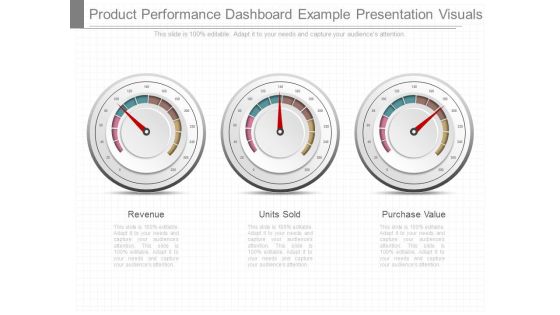
Product Performance Dashboard Example Presentation Visuals
This is a product performance dashboard example presentation visuals. This is a three stage process. The stages in this process are revenue, units sold, purchase value.

Project Management Kpi Dashboard Diagram Powerpoint Images
This is a project management kpi dashboard diagram powerpoint images. This is a four stage process. The stages in this process are project budget, project goals, project task management, project schedule.
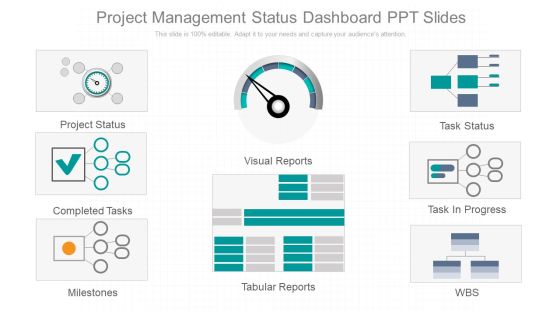
Project Management Status Dashboard Ppt Slides
This is a project management status dashboard ppt slides. This is a eight stage process. The stages in this process are project status, completed tasks, milestones, visual reports, tabular reports, task status, task in progress, wbs.

Project Status Visual Dashboard Indicator Ppt Images Gallery
This is a project status visual dashboard indicator ppt images gallery. This is a four stage process. The stages in this process are business, marketing, dashboard, measure, presentation.
Project Tracking Dashboard Template Ppt Sample
This is a project tracking dashboard template ppt sample. This is a five stage process. The stages in this process are requirements, analytics, needs, performance, analysis.

Average Days Sales Outstanding Analysis Ppt Example
This is a average days sales outstanding analysis ppt example. This is a four stage process. The stages in this process are target for week, inventory, sales vs quotes, sales vs quotes.

Bi Dashboard Design For Solutions Ppt Powerpoint Slides
This is a bi dashboard design for solutions ppt powerpoint slides. This is a four stage process. The stages in this process are total understand, total brands, total revenue, total sales.

Bi Dashboard Gallery Diagram Powerpoint Presentation
This is a bi dashboard gallery diagram powerpoint presentation. This is a four stage process. The stages in this process are business intelligence, month.

Build Dashboard For Business Diagram Powerpoint Show
This is a build dashboard for business diagram powerpoint show. This is a four stage process. The stages in this process are average internal pv examination lead time, average entry variance, average internal audit lead time, amount contribution.

Business Analysis Kpi Diagram Powerpoint Slides
This is a business analysis kpi diagram powerpoint slides. This is a one stage process. The stages in this process are performance level.

Business Company Dashboards Ppt Powerpoint Slide Show
This is a business company dashboards ppt powerpoint slide show. This is a four stage process. The stages in this process are presentation, finance, management, business, strategy, success.

Business Dashboard Diagram Ppt Powerpoint Slides
This is a business dashboard diagram ppt powerpoint slides. This is a three stage process. The stages in this process are low, medium, high.

Business Departments Performance Metrics Ppt Slides
This is a business departments performance metrics ppt slides. This is a seven stage process. The stages in this process are engineering, construction, maintenance, operations, safety, finance, environment.

Business Intelligence Dashboard Design Ppt Powerpoint Topics
This is a business intelligence dashboard design ppt powerpoint topics. This is a four stage process. The stages in this process are sales analysis, sales forecasting, global distribution, sales by region, latin america, north america, eastern europe, western europe.

Business Kpi Dashboard Design Presentation Diagrams
This is a business kpi dashboard design presentation diagrams. This is a four stage process. The stages in this process are idea, plan, strategy, solution analysis.

Business Kpi Dashboard Diagram Powerpoint Templates
This is a business kpi dashboard diagram powerpoint templates. This is a six stage process. The stages in this process are analytics, cost per sales, reporting, kpis, dashboard, visualization.

Business Kpi Dashboard Example Powerpoint Presentation
This is a business kpi dashboard example powerpoint presentation. This is a four stage process. The stages in this process are marketing, sales, operations, customer.
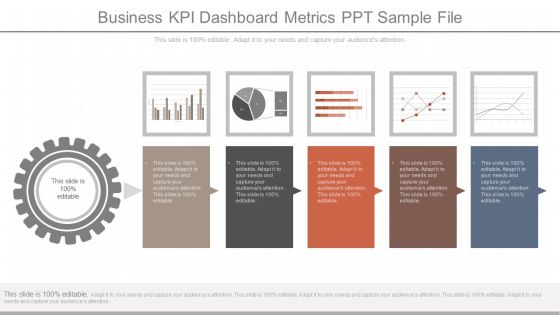
Business Kpi Dashboard Metrics Ppt Sample File
This is a business kpi dashboard metrics ppt sample file. This is a five stage process. The stages in this process are business, finance, management, success, marketing, presentation.

Business Management Dashboard Design Ppt Slides Show
This is a business management dashboard design ppt slides show. This is a four stage process. The stages in this process are crm system, property system, asset system, finance system.

Business Object Crystal Report Ppt Powerpoint Show
This is a business object crystal report ppt powerpoint show. This is a three stage process. The stages in this process are actual vs budget, monthly sales, monthly sales forecasting, country, total sales, percent of total, usa, germany, england, switzerland, italy, others.

Business Performance Dashboard Analysis Diagram Powerpoint Slides
This is a business performance dashboard analysis diagram powerpoint slides. This is a three stage process. The stages in this process are measure, business, management, presentation, process.

Business Process Metrics Ppt Sample Presentations
This is a business process metrics ppt sample presentations. This is a five stage process. The stages in this process are communication study, goal process, success, strategic system, sales review.

Capital Markets Dashboard Ppt Powerpoint Slide Background
This is a capital markets dashboard ppt powerpoint slide background. This is a three stage process. The stages in this process are weekly sales, product inventory, key performance indicators.

Competitive Intelligence Dashboard Diagram Ppt Slides
This is a competitive intelligence dashboard diagram ppt slides. This is a four stage process. The stages in this process are monthly sales, inventory turns, customer complaints, company, subject area.

Customer Retention Kpi Measures Ppt Example
This is a customer retention kpi measures ppt example. This is a four stage process. The stages in this process are retained, new, converted, attrition.
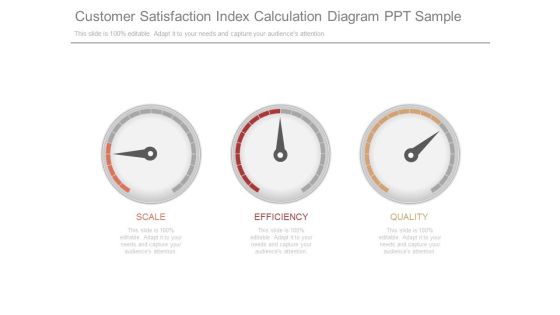
Customer Satisfaction Index Calculation Diagram Ppt Sample
This is a customer satisfaction index calculation diagram ppt sample. This is a three stage process. The stages in this process are scale, efficiency, quality.

Customer Service Key Performance Indicators Ppt Example
This is a customer service key performance indicators ppt example. This is a three stage process. The stages in this process are overall satisfaction with service, satisfaction with value for money, overall satisfaction with relationship.

Daily Executive Dashboards For Web Ppt Presentation Ideas
This is a daily executive dashboards for web ppt presentation ideas. This is a six stage process. The stages in this process are homepage, login, purchase ticket, email confirmation, ecommerce website, revenue per minute.

Dashboard Design And Development For Travel Diagram Background
This is a dashboard design and development for travel diagram background. This is a five stage process. The stages in this process are number of trips, sales, delayed flights, regional load, flight expense.

Dashboard Design Sample Ppt Powerpoint Slide Ideas
This is a dashboard design sample ppt powerpoint slide ideas. This is a four stage process. The stages in this process are your current setup, message board, quick stats, progress towards goals, total posts, comments, social reactions, new users, hourly visits, bounce rate.

Dashboard Design Tools Ppt Presentation Slides
This is a dashboard design tools ppt presentation slides. This is a three stage process. The stages in this process are performance, speed, energy.

Dashboard For Six Sigma Ppt Powerpoint Templates
This is a dashboard for six sigma ppt powerpoint templates. This is a four stage process. The stages in this process are program savings, project count, project cycle time, six sigma training.

Dashboard Performance Indicators Ppt Powerpoint Images
This is a dashboard performance indicators ppt powerpoint images. This is a four stage process. The stages in this process are daily activities, average consumption, covered distance, clock.

Dashboard Program Ppt Presentation Powerpoint
This is a dashboard program ppt presentation powerpoint. This is a six stage process. The stages in this process are tasks, progress, matrix, resource, utilization, time, safety, progress, sales rate.


 Continue with Email
 Sign up for an account
 Home
Home


