Two Parts
Strategy Diagram Post It Notes Style Mba Models And Frameworks
Activate the energies of your audience with our Strategy Diagram post it notes style MBA Models And Frameworks Powerpoint Templates. Get their creative juices flowing with your words. Enhance the stature of your presentation with our Strategy Diagram post it notes style MBA Models And Frameworks Powerpoint Templates. Adorn the beauty of your thoughts with their colourful backgrounds.

Business Cycle Diagram 3d Currency Symbols Business Diagram
Analyze Ailments On Our Business Cycle Diagram 3D Currency Symbols Business Diagram Powerpoint Templates. Bring Out The Thinking Doctor In You. Dock Your Thoughts With Our Business Cycle Diagram 3D Currency Symbols Business Diagram Powerpoint Templates. They Will Launch Them Into Orbit.
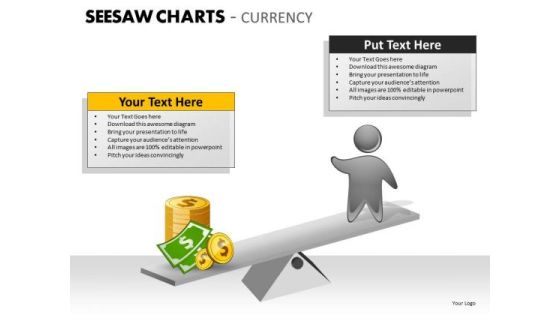
Business Cycle Diagram Seesaw Charts Currency Consulting Diagram
Get Out Of The Dock With Our Business Cycle Diagram Seesaw Charts Currency Consulting Diagram Powerpoint Templates. Your Mind Will Be Set Free.

Business Finance Strategy Development Seesaw Charts Currency Marketing Diagram
Document The Process On Our Business Finance Strategy Development Seesaw Charts Currency Marketing Diagram Powerpoint Templates. Make A Record Of Every Detail.

Business Framework Model 3d Currency Symbols Business Diagram
Be The Doer With Our Business Framework Model 3D Currency Symbols Business Diagram Powerpoint Templates. Put Your Thoughts Into Practice.

Business Framework Model 3d Currency Symbols Consulting Diagram
Our Business Framework Model 3D Currency Symbols Consulting Diagram Powerpoint Templates Team Are A Dogged Lot. They Keep At It Till They Get It Right.
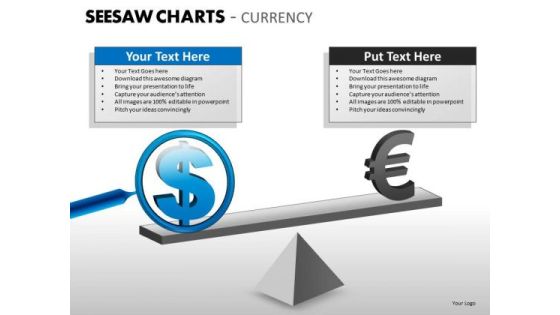
Business Framework Model Seesaw Charts Currency Business Diagram
Get The Doers Into Action. Activate Them With Our Business Framework Model Seesaw Charts Currency Business Diagram Powerpoint Templates.
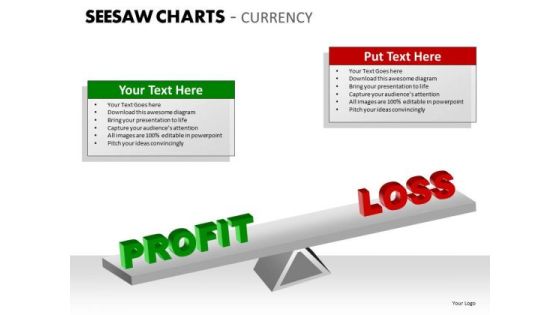
Business Framework Model Seesaw Charts Currency Strategy Diagram
Put In A Dollop Of Our Business Framework Model Seesaw Charts Currency Strategy Diagram Powerpoint Templates. Give Your Thoughts A Distinctive Flavor.

Consulting Diagram 3d Currency Symbols Business Cycle Diagram
Get The Domestics Right With Our Consulting Diagram 3D Currency Symbols Business Cycle Diagram Powerpoint Templates. Create The Base For Thoughts To Grow.
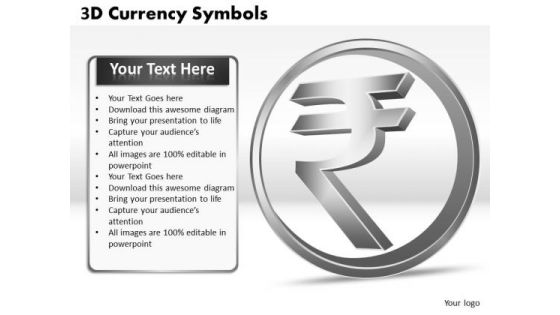
Consulting Diagram 3d Currency Symbols Mba Models And Frameworks
Doll Up Your Thoughts With Our Consulting Diagram 3D Currency Symbols MBA Models And Frameworks Powerpoint Templates. They Will Make A Pretty Picture.
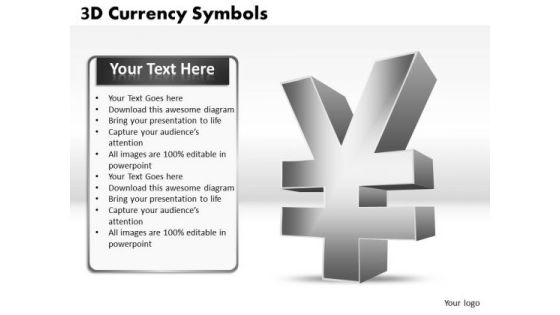
Marketing Diagram 3d Currency Symbols Strategic Management
Establish The Dominance Of Your Ideas. Our Marketing Diagram 3D Currency Symbols Strategic Management Powerpoint Templates Will Put Them On Top.

Marketing Diagram Seesaw Charts Currency Business Cycle Diagram
Dominate Proceedings With Your Ideas. Our Marketing Diagram Seesaw Charts Currency Business Cycle Diagram Powerpoint Templates Will Empower Your Thoughts.
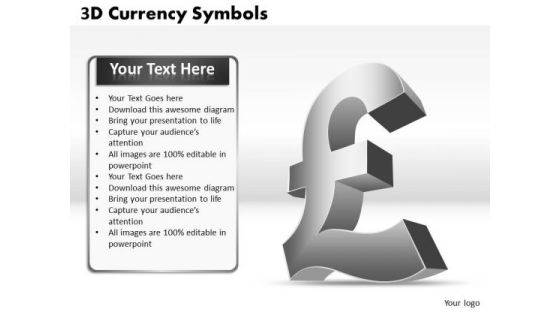
Mba Models And Frameworks 3d Currency Symbols Marketing Diagram
Establish Your Dominion With Our MBA Models And Frameworks 3D Currency Symbols Marketing Diagram Powerpoint Templates. Rule The Stage With Your Thoughts.
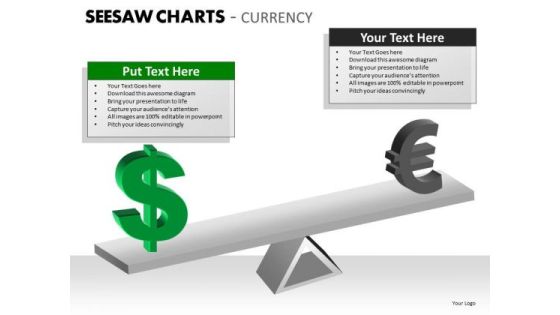
Mba Models And Frameworks Seesaw Charts Currency Business Diagram
Your Listeners Will Never Doodle. Our MBA Models And Frameworks Seesaw Charts Currency Business Diagram Powerpoint Templates Will Hold Their Concentration.
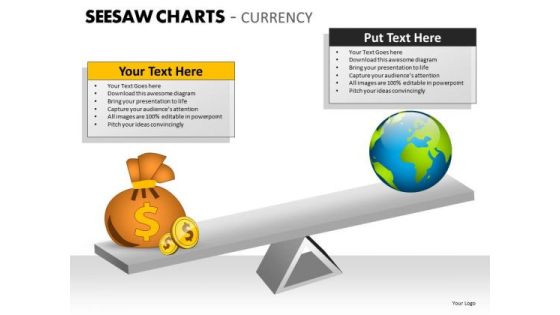
Mba Models And Frameworks Seesaw Charts Currency Marketing Diagram
Be A Donor Of Great Ideas. Display Your Charity On Our MBA Models And Frameworks Seesaw Charts Currency Marketing Diagram Powerpoint Templates.
Strategic Management 3d Currency Symbols Strategy Diagram
Open Up Doors That Lead To Success. Our Strategic Management 3D Currency Symbols Strategy Diagram Powerpoint Templates Provide The Handles.

Strategic Management Seesaw Charts Currency Business Cycle Diagram
Our Strategic Management Seesaw Charts Currency Business Cycle Diagram Powerpoint Templates Abhor Doodling. They Never Let The Interest Flag.

Strategic Management Seesaw Charts Currency Marketing Diagram
Deliver The Right Dose With Our Strategic Management Seesaw Charts Currency Marketing Diagram Powerpoint Templates. Your Ideas Will Get The Correct Illumination.

Strategic Management Seesaw Charts Currency Strategy Diagram
Our Strategic Management Seesaw Charts Currency Strategy Diagram Powerpoint Templates Deliver At Your Doorstep. Let Them In For A Wonderful Experience.

Strategy Diagram 3d Currency Symbols Strategic Management
Knock On The Door To Success With Our Strategy Diagram 3D Currency Symbols Strategic Management Powerpoint Templates. Be Assured Of Gaining Entry.

Strategy Diagram Seesaw Charts Currency Strategic Management
Connect The Dots With Our Strategy Diagram Seesaw Charts Currency Strategic Management Powerpoint Templates. Watch The Whole Picture Clearly Emerge.

About Customer Care Team Powerpoint Slides
On this template you can see team of four persons. This PowerPoint slide is an excellent tool for announcing the members of customer care team. Give a detailed introduction of your team with complete profile information.

Twitter Google Plus Facebook Social Media Powerpoint Slides
This professional slide contains graphics of Twitter, Google plus and Face book social media logos. You may use this chart for comparison of social media sites. Add this slide to your presentation and impress your superiors.

Dashboard To Impact The Performance Powerpoint Slides
This PowerPoint template graphics of meter chart. Download this PPT chart for business performance analysis. This PowerPoint slide is of great help in the business sector to make realistic presentations and provides effective way of presenting your newer thoughts.

Company Overview With Office Buildings Powerpoint Slides
Download this PowerPoint template to create an attention grabbing introductory slide. It contains company overview design with office buildings. Use this professional slide design to build a good reputation of your company.

Balloons Diagram For Financial Goal Planning Powerpoint Slides
This PowerPoint template has been designed with graphics of balloons diagram. You may download this diagram slide to depict balance between demand and supply. Add this slide to your presentation and impress your superiors.

Bar Graph For Statistical Analysis Powerpoint Slides
This PowerPoint template has been designed with bar chart and percentage values. You may download this PPT slide to depict statistical analysis. Add this slide to your presentation and impress your superiors.

Battery Chart With Percentage Values For Comparison PowerPoint Slides
This year?s sales has matched up with your expectations. Now match this slide with your presentation to show the same. Show your company?s performance or business growth with this four staged battery chart PowerPoint template. With this slide, you can easily convince your colleagues how your company gave a tremendous growth over the years or months. Perfect illustration to show that the targets are achieved. This PPT template is easy to edit. You can choose the color of your choice. Your colleagues are already impressed with the sales growth. Now impress others and choose this PPT innovative designed template.

Dashboard With Increasing Values Powerpoint Slides
This innovative, stunningly beautiful dashboard has been designed for data visualization. It contains pie charts with increasing percentage values. This PowerPoint template helps to display your information in a useful, simple and uncluttered way.

Dashboard With Low High Medium Indication Powerpoint Slides
This innovative, stunningly beautiful dashboard has been designed for data visualization. It contains dashboard with low, high and medium indication. This PowerPoint template helps to display your information in a useful, simple and orderly way.

Bank Design For Cash Flow Formula Powerpoint Slides
This PowerPoint template has been designed with diagram of bank with dollar sign. This PPT slide can be used to prepare presentations for Banks and Financial institutions and also for personal finances and tax planning. You can download finance PowerPoint template to prepare awesome presentations.

Bar Graph For Marketing Research Data Powerpoint Slides
This PowerPoint template has been designed with diagram of bar graph. This PPT slide can be used to prepare presentations for profit growth report and also for financial data analysis. You can download finance PowerPoint template to prepare awesome presentations.

Bar Graph For Marketing Research Process Powerpoint Slides
This PowerPoint template has been designed with diagram of bar graph. This PPT slide can be used to prepare presentations for profit growth report and also for financial data analysis. You can download finance PowerPoint template to prepare awesome presentations.

Circle Chart For Value Analysis Powerpoint Slides
This PowerPoint template has been designed for business presentations and corporate slides. The PowerPoint template has a high quality design. You can download this PowerPoint slide for corporate presentations or annual meeting and business plans.
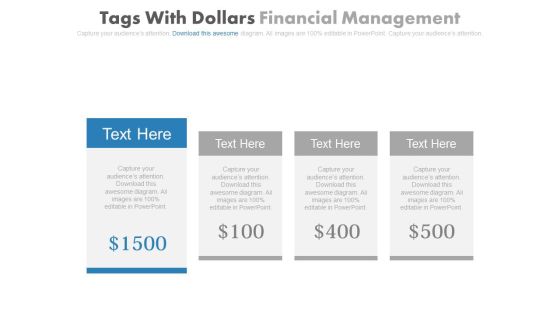
Four Dollar Tags For Corporate Entrepreneurship Powerpoint Slides
This PowerPoint template has been designed with diagram of four text tags with dollar price. This PPT slide can be used to prepare presentations for personal finances and tax planning. You can download finance PowerPoint template to prepare awesome presentations.
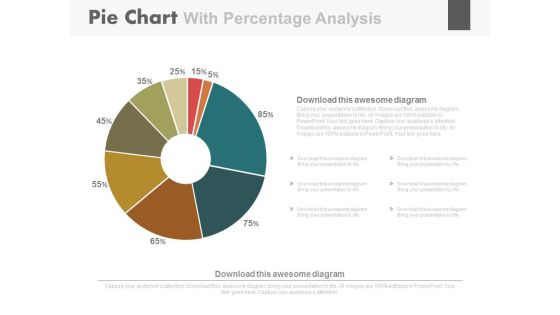
Pie Chart For Strategic Sales Plan Powerpoint Slides
This PowerPoint template has been designed with diagram of pie chart. This PPT slide can be used to prepare presentations on strategic sales plan. You can download finance PowerPoint template to prepare awesome presentations.
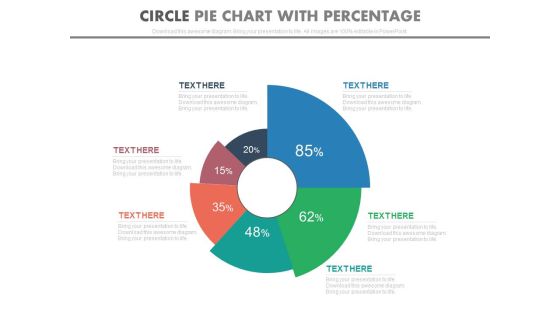
Pie Chart With Increasing Percentage Values Powerpoint Slides
This PowerPoint template has been designed with diagram of pie chart with increasing percentage values. This PPT slide can be used to prepare presentations for profit growth report and also for financial data analysis. You can download finance PowerPoint template to prepare awesome presentations.

Pie Charts For Financial Ratio Analysis Powerpoint Slides
This PowerPoint template has been designed with diagram of pie charts. This PPT slide can be used to prepare presentations for profit growth report and also for financial data analysis. You can download finance PowerPoint template to prepare awesome presentations.
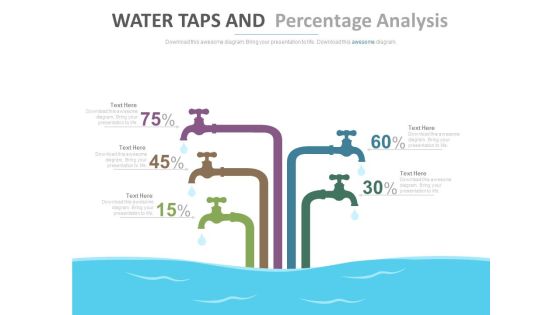
Water Taps For Working Capital Calculation Powerpoint Slides
This PowerPoint template has been designed with graphics of water taps. This PPT slide can be used to display working capital for business. You can download finance PowerPoint template to prepare awesome presentations.

Bar Graph For Year Based Analysis Powerpoint Slides
This PowerPoint template has been designed with year based bar graph. This diagram may be used to display yearly statistical analysis. Use this PPT slide design to make impressive presentations.

Bar Graph With Five Icons Powerpoint Slides
This PowerPoint slide contains diagram bar graph with icons. This PPT slide helps to exhibit concepts of financial deal and planning. Use this business slide to make impressive presentations.

Checklist With Financial Planning Icons Powerpoint Slides
This PowerPoint template contains business checklist with icons. Download this diagram slide to display financial planning and analysis. Etch your views in the brains of your audience with this diagram slide.

Circle Chart With Percentage Value Analysis Powerpoint Slides
This PowerPoint template has been designed with circular process diagram. This business diagram helps to exhibit financial process control and analysis. Use this diagram to visually support your content.
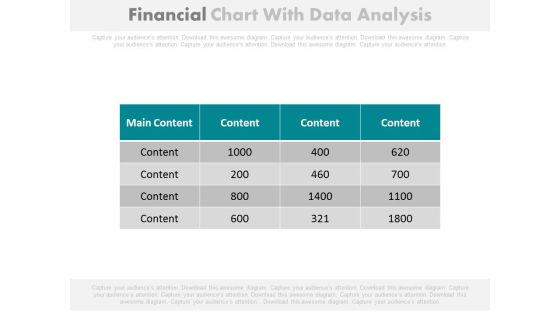
Financial Figures Data Analysis Report Powerpoint Slides
Our above PowerPoint template contains table chart with financial figures. This professional slide may be used to display data analysis report. Enlighten your audience with your breathtaking ideas.
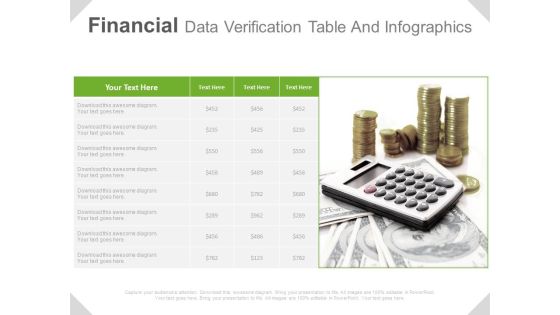
Financial Planning Table Infographic Diagram Powerpoint Slides
This PowerPoint template has been designed with table infographic diagram. This business slide is suitable for financial planning. Use this PPT slide to build an exclusive presentation.
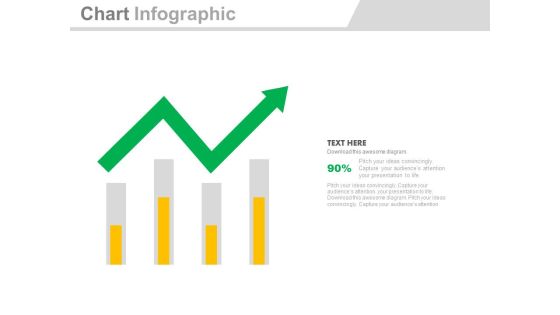
Four Bars With Green Growth Arrow Powerpoint Slides
Four bars with green arrow have been displayed in this business slide. This business diagram helps to exhibit process of business planning. Use this diagram to build an exclusive presentation.

Four Circles With Percentage Data Display Powerpoint Slides
This PowerPoint template has been designed with graphics of four circles. Download this PPT slide to display percentage data display. Use this professional template to build an exclusive presentation.
Four Colored Text Boxes With Icons Powerpoint Slides
This PowerPoint template has been designed with graphics of four text boxes. Download this PPT slide to display percentage data display. Use this professional template to build an exclusive presentation.

Four Tags For Financial Review And Analysis Powerpoint Slides
This PowerPoint template has been designed with four tags and financial values. This PowerPoint template helps to exhibit financial review and analysis. Use this diagram slide to build an exclusive presentation.
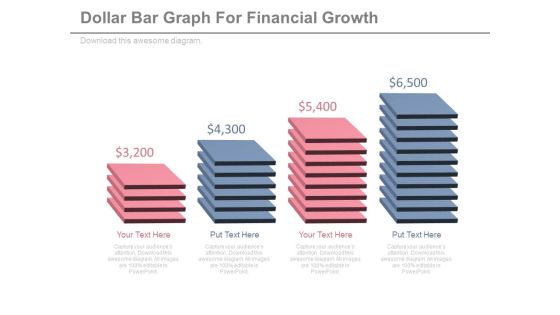
Illustration Of Dollar Value Slabs Powerpoint Slides
Pricing slabs have been displayed in this business slide. This PowerPoint template helps to exhibit financial growth process. Use this diagram slide to build an exclusive presentation.

Infographic Diagram For Business Process Analysis Powerpoint Slides
This PowerPoint slide contains business infographic diagram. This professional slide may be used to display business process analysis. Use this business template to make impressive presentations.
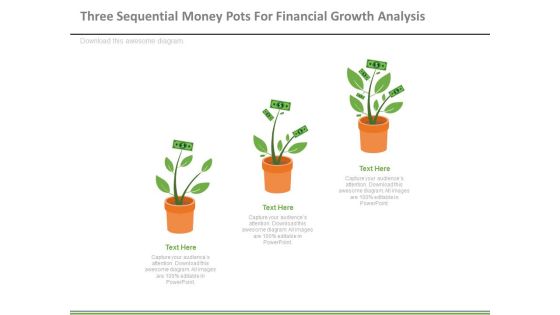
Money Plants For Financial Growth Analysis Powerpoint Slides
This PowerPoint slide contains graphics of three money plants. This professional slide may be used to display ideas for financial growth. Use this template to highlight to make impressive presentations.

Money Saving And Investment Ideas Powerpoint Slides
The above PPT template displays four financial icons. This diagram helps to exhibit money saving and investment ideas. Adjust the above diagram in your business presentations to visually support your content.
Mountain Chart With Social Media Icons Powerpoint Slides
The above PPT template displays mountain chart with social media icons. This PowerPoint template has been designed to exhibit users of social media. Download this PPT slide to attract the attention of your audience.

Pie Chart For Financial Ratio Analysis Powerpoint Slides
This PPT slide contains graphics of eight stage pie chart. Download this PowerPoint template slide for financial ratio analysis. This diagram is editable you can edit text, color, shade and style as per you need.
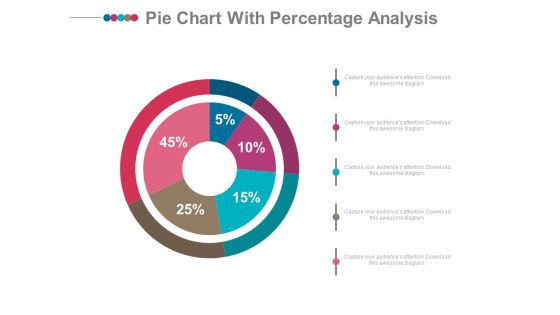
Pie Chart With Financial Data Comparison Powerpoint Slides
Emphatically define your message with our above template which contains graphics of pie chart. This PowerPoint template may be used to display financial data comparison. Grab the attention of your listeners with this slide.
Process Flow Diagram With Business Icons Powerpoint Slides
Emphatically define your message with our above infographic template. This PowerPoint template may be used to display business process flow. Grab the attention of your listeners with this slide.
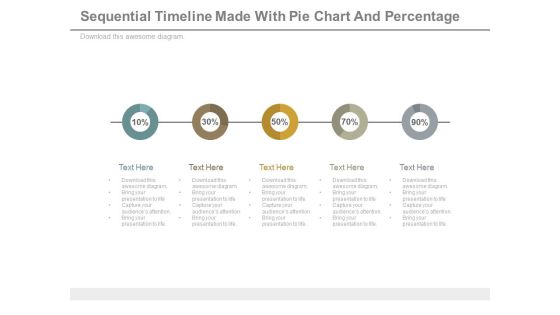
Sequential Timeline Diagram With Percentage Values Powerpoint Slides
This diagram contains graphics of linear circles timeline diagram. Download this diagram slide to display business planning and management. This diagram is editable you can edit text, color, shade and style as per you need.
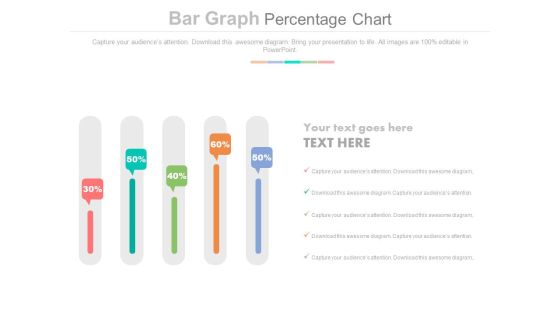
Sliders Percentage Data Chart Powerpoint Slides
This PowerPoint slide has been designed with slider chart and percentage data. This PPT diagram may be used to display business trends. This diagram slide can be used to make impressive presentations.
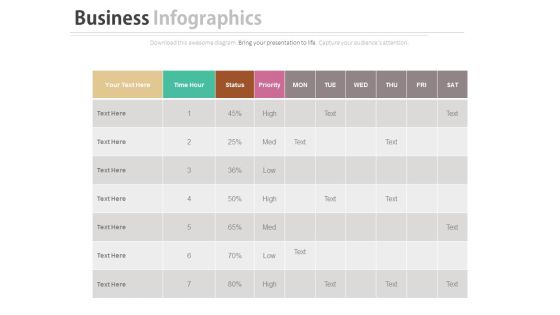
Work Sheet For Daily Activity Plan Schedule Powerpoint Slides
Our above business slide contains graphics of daily worksheet. This PowerPoint slide may be used to exhibit activity plan and schedule. Capture the attention of your audience with this slide.


 Continue with Email

 Home
Home


