Two Lists
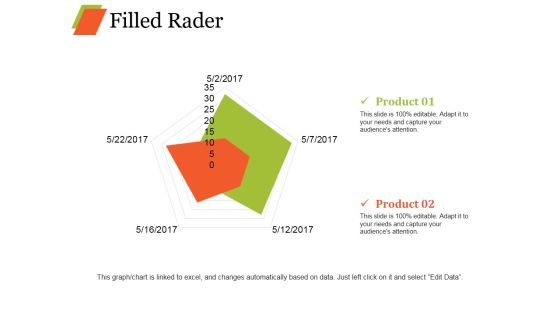
Filled Rader Ppt PowerPoint Presentation Inspiration Graphic Tips
This is a filled rader ppt powerpoint presentation inspiration graphic tips. This is a two stage process. The stages in this process are radar chart, shapes, product, business, marketing.
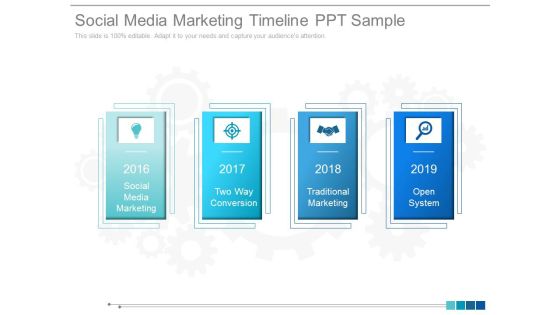
Social Media Marketing Timeline Ppt Sample
This is a social media marketing timeline ppt sample. This is a four stage process. The stages in this process are social media marketing, two way conversion, traditional marketing, open system.

Organic Visits And Backlinks Ppt PowerPoint Presentation Graphics
This is a organic visits and backlinks ppt powerpoint presentation graphics. This is a two stage process. The stages in this process are business, finance, pie chart, marketing, strategy, success.

Portfolio Evaluation Ppt PowerPoint Presentation Infographics Objects
This is a portfolio evaluation ppt powerpoint presentation infographics objects. This is a two stage process. The stages in this process are business, finance, bar graph, pie chart, marketing, analysis, investment.
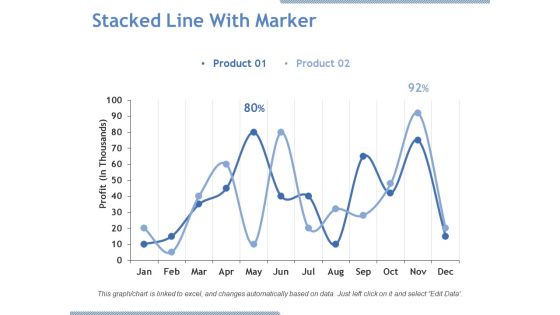
Stacked Line With Marker Ppt PowerPoint Presentation Pictures Graphics Download
This is a stacked line with marker ppt powerpoint presentation pictures graphics download. This is a two stage process. The stages in this process are product, profit, line chart, business, growth.
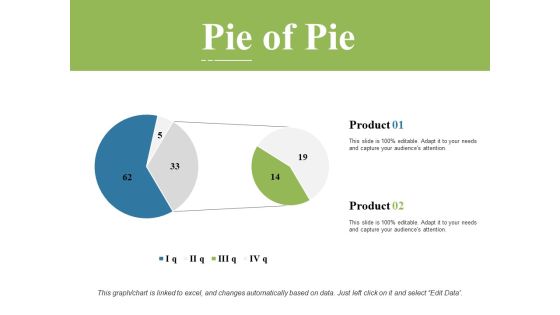
Pie Of Pie Ppt PowerPoint Presentation Styles Graphics Template
This is a pie of pie ppt powerpoint presentation styles graphics template. This is a two stage process. The stages in this process are Pie chart, finance, marketing, management, investment.

Stacked Bar Ppt PowerPoint Presentation Model Graphics
This is a stacked bar ppt powerpoint presentation model graphics. This is a two stage process. The stages in this process are stacked bar, product, chart and graph, finance, business.
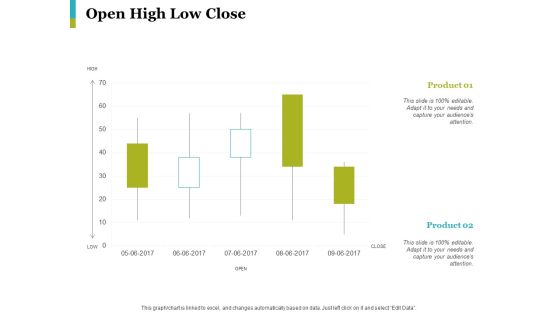
Open High Low Close Ppt PowerPoint Presentation Styles Graphics Example
This is a open high low close ppt powerpoint presentation styles graphics example.This is a two stage process. The stages in this process are product, percentage, chart, management, marketing.

Analysis Techniques Pareto Analysis Ppt PowerPoint Presentation Professional Icons
This is a analysis techniques pareto analysis ppt powerpoint presentation professional icons. This is a two stage process. The stages in this process are bar chart, finance, marketing, business, analysis.

Clustered Column Finance Ppt PowerPoint Presentation Pictures Inspiration
This is a clustered column finance ppt powerpoint presentation pictures inspiration. This is a two stage process. The stages in this process are bar chart, finance, marketing, business, analysis.

Cycle Time By Month Ppt PowerPoint Presentation Visual Aids Ideas
This is a cycle time by month ppt powerpoint presentation visual aids ideas. This is a two stage process. The stages in this process are line chart, finance, marketing, management, investment.

Data Collection Histograms Ppt PowerPoint Presentation Icon Slides
This is a data collection histograms ppt powerpoint presentation icon slides. This is a two stage process. The stages in this process are bar chart, finance, marketing, business, analysis.

Crm Marketing Dashboard Ppt PowerPoint Presentation Templates
This is a crm marketing dashboard ppt powerpoint presentation templates. This is a two stage process. The stages in this process are leads this week query target, leads per week.

Gross Margin Improvement Ppt PowerPoint Presentation Guidelines
This is a gross margin improvement ppt powerpoint presentation guidelines. This is a two stage process. The stages in this process are business, bar graph, investment, marketing, strategy, success.

Current State Analysis Revenue Versus Target Ppt PowerPoint Presentation Model Smartart
This is a current state analysis revenue versus target ppt powerpoint presentation model smartart. This is a two stage process. The stages in this process are actual, target, actual vs target value.
Monthly Social Media Dashboard Ppt PowerPoint Presentation Icon Gallery
This is a monthly social media dashboard ppt powerpoint presentation icon gallery. This is a two stage process. The stages in this process are facebook, social traffic and conversion, referral traffic, conversions, key social metrics, pinterest, you tube.
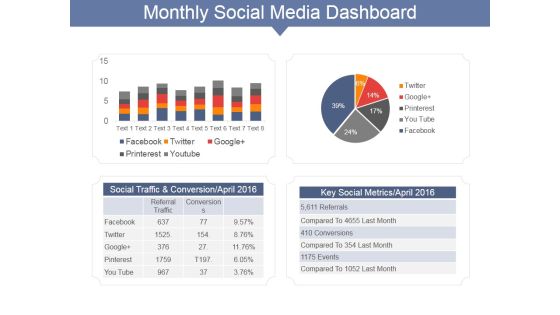
Monthly Social Media Dashboard Ppt PowerPoint Presentation Gallery Show
This is a monthly social media dashboard ppt powerpoint presentation gallery show. This is a two stage process. The stages in this process are social traffic and conversion april, key social metrics april, facebook, twitter.
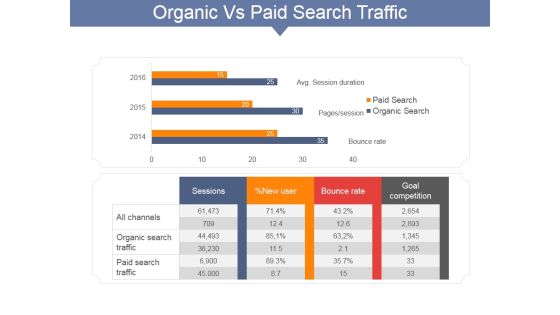
Organic Vs Paid Search Traffic Ppt PowerPoint Presentation Portfolio Master Slide
This is a organic vs paid search traffic ppt powerpoint presentation portfolio master slide. This is a two stage process. The stages in this process are sessions, all channels, organic search traffic, paid search traffic, bounce rate.
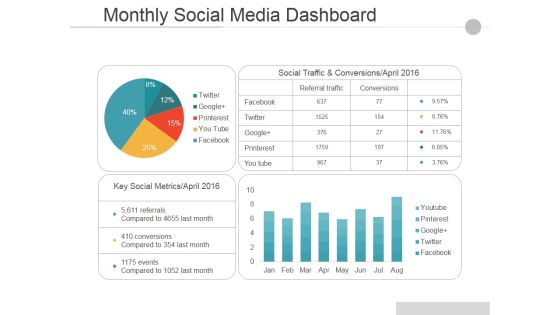
Monthly Social Media Dashboard Ppt PowerPoint Presentation Pictures Guide
This is a monthly social media dashboard ppt powerpoint presentation pictures guide. This is a two stage process. The stages in this process are social traffic and conversions april, key social metrics april, facebook, twitter, google.

Organic Visits And Backlinks Ppt PowerPoint Presentation Inspiration Example Introduction
This is a Organic Visits And Backlinks Ppt PowerPoint Presentation Inspiration Example Introduction. This is a two stage process. The stages in this process are Business, Marketing, Finance, Success, Growth.

Organic Vs Paid Search Traffic Ppt PowerPoint Presentation Layouts Picture
This is a Organic Vs Paid Search Traffic Ppt PowerPoint Presentation Layouts Picture. This is a two stage process. The stages in this process are All Channels, Organic Search Traffic, Paid Search Traffic, Sessions, Bounce Rate.

Addressable Market In Sector Ppt PowerPoint Presentation Inspiration Structure
This is a addressable market in sector ppt powerpoint presentation inspiration structure. This is a two stage process. The stages in this process are expected global annual investment in power, xxs addressable market on annual basis.

Competitor Positioning Ppt PowerPoint Presentation Show Example Introduction
This is a competitor positioning ppt powerpoint presentation show example introduction. This is a two stage process. The stages in this process are market growth, company growth, business, finance, percentage.
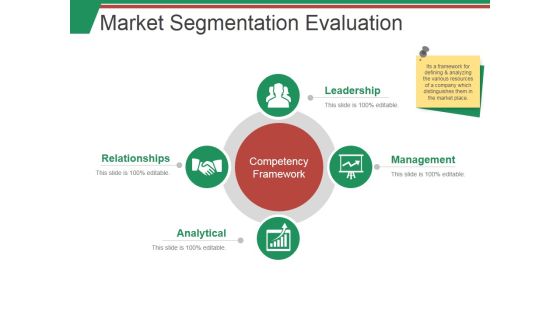
Market Segmentation Evaluation Template 1 Ppt PowerPoint Presentation Summary Smartart
This is a market segmentation evaluation template 1 ppt powerpoint presentation summary smartart. This is a two stage process. The stages in this process are market sales, net profit, beverages, milk product, nutrition.

Activity Ratios Template 3 Ppt PowerPoint Presentation Professional Example
This is a activity ratios template 3 ppt powerpoint presentation professional example. This is a two stage process. The stages in this process are total asset turnover, net sales, fixed assets turnover, fixed assets.

Activity Ratios Template Ppt PowerPoint Presentation Summary Slides
This is a activity ratios template ppt powerpoint presentation summary slides. This is a two stage process. The stages in this process are total asset turnover, net sales, fixed assets turnover, fixed assets.

Activity Ratios Ppt PowerPoint Presentation Icon Themes
This is a activity ratios ppt powerpoint presentation icon themes. This is a two stage process. The stages in this process are inventory turnover, cogs, average inventory, receivable turnover, net credit sales, average accounts receivable .
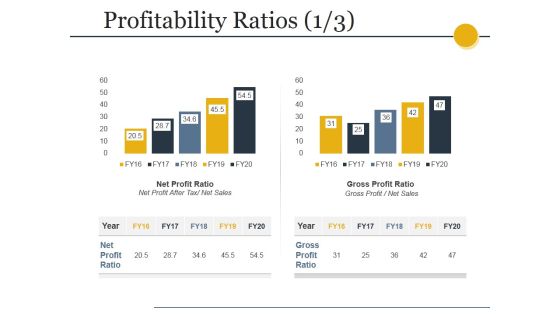
Profitability Ratios Template 1 Ppt PowerPoint Presentation Slides Inspiration
This is a profitability ratios template 1 ppt powerpoint presentation slides inspiration. This is a two stage process. The stages in this process are net profit ratio, net profit after tax net sales, gross profit ratio, gross profit net sales.

Profitability Ratios Template Ppt PowerPoint Presentation Styles Slide
This is a profitability ratios template ppt powerpoint presentation styles slide. This is a two stage process. The stages in this process are net profit ratio, net profit after tax net sales, gross profit ratio, gross profit net sales.
Solvency Ratios Template Ppt PowerPoint Presentation Inspiration Icons
This is a solvency ratios template ppt powerpoint presentation inspiration icons. This is a two stage process. The stages in this process are debt equity ratio, total liabilities total equity, time interest earned ratio, ebit interest expense.

External Analysis Industry Trends Ppt PowerPoint Presentation File Outfit
This is a external analysis industry trends ppt powerpoint presentation file outfit. This is a two stage process. The stages in this process are revenue, export, bar, finance, analysis.
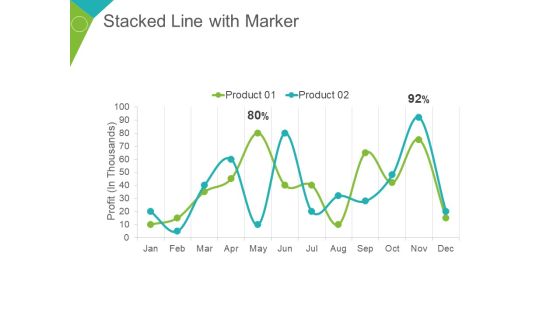
Stacked Line With Marker Ppt PowerPoint Presentation Summary Demonstration
This is a stacked line with marker ppt powerpoint presentation summary demonstration. This is a two stage process. The stages in this process are profit in thousands, product, percentage, finance, business.

Area Stacked Ppt PowerPoint Presentation Diagram Images
This is a area stacked ppt powerpoint presentation diagram images. This is a two stage process. The stages in this process are sales in percentage, product, business, marketing, finance.

Clustered Column Ppt PowerPoint Presentation Slides Ideas
This is a clustered column ppt powerpoint presentation slides ideas. This is a two stage process. The stages in this process are sales in percentage, business, marketing, finance, graph.
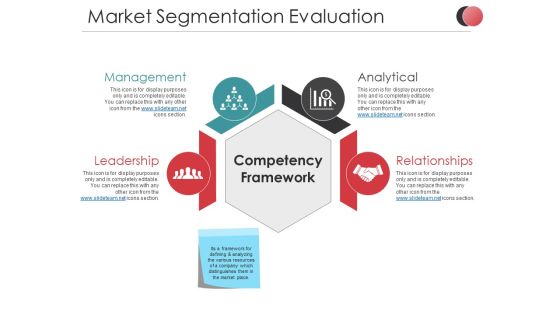
Market Segmentation Evaluation Ppt PowerPoint Presentation Summary Slideshow
This is a market segmentation evaluation ppt powerpoint presentation summary slideshow. This is a two stage process. The stages in this process are net profit, market sales, business, marketing, finance, icons.

Stacked Column Ppt PowerPoint Presentation Infographics Samples
This is a stacked column ppt powerpoint presentation infographics samples. This is a two stage process. The stages in this process are product, sales in percentage, business, marketing, graph.

Clustered Column Ppt PowerPoint Presentation Ideas Graphic Tips
This is a clustered column ppt powerpoint presentation ideas graphic tips. This is a two stage process. The stages in this process are financial year, sales in percentage, product, graph, business.
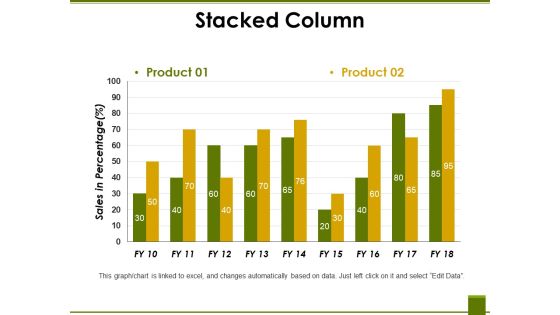
Stacked Column Ppt PowerPoint Presentation Professional Vector
This is a stacked column ppt powerpoint presentation professional vector. This is a two stage process. The stages in this process are product, sales in percentage, business, marketing, graph.

Clustered Column Ppt PowerPoint Presentation Portfolio Smartart
This is a clustered column ppt powerpoint presentation portfolio smartart. This is a two stage process. The stages in this process are financial year, product, sales in percentage, finance, business, graph.

Clustered Column Ppt PowerPoint Presentation Pictures Mockup
This is a clustered column ppt powerpoint presentation pictures mockup. This is a two stage process. The stages in this process are product, sales in percentage, financial year, graph, business.

Clustered Column Ppt PowerPoint Presentation Professional Graphic Tips
This is a clustered column ppt powerpoint presentation professional graphic tips. This is a two stage process. The stages in this process are product, profit in percentage, graph, business, marketing.

Clustered Column Ppt PowerPoint Presentation Inspiration Shapes
This is a clustered column ppt powerpoint presentation inspiration shapes. This is a two stage process. The stages in this process are profit in percentage, business, marketing, graph, finance.
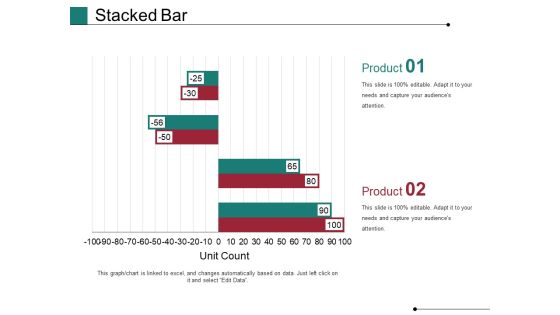
Stacked Bar Template 1 Ppt PowerPoint Presentation Show Slides
This is a stacked bar template 1 ppt powerpoint presentation show slides. This is a two stage process. The stages in this process are Unit Count, Business, Marketing, Graph, Finance.
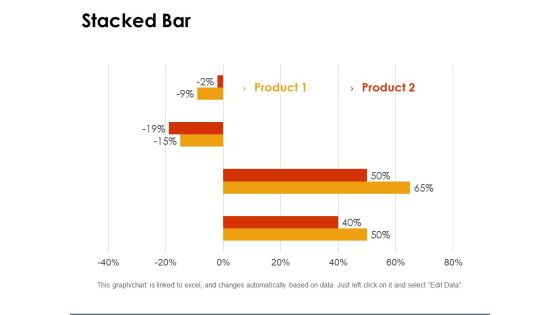
Stacked Bar Template 1 Ppt PowerPoint Presentation Gallery Clipart
This is a stacked bar template 1 ppt powerpoint presentation gallery clipart. This is a two stage process. The stages in this process are percentage, graph, business, marketing, finance.
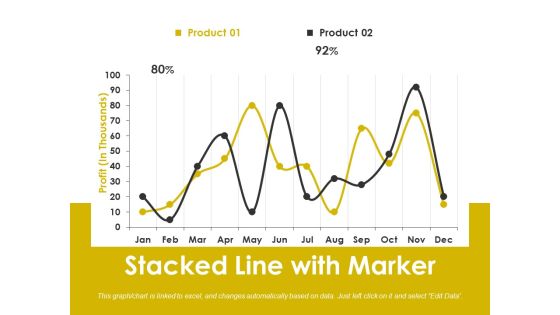
Stacked Line With Marker Ppt PowerPoint Presentation Slides File Formats
This is a stacked line with marker ppt powerpoint presentation slides file formats. This is a two stage process. The stages in this process are business, marketing, strategy, graph, finance, percentage.
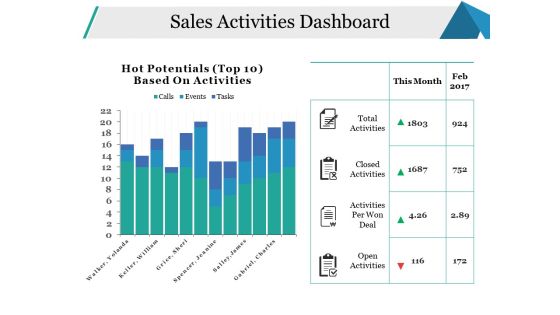
Sales Activities Dashboard Ppt PowerPoint Presentation Pictures Model
This is a sales activities dashboard ppt powerpoint presentation pictures model. This is a two stage process. The stages in this process are open activities, activities per won deal, closed activities, total activities, business.
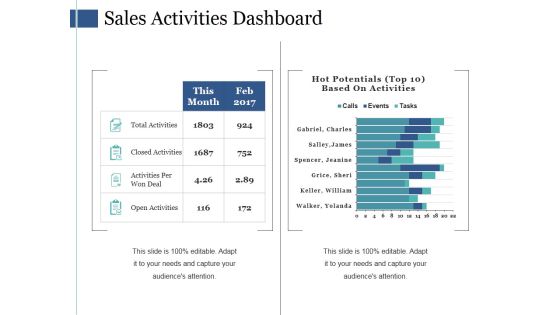
Sales Activities Dashboard Ppt PowerPoint Presentation Ideas Themes
This is a sales activities dashboard ppt powerpoint presentation ideas themes. This is a two stage process. The stages in this process are total activities, closed activities, activities per won deal, open activities.
Sales Activities Dashboard Ppt PowerPoint Presentation Icon Graphics
This is a sales activities dashboard ppt powerpoint presentation icon graphics. This is a two stage process. The stages in this process are business, finance, management, analysis, budget, actual.
Sales Kpi Tracker Ppt PowerPoint Presentation Pictures Designs
This is a sales kpi tracker ppt powerpoint presentation pictures designs. This is a two stage process. The stages in this process are leads created, sales ratio, opportunities won, top products in revenue, win ratio vs last yr.

Clustered Column Ppt PowerPoint Presentation Show Graphics
This is a clustered column ppt powerpoint presentation show graphics. This is a two stage process. The stages in this process are financial year, sales in percentage, business, marketing, graph.

Inventory Ratios Template 1 Ppt PowerPoint Presentation Gallery Master Slide
This is a inventory ratios template 1 ppt powerpoint presentation gallery master slide. This is a two stage process. The stages in this process are finance, marketing, analysis, business, investment, inventory ratios.

Operating Efficiency Ratios Template 1 Ppt PowerPoint Presentation Layouts Introduction
This is a operating efficiency ratios template 1 ppt powerpoint presentation layouts introduction. This is a two stage process. The stages in this process are operating efficiency ratios, finance, marketing, strategy, business.
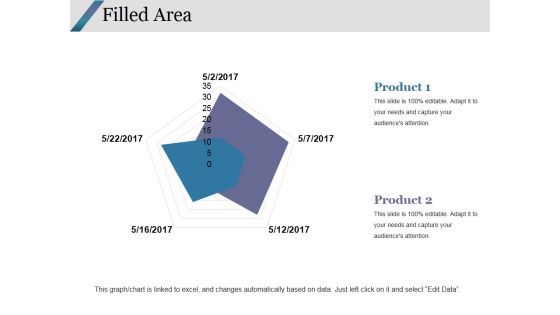
Filled Area Ppt PowerPoint Presentation Infographics Graphics Design
This is a filled area ppt powerpoint presentation infographics graphics design. This is a two stage process. The stages in this process are filled area, finance, marketing, strategy, analysis.

Activity Ratios Template 1 Ppt PowerPoint Presentation Show Graphics
This is a activity ratios template 1 ppt powerpoint presentation show graphics. This is a two stage process. The stages in this process are inventory turnover, receivables turnover, inventory ratio, receivable ratio.
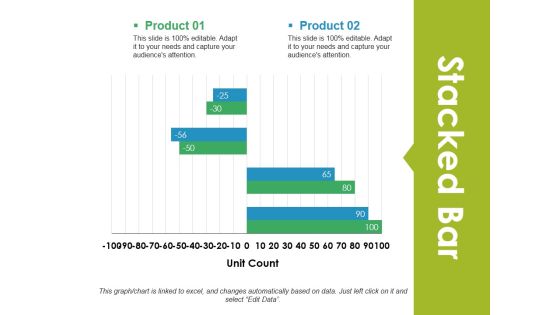
Stacked Bar Ppt PowerPoint Presentation Visual Aids Gallery
This is a stacked bar ppt powerpoint presentation visual aids gallery. This is a two stage process. The stages in this process are stacked bar, analysis, finance, marketing, strategy.

clustered bar ppt powerpoint presentation model display
This is a clustered bar ppt powerpoint presentation model display. This is a two stage process. The stages in this process are clustered bar, finance, marketing, strategy, analysis, business.

Clustered Column Ppt PowerPoint Presentation Slides Microsoft
This is a clustered column ppt powerpoint presentation slides microsoft. This is a two stage process. The stages in this process are clustered column, finance, marketing, strategy, analysis, business.

Stacked Bar Ppt PowerPoint Presentation Professional Clipart Images
This is a stacked bar ppt powerpoint presentation professional clipart images. This is a two stage process. The stages in this process are stacked bar, finance, marketing, strategy, business.

Clustered Column Ppt PowerPoint Presentation Infographic Template Slide Portrait
This is a clustered column ppt powerpoint presentation infographic template slide portrait. This is a two stage process. The stages in this process are clustered column, finance, marketing, strategy, analysis, business.
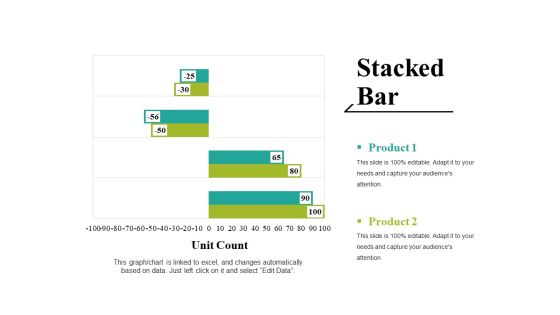
Stacked Bar Ppt PowerPoint Presentation Ideas Graphics Tutorials
This is a stacked bar ppt powerpoint presentation ideas graphics tutorials. This is a two stage process. The stages in this process are unit count, graph, business, marketing, strategy.
 Home
Home