Two Lists

Line Chart Ppt PowerPoint Presentation Professional Graphics Design
This is a line chart ppt powerpoint presentation professional graphics design. This is a two stage process. The stages in this process are financial years, sales in percentage, product, growth, success.
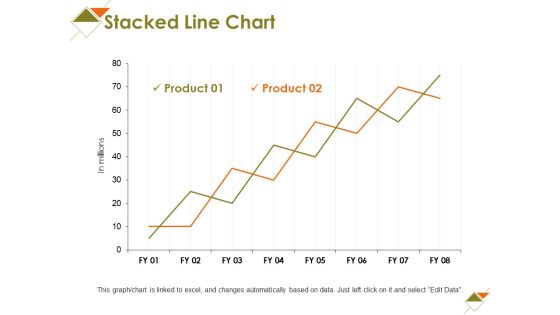
Stacked Line Chart Ppt PowerPoint Presentation File Display
This is a stacked line chart ppt powerpoint presentation file display. This is a two stage process. The stages in this process are business, marketing, graph, strategy, in millions.

Column Chart Ppt PowerPoint Presentation Infographics Layout Ideas
This is a column chart ppt powerpoint presentation infographics layout ideas. This is a two stage process. The stages in this process are financial year in, business, marketing, growth, graph.
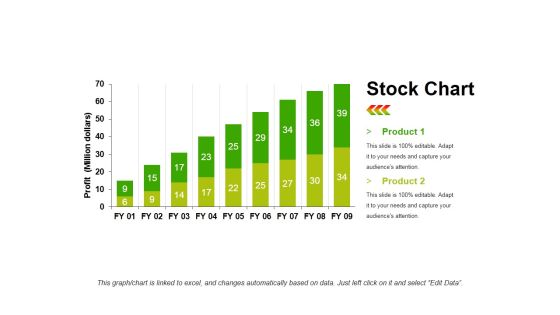
Stock Chart Template 1 Ppt PowerPoint Presentation Infographic Template Objects
This is a stock chart template 1 ppt powerpoint presentation infographic template objects. This is a two stage process. The stages in this process are product, profit, bar graph, growth, success.

Column Chart Ppt PowerPoint Presentation Model Clipart Images
This is a column chart ppt powerpoint presentation model clipart images. This is a two stage process. The stages in this process are product, bar graph, growth, success, business.

Line Chart Ppt PowerPoint Presentation File Example File
This is a line chart ppt powerpoint presentation file example file. This is a two stage process. The stages in this process are product, in percentage, in years, growth, success.
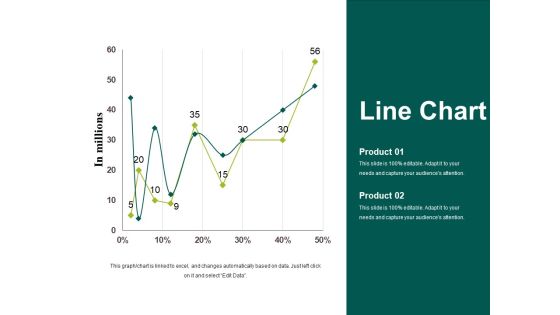
Line Chart Template 1 Ppt PowerPoint Presentation Styles Graphics Tutorials
This is a line chart template 1 ppt powerpoint presentation styles graphics tutorials. This is a two stage process. The stages in this process are in millions, business, marketing, strategy, graph.

Column Chart Ppt PowerPoint Presentation Layouts Background Images
This is a column chart ppt powerpoint presentation layouts background images. This is a two stage process. The stages in this process are product, in months, graph, growth, success.
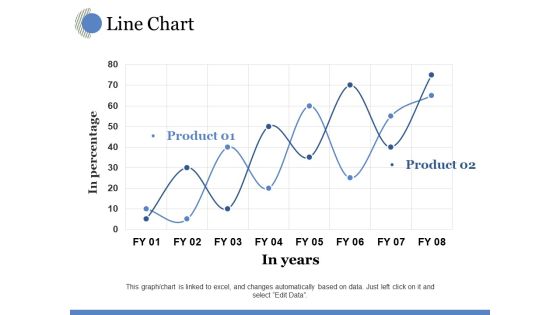
Line Chart Ppt PowerPoint Presentation Model Visual Aids
This is a line chart ppt powerpoint presentation model visual aids. This is a two stage process. The stages in this process are in years, in percentage, growth, business, marketing.

Line Chart Ppt PowerPoint Presentation Gallery Example Topics
This is a line chart ppt powerpoint presentation gallery example topics. This is a two stage process. The stages in this process are in millions, business, marketing, strategy, graph.

Column Chart Ppt PowerPoint Presentation Portfolio Slide Download
This is a column chart ppt powerpoint presentation portfolio slide download. This is a two stage process. The stages in this process are product, year, bar graph, success, business.
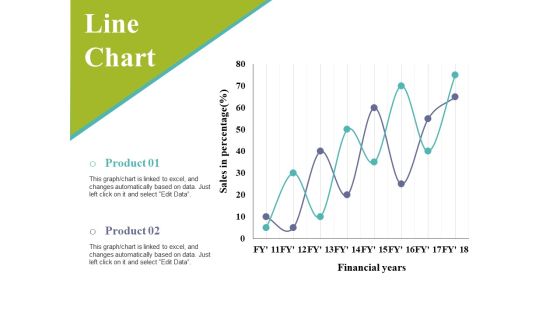
Line Chart Ppt PowerPoint Presentation Infographic Template Slides
This is a line chart ppt powerpoint presentation infographic template slides. This is a two stage process. The stages in this process are sales in percentage, financial years, business, marketing, graph.
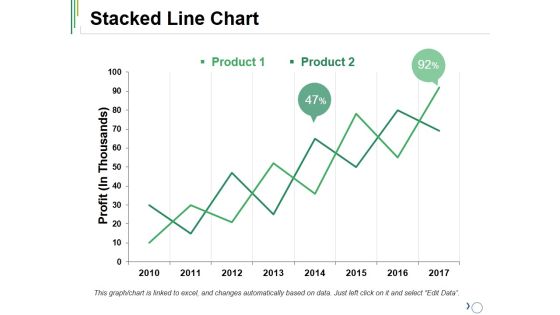
Stacked Line Chart Ppt PowerPoint Presentation Ideas Outfit
This is a stacked line chart ppt powerpoint presentation ideas outfit. This is a two stage process. The stages in this process are product, stacked line, profit, growth, success.

Column Chart Ppt PowerPoint Presentation Layouts Graphics Example
This is a column chart ppt powerpoint presentation layouts graphics example. This is a two stage process. The stages in this process are product, year, bar graph, business, finance.

Column Chart Ppt PowerPoint Presentation Styles Graphics Design
This is a column chart ppt powerpoint presentation styles graphics design. This is a two stage process. The stages in this process are expenditure in, product, years, growth, success.

Column Chart Ppt PowerPoint Presentation Pictures Graphic Images
This is a column chart ppt powerpoint presentation pictures graphic images. This is a two stage process. The stages in this process are product, years, growth, success, bar graph.

Bar Chart Ppt PowerPoint Presentation Show Format Ideas
This is a bar chart ppt powerpoint presentation show format ideas. This is a two stage process. The stages in this process are bar graph, growth, success, business, marketing.

Line Chart Ppt PowerPoint Presentation Infographic Template Master Slide
This is a line chart ppt powerpoint presentation infographic template master slide. This is a two stage process. The stages in this process are product, financial years, sales in percentage.

Combo Chart Finance Ppt PowerPoint Presentation Infographic Template Graphics
This is a combo chart finance ppt powerpoint presentation infographic template graphics. This is a two stage process. The stages in this process are growth, finance, marketing, management, investment.

Bar Chart Percentage Product Ppt PowerPoint Presentation Layouts Designs Download
This is a bar chart percentage product ppt powerpoint presentation layouts designs download. This is a two stage process. The stages in this process are percentage, product, business, management.
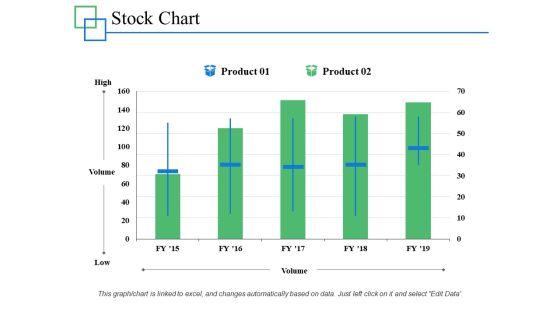
Stock Chart Management Investment Ppt PowerPoint Presentation Infographics Professional
This is a stock chart management investment ppt powerpoint presentation infographics professional. This is a two stage process. The stages in this process are marketing, business, management, percentage, product.

Column Chart Finance Marketing Ppt PowerPoint Presentation Model Example Introduction
This is a column chart finance marketing ppt powerpoint presentation model example introduction. This is a two stage process. The stages in this process are business, management, marketing, percentage, product.

Cost Benefit Analysis Chart With Icons Powerpoint Layout
This is a cost benefit analysis chart with icons powerpoint layout. This is a two stage process. The stages in this process are balance scale, compare, business, marketing, management.
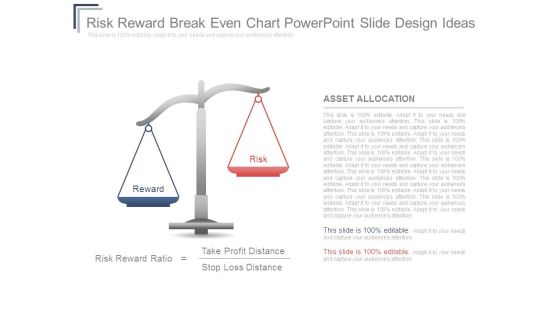
Risk Reward Breakeven Chart Powerpoint Slide Design Ideas
This is a risk reward breakeven chart powerpoint slide design ideas. This is a two stage process. The stages in this process are reward, risk, asset allocation, risk reward ratio, take profit distance, stop loss distance.

Customer Services Management Chart Ppt PowerPoint Presentation Show Slides
This is a customer services management chart ppt powerpoint presentation show slides. This is a two stage process. The stages in this process are finance manager, graphic designer, ceo director, product manager.

Scatter Bubble Chart Ppt PowerPoint Presentation Diagram Ppt
This is a scatter bubble chart ppt powerpoint presentation diagram ppt. This is a two stage process. The stages in this process are product, in price, highest sale, percentage, business, marketing.
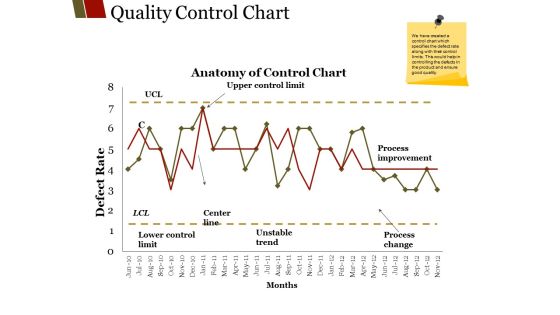
Quality Control Chart Ppt PowerPoint Presentation File Graphics Design
This is a quality control chart ppt powerpoint presentation file graphics design. This is a two stage process. The stages in this process are unstable trend, months center line, lower control limit, process improvement.
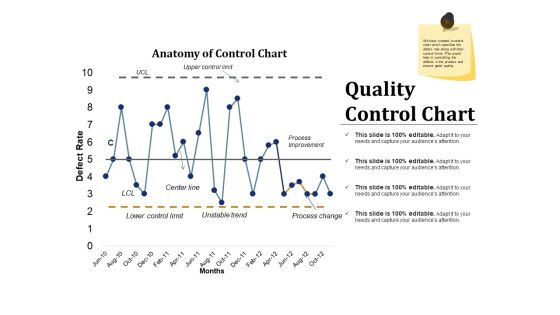
Quality Control Chart Ppt PowerPoint Presentation Inspiration Example Introduction
This is a quality control chart ppt powerpoint presentation inspiration example introduction. This is a two stage process. The stages in this process are process improvement, process change, unstable trend, lower control limit, center line.
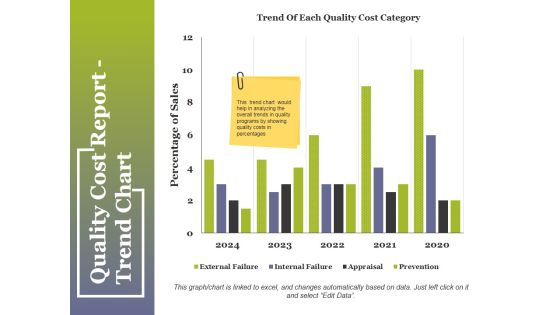
Quality Cost Report Trend Chart Ppt PowerPoint Presentation Summary Pictures
This is a quality cost report trend chart ppt powerpoint presentation summary pictures. This is a two stage process. The stages in this process are compare, business, table, marketing, strategy.
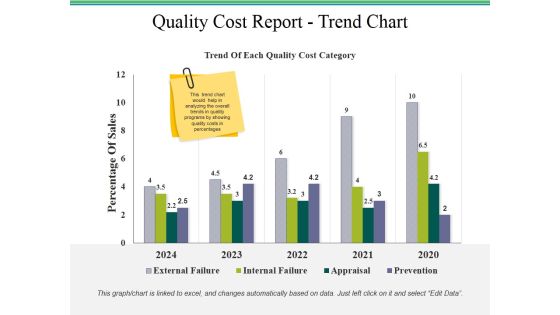
Quality Cost Report Trend Chart Ppt PowerPoint Presentation Styles Templates
This is a quality cost report trend chart ppt powerpoint presentation styles templates. This is a two stage process. The stages in this process are quality cost report, business, finance, marketing, strategy.

Scatter Bubble Chart Ppt PowerPoint Presentation Inspiration Graphics Tutorials
This is a scatter bubble chart ppt powerpoint presentation inspiration graphics tutorials. This is a two stage process. The stages in this process are finance, marketing, management, investment, analysis.

Cost Benefit Analysis Chart Ppt PowerPoint Presentation Slides Example File
This is a cost benefit analysis chart ppt powerpoint presentation slides example file. This is a two stage process. The stages in this process are increase salary, cost benefit, reduced costs, analysis, operating cost.

Area Chart Ppt PowerPoint Presentation Infographic Template Clipart Images
This is a area chart ppt powerpoint presentation infographic template clipart images. This is a two stage process. The stages in this process are finance, marketing, management, investment, analysis.
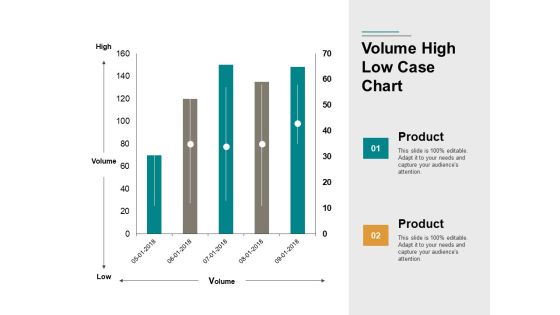
Volume High Low Case Chart Ppt PowerPoint Presentation Portfolio Images
This is a volume high low case chart ppt powerpoint presentation portfolio images. This is a two stage process. The stages in this process are finance, business, marketing, management.

Cost Benefit Analysis Chart Ppt PowerPoint Presentation Ideas Shapes
This is a cost benefit analysis chart ppt powerpoint presentation ideas shapes. This is a two stage process. The stages in this process are reduced costs, operating cost, benefits, costs, increase salary.

Bubble Chart Employee Value Proposition Ppt PowerPoint Presentation Icon Sample
This is a bubble chart employee value proposition ppt powerpoint presentation icon sample. This is a two stage process. The stages in this process are business, management, strategy, analysis, marketing.

Column Chart Sample Budget Ppt Ppt PowerPoint Presentation Infographics Brochure
This is a column chart sample budget ppt ppt powerpoint presentation infographics brochure. This is a two stage process. The stages in this process are business, management, strategy, analysis, marketing.
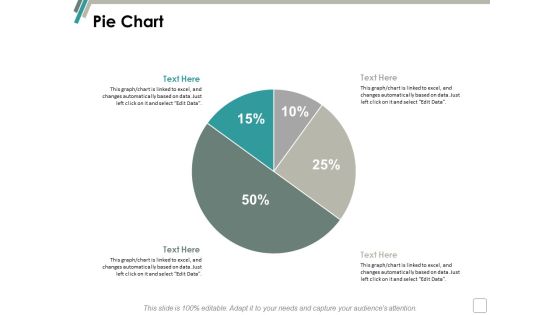
Pie Chart Finance Marketing Ppt Powerpoint Presentation Infographics Background
This is a pie chart finance marketing ppt powerpoint presentation infographics background. This is a two stage process. The stages in this process are finance, marketing, management, investment, analysis.

Scatter Chart Analysis Marketing Ppt Powerpoint Presentation Summary Infographic Template
This is a scatter chart analysis marketing ppt powerpoint presentation summary infographic template. This is a two stage process. The stages in this process are finance, marketing, management, investment, analysis.

area chart finance ppt powerpoint presentation portfolio graphics download
This is a area chart finance ppt powerpoint presentation portfolio graphics download. This is a two stage process. The stages in this process are finance, marketing, management, investment, analysis.
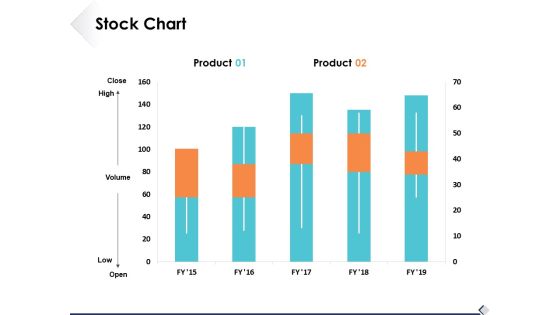
Stock Chart Finance Ppt PowerPoint Presentation Styles Background Image
This is a stock chart finance ppt powerpoint presentation styles background image. This is a two stage process. The stages in this process are analysis, marketing, icons, finance, strategy.

Bubble Chart Marketing Business Ppt PowerPoint Presentation Model Sample
This is a bubble chart marketing business ppt powerpoint presentation model sample. This is a two stage process. The stages in this process are finance, business, management, strategy, analysis.

Scatter Bubble Chart Finance Ppt Powerpoint Presentation Layouts Summary
This is a scatter bubble chart finance ppt powerpoint presentation layouts summary. This is a two stage process. The stages in this process are financial, minimum, maximum, marketing, strategy.

Area Chart Finance Ppt PowerPoint Presentation Infographic Template Graphics Template
This is a area chart finance ppt powerpoint presentation infographic template graphics template. This is a two stage process. The stages in this process are finance, marketing, management, investment, analysis.

Scatter Bubble Chart Graph Ppt PowerPoint Presentation Infographic Template Maker
This is a scatter bubble chart graph ppt powerpoint presentation infographic template maker. This is a two stage process. The stages in this process are finance, marketing, management, investment, analysis.

Area Chart Ppt PowerPoint Presentation Show Slide Portrait
This is a area chart ppt powerpoint presentation show slide portrait. This is a two stage process. The stages in this process are business, strategy, marketing, analysis, area chart.

X Bar And R Chart Ppt PowerPoint Presentation Background Designs
This is a x bar and r chart ppt powerpoint presentation background designs. This is a two stage process. The stages in this process are chart, business, marketing, strategy, success.

Lead Nurturing Lifecycle Ppt PowerPoint Presentation Infographics Designs
This is a lead nurturing lifecycle ppt powerpoint presentation infographics designs. This is a two stage process. The stages in this process are social media, media, articles, outreach programs, product updates.

Stacked Line Chart Ppt PowerPoint Presentation Ideas Example File
This is a stacked line chart ppt powerpoint presentation ideas example file. This is a two stage process. The stages in this process are stacked line chart, growth, analysis, business, success.
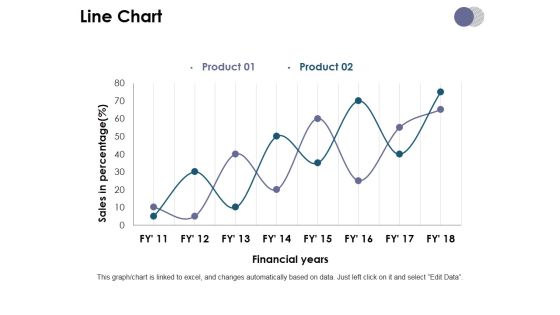
Line Chart Ppt PowerPoint Presentation Model Slide Download
This is a line chart ppt powerpoint presentation model slide download. This is a two stage process. The stages in this process are line chart, growth, finance, analysis, business.
Line Chart Ppt PowerPoint Presentation Infographic Template Slideshow
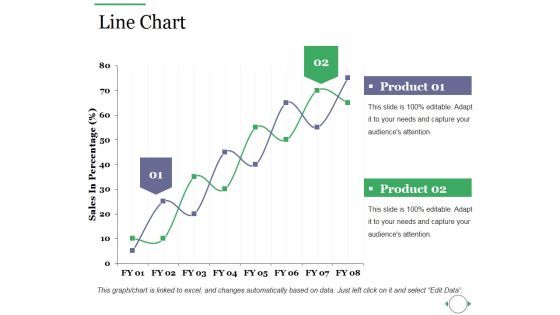
This is a line chart ppt powerpoint presentation infographic template slideshow. This is a two stage process. The stages in this process are line chart, growth, strategy, business, marketing.
Line Chart Ppt PowerPoint Presentation Pictures Graphic Images
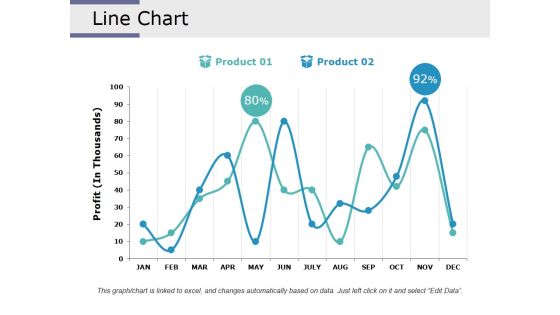
This is a line chart ppt powerpoint presentation pictures graphic images. This is a two stage process. The stages in this process are line chart, growth, strategy, marketing, business.

Stacked Line Chart Ppt PowerPoint Presentation Summary Graphics Pictures
This is a stacked line chart ppt powerpoint presentation summary graphics pictures. This is a two stage process. The stages in this process are stacked line chart, growth, analysis, finance, business.

Line Chart Ppt PowerPoint Presentation Infographics File Formats
This is a line chart ppt powerpoint presentation infographics file formats. This is a two stage process. The stages in this process are line chart, growth, strategy, analysis, business.

Area Chart Ppt PowerPoint Presentation Infographic Template Model
This is a area chart ppt powerpoint presentation infographic template model. This is a two stage process. The stages in this process are product, area chart, growth, percentage, success.
Line Chart Ppt PowerPoint Presentation Icon Example Topics
This is a line chart ppt powerpoint presentation icon example topics. This is a two stage process. The stages in this process are line chart, finance, growth, strategy, business.

Line Chart Ppt PowerPoint Presentation Inspiration Graphics Tutorials
This is a line chart ppt powerpoint presentation inspiration graphics tutorials. This is a two stage process. The stages in this process are line chart, growth, strategy, analysis, business.

Profitability Ratios Template 2 Ppt PowerPoint Presentation Summary Graphics
This is a profitability ratios template 2 ppt powerpoint presentation summary graphics. This is a two stage process. The stages in this process are business, marketing, bar, finance, planning.
Principles For Judging The Alternative Ppt PowerPoint Presentation Slide
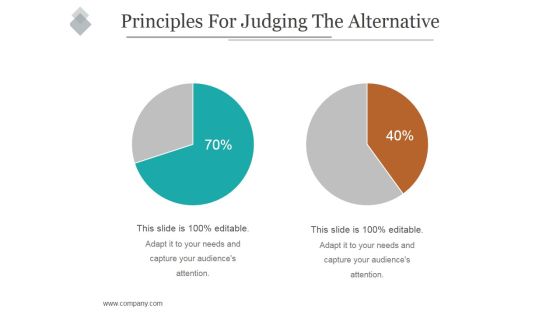
This is a principles for judging the alternative ppt powerpoint presentation slide. This is a two stage process. The stages in this process are business, pie, division, percentage, finance.

Bar Chart Ppt PowerPoint Presentation Model Clipart Images
This is a bar chart ppt powerpoint presentation model clipart images. This is a two stage process. The stages in this process are bar chart, finance, marketing, strategy, analysis.
 Home
Home