Two Lists

Competitor Analysis Template 4 Ppt PowerPoint Presentation Graphics
This is a competitor analysis template 4 ppt powerpoint presentation graphics. This is a four stage process. The stages in this process are competitor, finance, marketing, strategy, analysis, business.

Customer Service Benchmarking Template 1 Ppt PowerPoint Presentation Infographic Template Shapes
This is a customer service benchmarking template 1 ppt powerpoint presentation infographic template shapes. This is a three stage process. The stages in this process are business, finance, marketing, strategy, analysis.
Balance Sheet Kpis Tabular Form Ppt PowerPoint Presentation Show Icons
This is a balance sheet kpis tabular form ppt powerpoint presentation show icons. This is a four stage process. The stages in this process are current assets, total assets, total liabilities, current liabilities.

Cash Flow Statement Kpis Tabular Form Ppt PowerPoint Presentation Summary Elements
This is a cash flow statement kpis tabular form ppt powerpoint presentation summary elements. This is a four stage process. The stages in this process are net increase cash, financial activities, operations, investing activities.

Pandl Kpis Tabular Form Ppt PowerPoint Presentation Pictures Visual Aids
This is a pandl kpis tabular form ppt powerpoint presentation pictures visual aids. This is a four stage process. The stages in this process are revenue, operating profit, cogs, net profit.

Clustered Column Line Ppt PowerPoint Presentation Infographics Background Images
This is a clustered column line ppt powerpoint presentation infographics background images. This is a three stage process. The stages in this process are clustered column line, finance, analysis, marketing, business.
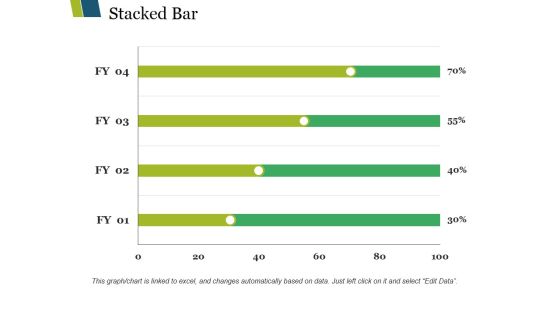
Stacked Bar Ppt PowerPoint Presentation Layouts Show
This is a stacked bar ppt powerpoint presentation layouts show. This is a four stage process. The stages in this process are stacked bar, finance, analysis, marketing, strategy, business.

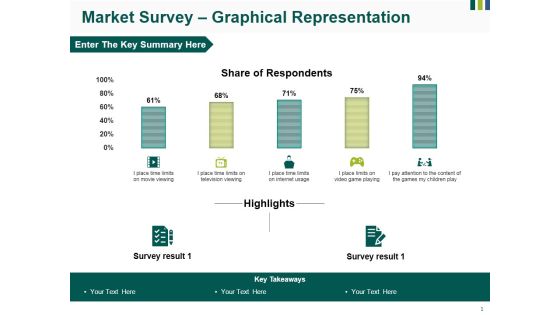
Market Survey Graphical Representation Ppt PowerPoint Presentation Ideas Show
This is a market survey graphical representation ppt powerpoint presentation ideas show. This is a five stage process. The stages in this process are place time limits on movie viewing, place time limits on television viewing, place time limits on internet usage, place limits on video game playing, pay attention to the content of the games my children play.
Market Survey Graphical Representation Ppt PowerPoint Presentation Gallery Pictures
This is a market survey graphical representation ppt powerpoint presentation gallery pictures. This is a five stage process. The stages in this process are business, marketing, finance, shares of market, growth strategy.
Stacked Line Ppt PowerPoint Presentation Icon Professional
This is a stacked line ppt powerpoint presentation icon professional. This is a three stage process. The stages in this process are Business, Financial, Marketing, Graph, Strategy Revenue In Percentage.

Summary Financials Revenue Ebitda Pat Ppt PowerPoint Presentation Infographics Ideas
This is a summary financials revenue ebitda pat ppt powerpoint presentation infographics ideas. This is a three stage process. The stages in this process are business, finance, analysis, marketing, strategy.

Stacked Area Clustered Column Ppt PowerPoint Presentation Slides Information
This is a stacked area clustered column ppt powerpoint presentation slides information. This is a three stage process. The stages in this process are stacked area, clustered column, growth, finance, marketing, business.

Competitors Average Price Product Ppt PowerPoint Presentation Summary Tips
This is a competitors average price product ppt powerpoint presentation summary tips. This is a five stage process. The stages in this process are .

Competitor Analysis Ppt PowerPoint Presentation File Mockup
This is a competitor analysis ppt powerpoint presentation file mockup. This is a four stage process. The stages in this process are sales development of industry, revenue, performance indicators, sales development.

Competitor Analysis Ppt PowerPoint Presentation Layouts Slideshow
This is a competitor analysis ppt powerpoint presentation layouts slideshow. This is a four stage process. The stages in this process are sales development of industry, performance indicators, sales development, revenue, sales.

Competitor Market Share And Sales Revenues Ppt PowerPoint Presentation Professional Design Inspiration
This is a competitor market share and sales revenues ppt powerpoint presentation professional design inspiration. This is a four stage process. The stages in this process are your figures, development, business, marketing, graph.

Competitor Revenue And Profit Ppt PowerPoint Presentation Professional Graphics Pictures
This is a competitor revenue and profit ppt powerpoint presentation professional graphics pictures. This is a five stage process. The stages in this process are business, marketing, strategy, graph, finance.

Competitors Average Price Product Ppt PowerPoint Presentation Summary Deck
This is a competitors average price product ppt powerpoint presentation summary deck. This is a five stage process. The stages in this process are business, marketing, strategy, graph, finance.
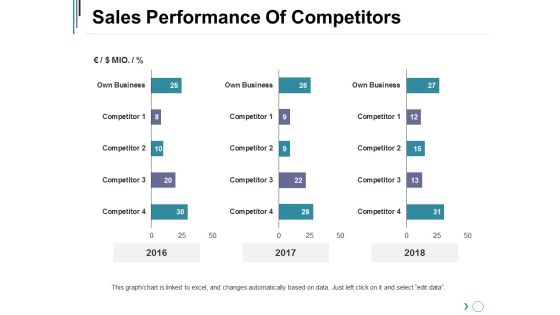
Sales Performance Of Competitors Ppt PowerPoint Presentation Inspiration Slideshow
This is a sales performance of competitors ppt powerpoint presentation inspiration slideshow. This is a three stage process. The stages in this process are business, marketing, graph, finance, years.
Financial Ppt PowerPoint Presentation Model Icons
This is a financial ppt powerpoint presentation model icons. This is a three stage process. The stages in this process are dollar, business, finance, marketing, management.

Competitor Analysis Ppt PowerPoint Presentation Visual Aids Model
This is a competitor analysis ppt powerpoint presentation visual aids model. This is a four stage process. The stages in this process are sales development of industry, performance indicators, sales development, revenue sales, business.

Competitor Market Share And Sales Revenues Ppt PowerPoint Presentation Portfolio Pictures
This is a competitor market share and sales revenues ppt powerpoint presentation portfolio pictures. This is a four stage process. The stages in this process are business, your figures, development, marketing, graph.

Competitor Revenue And Profit Ppt PowerPoint Presentation Slides Objects
This is a competitor revenue and profit ppt powerpoint presentation slides objects. This is a five stage process. The stages in this process are business, marketing, graph, finance, revenue.

Competitors Average Price Product Ppt PowerPoint Presentation Summary Display
This is a competitors average price product ppt powerpoint presentation summary display. This is a five stage process. The stages in this process are business, marketing, graph, finance.

Sales Performance Of Competitors Ppt PowerPoint Presentation Portfolio Templates
This is a sales performance of competitors ppt powerpoint presentation portfolio templates. This is a three stage process. The stages in this process are business, marketing, percentage, graph, finance.

Sales Performance Of Competitors Ppt PowerPoint Presentation Layouts Elements
This is a sales performance of competitors ppt powerpoint presentation layouts elements. This is a three stage process. The stages in this process are years, bar graph, finance, business, marketing.

Clustered Bar Ppt PowerPoint Presentation Icon Background
This is a clustered bar ppt powerpoint presentation icon background. This is a three stage process. The stages in this process are business, unit count, marketing, graph, finance.
Shareholding Pattern Ppt PowerPoint Presentation Icon Clipart Images
This is a shareholding pattern ppt powerpoint presentation icon clipart images. This is a five stage process. The stages in this process are business, before funding, shareholder, after funding, shareholding pattern.

Traction Ppt PowerPoint Presentation Infographic Template Background Designs
This is a traction ppt powerpoint presentation infographic template background designs. This is a six stage process. The stages in this process are business, icons, traction, marketing, finance.

Clustered Column Line Ppt PowerPoint Presentation Pictures Objects
This is a clustered column line ppt powerpoint presentation pictures objects. This is a three stage process. The stages in this process are in percentage, business, marketing, graph, finance.
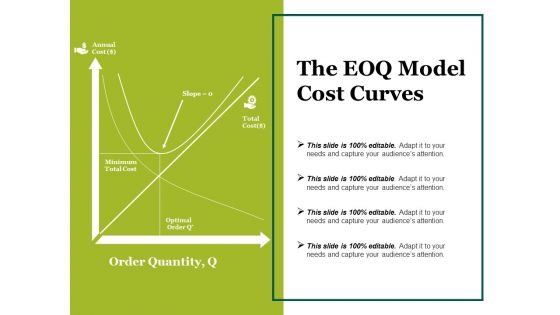
The Eoq Model Cost Curves Ppt PowerPoint Presentation Pictures Template
This is a the eoq model cost curves ppt powerpoint presentation pictures template. This is a four stage process. The stages in this process are minimum, total cost, slope, total cost, optimal order.

Clustered Column Line Ppt PowerPoint Presentation Summary Slide
This is a clustered column line ppt powerpoint presentation summary slide. This is a three stage process. The stages in this process are clustered column, finance, analysis, strategy, business.

Clustered Column Line Ppt PowerPoint Presentation Pictures Model
This is a clustered column line ppt powerpoint presentation pictures model. This is a three stage process. The stages in this process are bar graph, finance, marketing, strategy, business.

Balance Sheet Kpis Ppt PowerPoint Presentation Layouts Design Ideas
This is a balance sheet kpis ppt powerpoint presentation layouts design ideas. This is a four stage process. The stages in this process are current assets, current liabilities, total assets, total liabilities.

Cash Flow Statement Kpis Template Ppt PowerPoint Presentation Ideas Visual Aids
This is a cash flow statement kpis template ppt powerpoint presentation ideas visual aids. This is a four stage process. The stages in this process are operations, financing activities, investing activities, net increase in cash.
Pandl Kpis Template Ppt PowerPoint Presentation Model Icon
This is a pandl kpis template ppt powerpoint presentation model icon. This is a four stage process. The stages in this process are revenue, cogs, operating profit, net profit.

Clustered Bar Ppt PowerPoint Presentation Portfolio Graphic Images
This is a clustered bar ppt powerpoint presentation portfolio graphic images. This is a three stage process. The stages in this process are business, unit count, finance, marketing, graph.

Stacked Area Clustered Column Ppt PowerPoint Presentation Gallery Images
This is a stacked area clustered column ppt powerpoint presentation gallery images. This is a three stage process. The stages in this process are business, in percentage, marketing, strategy, graph.

Analysis Techniques Pareto Analysis Ppt PowerPoint Presentation Layouts Ideas
This is a analysis techniques pareto analysis ppt powerpoint presentation layouts ideas. This is a ten stage process. The stages in this process are business, marketing, strategy, finance, analysis.

Data Collection Scatter Diagram Ppt PowerPoint Presentation Summary Deck
This is a data collection scatter diagram ppt powerpoint presentation summary deck. This is a three stage process. The stages in this process are business, marketing, strategy, finance, analysis.

Analysis Techniques Pareto Analysis Ppt PowerPoint Presentation Summary Design Templates
This is a analysis techniques pareto analysis ppt powerpoint presentation summary design templates. This is a ten stage process. The stages in this process are analysis, business, marketing, finance, strategy.

Data Collection Histograms Ppt PowerPoint Presentation Show Topics
This is a data collection histograms ppt powerpoint presentation show topics. This is a seven stage process. The stages in this process are business, marketing, histogram, finance, graph.

Data Collection Scatter Diagram Ppt PowerPoint Presentation Professional Smartart
This is a data collection scatter diagram ppt powerpoint presentation professional smartart. This is a three stage process. The stages in this process are business, marketing, finance, graph, strategy.

Balance Sheet Kpis Template 3 Ppt PowerPoint Presentation Infographic Template Demonstration
This is a balance sheet kpis template 3 ppt powerpoint presentation infographic template demonstration. This is a four stage process. The stages in this process are balance sheet, finance, marketing, strategy, analysis.

Income Statement Overview Ppt PowerPoint Presentation Model Example
This is a income statement overview ppt powerpoint presentation model example. This is a five stage process. The stages in this process are business, finance, marketing, strategy, analysis.
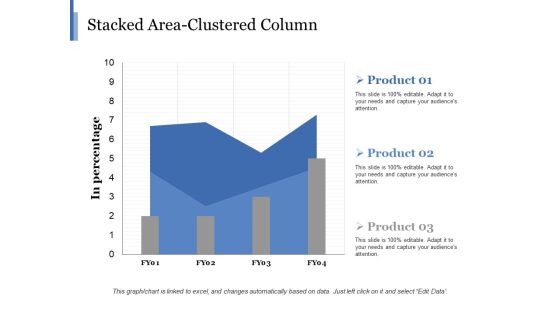
Stacked Area Clustered Column Ppt PowerPoint Presentation Show Elements
This is a stacked area clustered column ppt powerpoint presentation show elements. This is a three stage process. The stages in this process are business, in percentage, marketing, finance, graph.
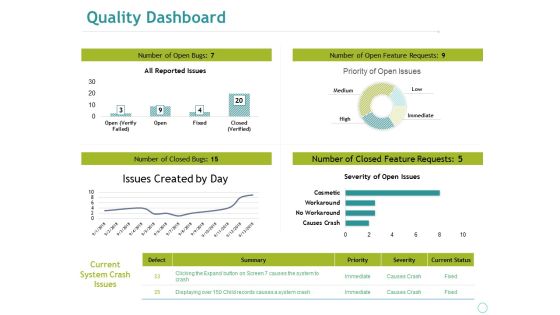
Quality Dashboard Ppt PowerPoint Presentation File Guide
This is a quality dashboard ppt powerpoint presentation file guide. This is a four stage process. The stages in this process are business, marketing, all reported issues, issues created by day, severity of open issues.

Stacked Line Ppt PowerPoint Presentation File Guidelines
This is a stacked line ppt powerpoint presentation file guidelines. This is a three stage process. The stages in this process are in percentage, business, marketing, finance, strategy.
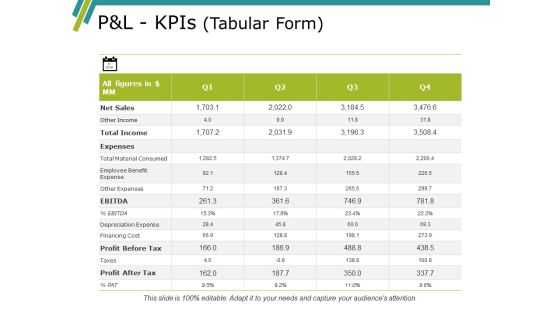
Pandl Kpis Template Ppt PowerPoint Presentation Gallery Summary
This is a pandl kpis template ppt powerpoint presentation gallery summary. This is a four stage process. The stages in this process are revenue, cogs, operating profit, net profit.

Clustered Bar Ppt PowerPoint Presentation Professional Designs Download
This is a clustered bar ppt powerpoint presentation professional designs download. This is a three stage process. The stages in this process are clustered bar, finance, marketing, strategy, business.

Balance Sheet Kpis Ppt PowerPoint Presentation Infographic Template Designs
This is a balance sheet kpis ppt powerpoint presentation infographic template designs. This is a four stage process. The stages in this process are business, marketing, finance, graph, strategy.

Cash Flow Statement Kpis Ppt PowerPoint Presentation Clipart
This is a cash flow statement kpis ppt powerpoint presentation clipart. This is a four stage process. The stages in this process are business, marketing, finance, graph, strategy.
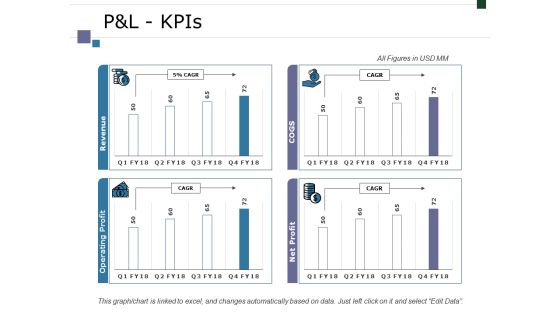
Pandl Kpis Ppt PowerPoint Presentation Infographic Template Graphics Tutorials
This is a pandl kpis ppt powerpoint presentation infographic template graphics tutorials. This is a four stage process. The stages in this process are business, marketing, finance, graph, strategy.
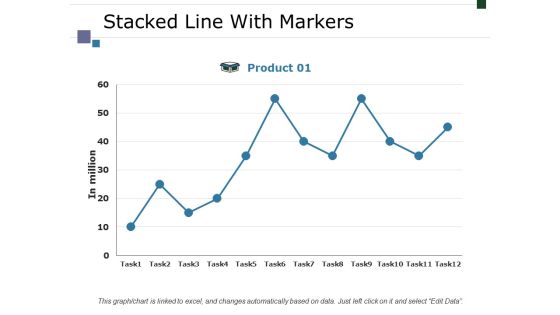
Stacked Line With Markers Ppt PowerPoint Presentation Layouts Display
This is a stacked line with markers ppt powerpoint presentation layouts display. This is a one stage process. The stages in this process are business, marketing, strategy, in million, finance.

Balance Sheet Kpis Template 1 Ppt PowerPoint Presentation Pictures Grid
This is a balance sheet kpis template 1 ppt powerpoint presentation pictures grid. This is a four stage process. The stages in this process are current assets, current liabilities, total assets, total liabilities.

Cash Flow Statement - Kpis Ppt PowerPoint Presentation Layouts Graphics Template
This is a cash flow statement - kpis ppt powerpoint presentation layouts graphics template. This is a four stage process. The stages in this process are operations, financing activities, investing activities, net increase in cash.
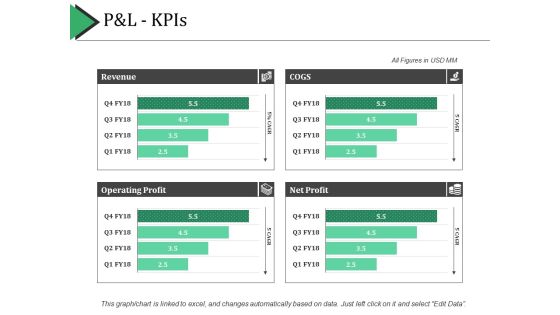
P And L Kpis Ppt PowerPoint Presentation Show Example Introduction
This is a p and l kpis ppt powerpoint presentation show example introduction. This is a four stage process. The stages in this process are revenue, cogs, net profit, operating profit.

Clustered Bar Ppt PowerPoint Presentation Styles Graphics
This is a clustered bar ppt powerpoint presentation styles graphics. This is a three stage process. The stages in this process are business, marketing, finance, graph, strategy, unit count.

Balance Sheet Kpis Ppt PowerPoint Presentation Summary Designs Download
This is a balance sheet kpis ppt powerpoint presentation summary designs download. This is a four stage process. The stages in this process are current assets, current liabilities, total liabilities, operating profit, business.

Cash Flow Statement Kpis Ppt PowerPoint Presentation Styles Themes
This is a cash flow statement kpis ppt powerpoint presentation styles themes. This is a four stage process. The stages in this process are business, operations, operating profit, total liabilities, current liabilities.

 Home
Home