Two Lists
Trend Arrow Chart Illustrating Business Projection Ppt PowerPoint Presentation Ideas Sample PDF
Presenting trend arrow chart illustrating business projection ppt powerpoint presentation ideas sample pdf to dispense important information. This template comprises three stages. It also presents valuable insights into the topics including trend arrow chart illustrating business projection. This is a completely customizable PowerPoint theme that can be put to use immediately. So, download it and address the topic impactfully.

Chart Showing Growth In Property Value Ppt PowerPoint Presentation File Background Designs PDF
Presenting chart showing growth in property value ppt powerpoint presentation file background designs pdf to dispense important information. This template comprises three stages. It also presents valuable insights into the topics including chart showing growth in property value. This is a completely customizable PowerPoint theme that can be put to use immediately. So, download it and address the topic impactfully.

Deferred Revenue Expenses Chart Vector Icon Ppt PowerPoint Presentation File Format PDF
Presenting deferred revenue expenses chart vector icon ppt powerpoint presentation file format pdf to dispense important information. This template comprises three stages. It also presents valuable insights into the topics including deferred revenue expenses chart vector icon. This is a completely customizable PowerPoint theme that can be put to use immediately. So, download it and address the topic impactfully.
Dollar Note Icon With Chart Depicting Business Expenses Ppt PowerPoint Presentation Gallery Model PDF
Presenting dollar note icon with chart depicting business expenses ppt powerpoint presentation gallery model pdf to dispense important information. This template comprises three stages. It also presents valuable insights into the topics including dollar note icon with chart depicting business expenses. This is a completely customizable PowerPoint theme that can be put to use immediately. So, download it and address the topic impactfully.

5 Years Revenue Comparative Analysis Chart Icon Ppt Inspiration Diagrams PDF
Presenting 5 Years Revenue Comparative Analysis Chart Icon Ppt Inspiration Diagrams PDF to dispense important information. This template comprises three stages. It also presents valuable insights into the topics including 5 Years, Revenue Comparative, Analysis Chart, Icon. This is a completely customizable PowerPoint theme that can be put to use immediately. So, download it and address the topic impactfully.
Strategic Plan Goals And Objectives Ppt PowerPoint Presentation Infographic Template Smartart
This is a strategic plan goals and objectives ppt powerpoint presentation infographic template smartart. This is a four stage process. The stages in this process are strategic plan, targets, business, marketing, success.
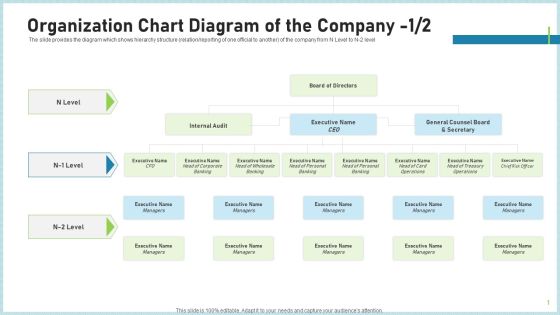
Pitch Deck To Attract Funding After IPO Market Organization Chart Diagram Of The Company Level Elements PDF
The slide provides the diagram which shows hierarchy structure relation or reporting of one official to another of the company from N Level to N 2 level Presenting pitch deck to attract funding after ipo market organization chart diagram of the company level elements pdf to provide visual cues and insights. Share and navigate important information on three stages that need your due attention. This template can be used to pitch topics like internal audit, executive name, general counsel board. In addtion, this PPT design contains high resolution images, graphics, etc, that are easily editable and available for immediate download.
Investor Deck For Procuring Funds From Money Market Organization Chart Diagram Of The Company Icon Elements PDF
The slide provides the diagram which shows hierarchy structure relation or reporting of one official to another of the company from N Level to N 2 level. Presenting investor deck for procuring funds from money market organization chart diagram of the company icon elements pdf to provide visual cues and insights. Share and navigate important information on three stages that need your due attention. This template can be used to pitch topics like internal audit, executive name, general counsel board and secretary. In addtion, this PPT design contains high resolution images, graphics, etc, that are easily editable and available for immediate download.

Cybersecurity Dashboard For ABS Healthcare Company Ppt Themes PDF
This slide shows a cybersecurity dashboard with KPIs such as total cybersecurity cases in company in 2021, total records stoles, malware cases resolved, operational efficiency, mean time to resolve threats etc. Presentingcybersecurity dashboard for abs healthcare company ppt themes pdf to provide visual cues and insights. Share and navigate important information on eight stages that need your due attention. This template can be used to pitch topics like phishing attacks 2021, records stolen 2021, malware cases resolved 2021, malware attacks 2021, hacking incidents 2021. In addtion, this PPT design contains high resolution images, graphics, etc, that are easily editable and available for immediate download.

Risk Management For Organization Essential Assets Statistics Associated To Workplace Threats Structure PDF
This slide provides details regarding statistics associated to workplace threats that firms face in terms of data records theft, workplace violence, financial phishing, etc. Presenting risk management for organization essential assets statistics associated to workplace threats structure pdf to provide visual cues and insights. Share and navigate important information on five stages that need your due attention. This template can be used to pitch topics like organizations, cyber attacks costs, data records. In addtion, this PPT design contains high resolution images, graphics, etc, that are easily editable and available for immediate download.

Sustainable Energy Resources About Us Green Energy Power Plant Firm Structure PDF
This slide represents the introduction of a green energy power firm, including the years of track record, rank in the US commercial, and years of project warranty. Presenting Sustainable Energy Resources About Us Green Energy Power Plant Firm Structure PDF to provide visual cues and insights. Share and navigate important information on three stages that need your due attention. This template can be used to pitch topics like Track Record, US Commercial, Green Energy, Industry leading. In addtion, this PPT design contains high resolution images, graphics, etc, that are easily editable and available for immediate download.

Monthly Project Progress Timeline Powerpoint Slide Presentation Guidelines
This is a monthly project progress timeline powerpoint slide presentation guidelines. This is a five stage process. The stages in this process are scheduling, absences, profile management, programme management, advanced scheduling, enrolment, notification, business analytics, iteration, vacation, deployment, final presentation, we are here, midterm presentation.

Data Collection And Analysis Control Chart Ppt PowerPoint Presentation Example File
This is a data collection and analysis control chart ppt powerpoint presentation example file. This is a four stage process. The stages in this process are business, strategy, marketing, bar graph, growth strategy.
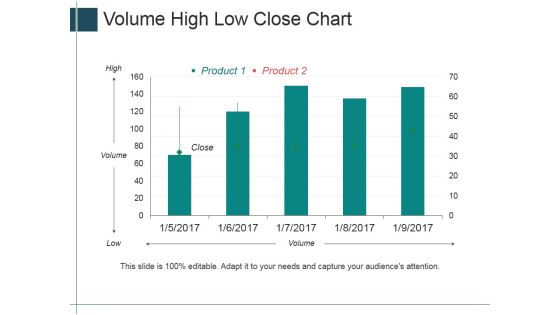
Volume High Low Close Chart Ppt PowerPoint Presentation Summary Layout Ideas
This is a volume high low close chart ppt powerpoint presentation summary layout ideas. This is a five stage process. The stages in this process are high, volume, low, close, product.

Competitive Analysis Template 6 Scatter Chart Ppt PowerPoint Presentation Icon Example Topics
This is a competitive analysis template 6 scatter chart ppt powerpoint presentation icon example topics. This is a eight stage process. The stages in this process are users interface, data import, example, pricing, support, update, tutorials, easy to use.

Competitive Analysis Template 7 Bubble Chart Ppt PowerPoint Presentation Summary Guidelines
This is a competitive analysis template 7 bubble chart ppt powerpoint presentation summary guidelines. This is a six stage process. The stages in this process are business, bubble, management, strategy, marketing.

Competitive Analysis Template 8 Matrix Chart Ppt PowerPoint Presentation Show Outfit
This is a competitive analysis template 8 matrix chart ppt powerpoint presentation show outfit. This is a six stage process. The stages in this process are product quality, product fidelity, after sales service, customer service, price, shipping speed.

Project Management Gantt Chart Template 1 Ppt PowerPoint Presentation Show Professional
This is a project management gantt chart template 1 ppt powerpoint presentation show professional. This is a nine stage process. The stages in this process are table, business, strategy, compare, marketing.

Project Management Gantt Chart Template 1 Ppt PowerPoint Presentation Professional Skills
This is a project management gantt chart template 1 ppt powerpoint presentation professional skills. This is a three stage process. The stages in this process are compare, business, marketing, table, strategy.
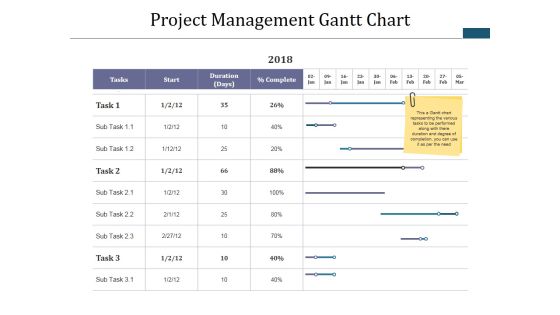
Project Management Gantt Chart Template 1 Ppt PowerPoint Presentation Infographics Tips
This is a project management gantt chart template 1 ppt powerpoint presentation infographics tips. This is a four stage process. The stages in this process are table, business, marketing, strategy, compare.
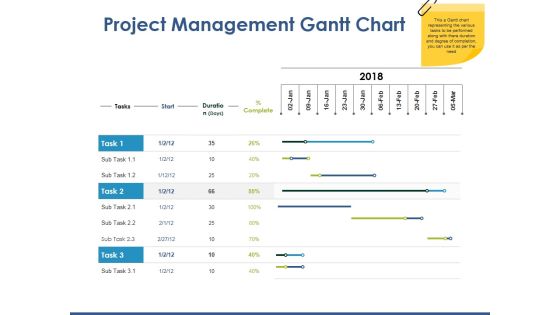
Project Management Gantt Chart Template 1 Ppt PowerPoint Presentation Professional Example File
This is a project management gantt chart template 1 ppt powerpoint presentation professional example file. This is a three stage process. The stages in this process are compare, business, strategy, marketing, table.

Open High Low Close Chart Ppt PowerPoint Presentation Slides File Formats
This is a open high low close chart ppt powerpoint presentation slides file formats. This is a five stage process. The stages in this process are open, high, low, close, finance.

Company Competitors Analysis Chart Market Share And Return On Equity Ppt PowerPoint Presentation Picture
This is a company competitors analysis chart market share and return on equity ppt powerpoint presentation picture. This is a seven stage process. The stages in this process are competitive analysis, benchmark competition, competition landscape.

Volume Open High Low Close Chart Ppt PowerPoint Presentation Model Inspiration
This is a volume open high low close chart ppt powerpoint presentation model inspiration. This is a three stage process. The stages in this process are business, management, strategy, marketing, sales.
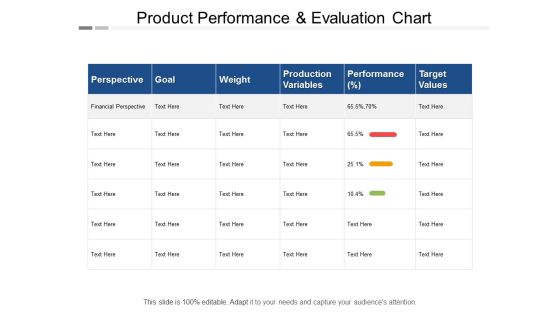
Product Performance And Evaluation Chart Ppt PowerPoint Presentation Pictures Slide Download
This is a product performance and evaluation chart ppt powerpoint presentation pictures slide download. This is a sex stage process. The stages in this process are production management, production performance, production improvement.
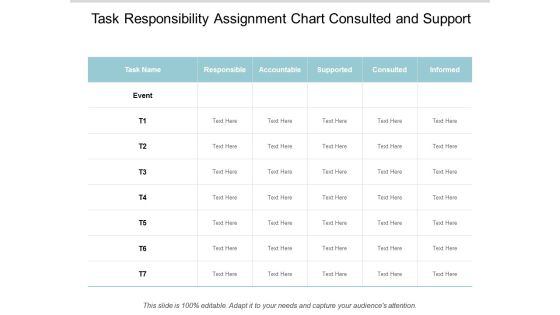
Task Responsibility Assignment Chart Consulted And Support Ppt Powerpoint Presentation Styles Background
This is a task responsibility assignment chart consulted and support ppt powerpoint presentation styles background. This is a seven stage process. The stages in this process are authority matrix, responsibility matrix, leadership matrix.

Pie Of Pie Chart Finance Ppt Powerpoint Presentation File Design Templates
This is a pie of pie chart finance ppt powerpoint presentation file design templates. This is a four stage process. The stages in this process are finance, marketing, management, investment, analysis.

Bar Chart With Magnifying Glass For Financial Analysis Ppt Powerpoint Presentation Infographics Designs Download
This is a bar chart with magnifying glass for financial analysis ppt powerpoint presentation infographics designs download. This is a three stage process. The stages in this process are business metrics, business kpi, business dashboard.

Data Statistics Charts And Key Performance Indicators Ppt Powerpoint Presentation Layouts Guide
This is a data statistics charts and key performance indicators ppt powerpoint presentation layouts guide. This is a four stage process. The stages in this process are business metrics, business kpi, business dashboard.

Financial Charts And Graphs For Statistical Analysis Ppt Powerpoint Presentation Show Layout
This is a financial charts and graphs for statistical analysis ppt powerpoint presentation show layout. This is a four stage process. The stages in this process are business metrics, business kpi, business dashboard.

Thank You Consumer Service Process Flow Chart Ppt Powerpoint Presentation Gallery Outfit
This is a thank you consumer service process flow chart ppt powerpoint presentation gallery outfit. This is a one stage process. The stages in this process are thank you.

Pie Chart To Survey Business Outcomes Ppt Powerpoint Presentation Infographic Template Gridlines
This is a pie chart to survey business outcomes ppt powerpoint presentation infographic template gridlines. This is a seven stage process. The stages in this process are business outcomes, business results, business output.

Donut Chart Finance Marketing Ppt Powerpoint Presentation Infographics Skills Ppt Powerpoint Presentation File Skills
This is a donut chart finance marketing ppt powerpoint presentation infographics skills ppt powerpoint presentation file skills. This is a four stage process. The stages in this process are finance, marketing, management, investment, analysis.

Project Management Gantt Chart Activity Ppt PowerPoint Presentation Model Background Designs
This is a project management gantt chart activity ppt powerpoint presentation model background designs. This is a three stage process. The stages in this process are marketing, business, management, compare.
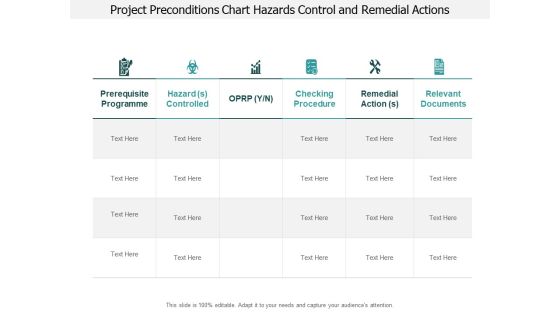
Project Preconditions Chart Hazards Control And Remedial Actions Ppt PowerPoint Presentation Pictures Show
This is a project preconditions chart hazards control and remedial actions ppt powerpoint presentation pictures show. This is a six stage process. The stages in this process are need, requirement, prerequisite.

Return On Capital Employed Product Performance Chart Ppt PowerPoint Presentation Portfolio Visuals
This is a return on capital employed product performance chart ppt powerpoint presentation portfolio visuals. This is a three stage process. The stages in this process are accounting ratio, roce, return on capital employed.

Donut Pie Chart Marketing Ppt Powerpoint Presentation Infographic Template Graphics Template
This is a donut pie chart marketing ppt powerpoint presentation infographic template graphics template. This is a six stage process. The stages in this process are finance, marketing, management, investment, analysis.

Thank You Customer Service Process Flow Chart Ppt PowerPoint Presentation Slides Ideas
This is a thank you customer service process flow chart ppt powerpoint presentation slides ideas. This is a one stage process. The stages in this process are thank you, greeting, word.

Business Trends Bar Chart Vector Icon Ppt PowerPoint Presentation Inspiration Graphic Images PDF
Persuade your audience using this business trends bar chart vector icon ppt powerpoint presentation inspiration graphic images pdf. This PPT design covers three stages, thus making it a great tool to use. It also caters to a variety of topics including business trends bar chart vector icon. Download this PPT design now to present a convincing pitch that not only emphasizes the topic but also showcases your presentation skills.
Statistical Analysis Icon With Pie Chart Ppt PowerPoint Presentation Diagram Templates PDF
Persuade your audience using this statistical analysis icon with pie chart ppt powerpoint presentation diagram templates pdf. This PPT design covers three stages, thus making it a great tool to use. It also caters to a variety of topics including statistical analysis icon with pie chart. Download this PPT design now to present a convincing pitch that not only emphasizes the topic but also showcases your presentation skills.

Cost Structure Assessment Chart With Down Flow Vector Icon Ppt PowerPoint Presentation File Demonstration PDF
Presenting cost structure assessment chart with down flow vector icon ppt powerpoint presentation file demonstration pdf to dispense important information. This template comprises one stages. It also presents valuable insights into the topics including cost structure assessment chart with down flow vector icon. This is a completely customizable PowerPoint theme that can be put to use immediately. So, download it and address the topic impactfully.

Chart Icon With Magnifying Glass Depicting Decline In Sales Ppt PowerPoint Presentation Gallery Layout PDF
Presenting chart icon with magnifying glass depicting decline in sales ppt powerpoint presentation gallery layout pdf to dispense important information. This template comprises three stages. It also presents valuable insights into the topics including chart icon with magnifying glass depicting decline in sales. This is a completely customizable PowerPoint theme that can be put to use immediately. So, download it and address the topic impactfully.

Chart Vector Showing Loss In Inside Sales Ppt PowerPoint Presentation Gallery Guide PDF
Persuade your audience using this chart vector showing loss in inside sales ppt powerpoint presentation gallery guide pdf. This PPT design covers three stages, thus making it a great tool to use. It also caters to a variety of topics including chart vector showing loss in inside sales. Download this PPT design now to present a convincing pitch that not only emphasizes the topic but also showcases your presentation skills.
Pie Chart With Dollar Symbol For Market Share Vector Icon Ppt PowerPoint Presentation File Show PDF
Persuade your audience using this pie chart with dollar symbol for market share vector icon ppt powerpoint presentation file show pdf. This PPT design covers three stages, thus making it a great tool to use. It also caters to a variety of topics including pie chart with dollar symbol for market share vector icon. Download this PPT design now to present a convincing pitch that not only emphasizes the topic but also showcases your presentation skills.
Money Investment Growth Chart Vector Icon Ppt PowerPoint Presentation Slides Influencers PDF
Persuade your audience using this money investment growth chart vector icon ppt powerpoint presentation slides influencers pdf. This PPT design covers three stages, thus making it a great tool to use. It also caters to a variety of topics including money investment growth chart vector icon. Download this PPT design now to present a convincing pitch that not only emphasizes the topic but also showcases your presentation skills.

Business Trend Assessment Chart With Gear Vector Icon Ppt PowerPoint Presentation Styles Vector PDF
Persuade your audience using this business trend assessment chart with gear vector icon ppt powerpoint presentation styles vector pdf. This PPT design covers three stages, thus making it a great tool to use. It also caters to a variety of topics including business trend assessment chart with gear vector icon. Download this PPT design now to present a convincing pitch that not only emphasizes the topic but also showcases your presentation skills.
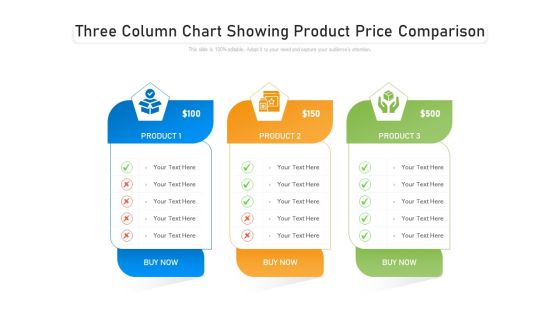
Three Column Chart Showing Product Price Comparison Ppt PowerPoint Presentation Ideas Deck PDF
Persuade your audience using this three column chart showing product price comparison ppt powerpoint presentation ideas deck pdf. This PPT design covers three stages, thus making it a great tool to use. It also caters to a variety of topics including three column chart showing product price comparison. Download this PPT design now to present a convincing pitch that not only emphasizes the topic but also showcases your presentation skills.

Three Column Chart With Product Feature Comparison Ppt PowerPoint Presentation Gallery Layouts PDF
Persuade your audience using this three column chart with product feature comparison ppt powerpoint presentation gallery layouts pdf. This PPT design covers three stages, thus making it a great tool to use. It also caters to a variety of topics including three column chart with product feature comparison. Download this PPT design now to present a convincing pitch that not only emphasizes the topic but also showcases your presentation skills.
Three Column Chart With Various Solutions And Icons Ppt PowerPoint Presentation Infographic Template Graphics Design PDF
Pitch your topic with ease and precision using this three column chart with various solutions and icons ppt powerpoint presentation infographic template graphics design pdf. This layout presents information on three column chart with various solutions and icons. It is also available for immediate download and adjustment. So, changes can be made in the color, design, graphics or any other component to create a unique layout.
Scatter Chart With Horizontal And Vertical Axis Ppt PowerPoint Presentation Icon Infographics PDF
Persuade your audience using this scatter chart with horizontal and vertical axis ppt powerpoint presentation icon infographics pdf. This PPT design covers three stages, thus making it a great tool to use. It also caters to a variety of topics including scatter chart with horizontal and vertical axis. Download this PPT design now to present a convincing pitch that not only emphasizes the topic but also showcases your presentation skills.
Statistical Assessment Scatter Chart Icon Ppt PowerPoint Presentation Infographic Template PDF
Persuade your audience using this statistical assessment scatter chart icon ppt powerpoint presentation infographic template pdf. This PPT design covers three stages, thus making it a great tool to use. It also caters to a variety of topics including statistical assessment scatter chart icon. Download this PPT design now to present a convincing pitch that not only emphasizes the topic but also showcases your presentation skills.
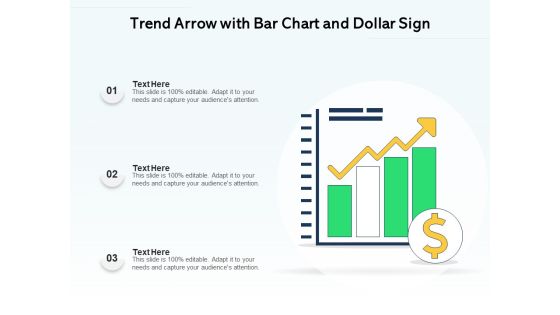
Trend Arrow With Bar Chart And Dollar Sign Ppt PowerPoint Presentation Influencers PDF
Persuade your audience using this trend arrow with bar chart and dollar sign ppt powerpoint presentation influencers pdf. This PPT design covers three stages, thus making it a great tool to use. It also caters to a variety of topics including trend arrow with bar chart and dollar sign. Download this PPT design now to present a convincing pitch that not only emphasizes the topic but also showcases your presentation skills.

Business Stakeholder With Finance Chart Vector Icon Ppt PowerPoint Presentation File Portfolio PDF
Persuade your audience using this business stakeholder with finance chart vector icon ppt powerpoint presentation file portfolio pdf. This PPT design covers one stages, thus making it a great tool to use. It also caters to a variety of topics including business stakeholder with finance chart vector icon. Download this PPT design now to present a convincing pitch that not only emphasizes the topic but also showcases your presentation skills.

Business Economics With Currency Sign And Chart Vector Icon Ppt PowerPoint Presentation Gallery Structure PDF
Persuade your audience using this business economics with currency sign and chart vector icon ppt powerpoint presentation gallery structure pdf. This PPT design covers three stages, thus making it a great tool to use. It also caters to a variety of topics including business economics with currency sign and chart vector icon. Download this PPT design now to present a convincing pitch that not only emphasizes the topic but also showcases your presentation skills.
Economics With Business Growth Chart Vector Icon Ppt PowerPoint Presentation File Rules PDF
Persuade your audience using this economics with business growth chart vector icon ppt powerpoint presentation file rules pdf. This PPT design covers three stages, thus making it a great tool to use. It also caters to a variety of topics including economics with business growth chart vector icon. Download this PPT design now to present a convincing pitch that not only emphasizes the topic but also showcases your presentation skills.

Bullish Stock Trading Chart With Dollar Symbol Vector Icon Ppt PowerPoint Presentation Icon Infographic Template PDF
Presenting bullish stock trading chart with dollar symbol vector icon ppt powerpoint presentation icon infographic template pdf to dispense important information. This template comprises three stages. It also presents valuable insights into the topics including bullish stock trading chart with dollar symbol vector icon. This is a completely customizable PowerPoint theme that can be put to use immediately. So, download it and address the topic impactfully.

Vector Showing Statistics Comparison Bar Chart Ppt Visual Aids Styles PDF
Persuade your audience using this Vector Showing Statistics Comparison Bar Chart Ppt Visual Aids Styles PDF. This PPT design covers three stages, thus making it a great tool to use. It also caters to a variety of topics including vector showing statistics comparison bar chart. Download this PPT design now to present a convincing pitch that not only emphasizes the topic but also showcases your presentation skills.
Performance Statistics Chart With Magnifying Glass Vector Icon Ppt Show Shapes PDF
Presenting performance statistics chart with magnifying glass vector icon ppt show shapes pdf to provide visual cues and insights. Share and navigate important information on four stages that need your due attention. This template can be used to pitch topics like performance statistics chart with magnifying glass vector icon. In addition, this PPT design contains high-resolution images, graphics, etc, that are easily editable and available for immediate download.
Manager Analyzing Trends From Financial Modelling Chart Vector Icon Portrait PDF
Persuade your audience using this manager analyzing trends from financial modelling chart vector icon portrait pdf. This PPT design covers three stages, thus making it a great tool to use. It also caters to a variety of topics including manager analyzing trends from financial modelling chart vector icon. Download this PPT design now to present a convincing pitch that not only emphasizes the topic but also showcases your presentation skills.

5 Years Mutual Funds Performance Comparative Analysis Chart Icon Ppt Show Gridlines PDF
Persuade your audience using this 5 Years Mutual Funds Performance Comparative Analysis Chart Icon Ppt Show Gridlines PDF. This PPT design covers three stages, thus making it a great tool to use. It also caters to a variety of topics including 5 Years, Mutual Funds, Performance Comparative, Analysis, Chart Icon. Download this PPT design now to present a convincing pitch that not only emphasizes the topic but also showcases your presentation skills.
 Home
Home