Two Elements
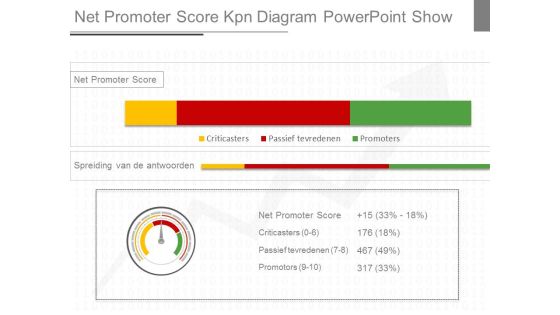
Net Promoter Score Kpn Diagram Powerpoint Show
This is a net promoter score kpn diagram powerpoint show. This is a three stage process. The stages in this process are net promoter score, criticasters, passief tevredenen, promoters, spreiding van de antwoorden.

Net Promoter Score Report Analysis Ppt Powerpoint Show
This is a net promoter score report analysis ppt powerpoint show. This is a three stage process. The stages in this process are detractors, passives, promoters, your nps, nps, percentage promoters, percentage detractors.

Net Promoter Score Results Ppt Powerpoint Show
This is a net promoter score results ppt powerpoint show. This is a five stage process. The stages in this process are net promoter score, detractors, passief tevredenen, promotors, passives, response breakdown.

Optimize The Risk Return Example Powerpoint Show
This is a optimize the risk return example powerpoint show. This is a three stage process. The stages in this process are expected return, conservative, balanced, growth, stocks, bonds, real estate, commodities, risk.

Sales Forecasting Analysis Powerpoint Slide Ideas
This is a sales forecasting analysis powerpoint slide ideas. This is a three stage process. The stages in this process are collect and analysis data, calculate sales forecast, determine forecasting method.
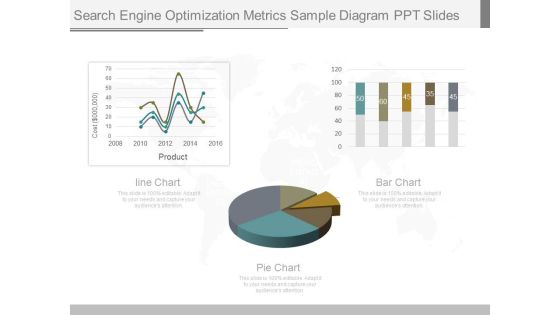
Search Engine Optimization Metrics Sample Diagram Ppt Slides
This is a search engine optimization metrics sample diagram ppt slides. This is a three stage process. The stages in this process are cost, product, line chart, bar chart, pie chart.
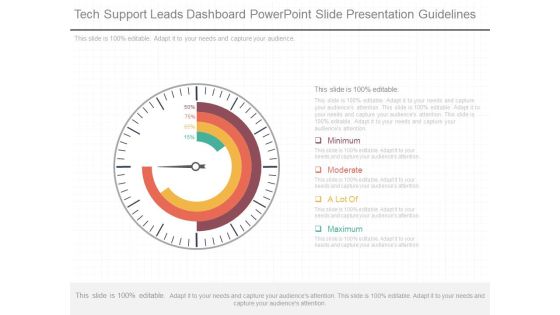
Tech Support Leads Dashboard Powerpoint Slide Presentation Guidelines
This is a tech support leads dashboard powerpoint slide presentation guidelines. This is a four stage process. The stages in this process are minimum, moderate, a lot of, maximum.

Advertising And Sales Promotion Efforts Ppt Sample Presentations
This is a advertising and sales promotion efforts ppt sample presentations. This is a three stage process. The stages in this process are consumer, trade, sales and promotion, advertising.

Customer Satisfaction Scores Layout Ppt Slides Download
This is a customer satisfaction scores layout ppt slides download. This is a six stage process. The stages in this process are loyalty index, net promoters score, overall experience, performance with employee, satisfaction with employee, satisfaction with wait time.

Engineering Foundation Powerpoint Slide Download
This is a engineering foundation powerpoint slide download. This is a five stage process. The stages in this process are engineering foundation, management foundation, design electives, thesis project, leadership electives.
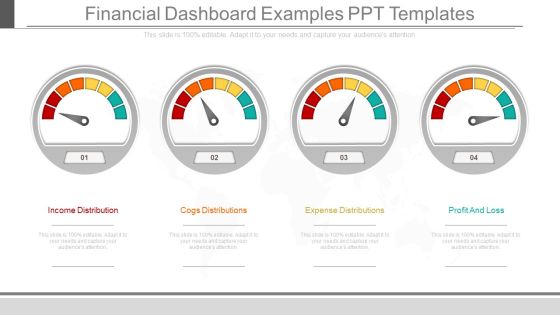
Financial Dashboard Examples Ppt Templates
This is a financial dashboard examples ppt templates. This is a four stage process. The stages in this process are income distribution, cogs distributions, expense distributions, profit and loss.

Identify Insights Diagram Powerpoint Slides
This is a identify insights diagram powerpoint slides. This is a five stage process. The stages in this process are identify insights, establish design criteria, brainstorm ideas, develop concept, surface key assumption.
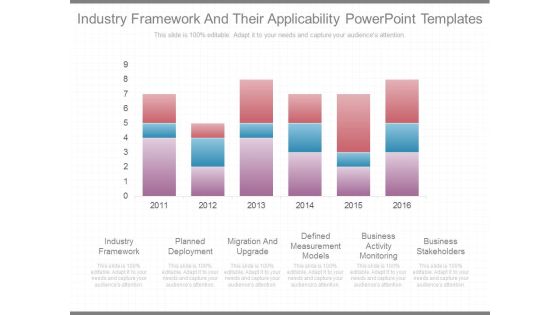
Industry Framework And Their Applicability Powerpoint Templates
This is a industry framework and their applicability powerpoint templates. This is a six stage process. The stages in this process are industry framework, planned deployment, migration and upgrade, defined measurement models, business activity monitoring, business stakeholders.

Social Networking For Business Sales Layout Ppt Sample File
This is a social networking for business sales layout ppt sample file. This is a five stage process. The stages in this process are goal, social networking, relationships, prospects, sales funnel, sales.

Model Of Strategy Implementation Ppt Powerpoint Layout
This is a model of strategy implementation ppt powerpoint layout. This is a five stage process. The stages in this process are threat of new entrants, bargaining power of suppliers, bargaining power of buyers, threat of substitutes, industry rivalry.

Factors Impacting Job Satisfaction Diagram Powerpoint Guide
This is a factors impacting job satisfaction diagram powerpoint guide. This is a five stage process. The stages in this process are workplace support, earnings and benefits, job demands, individual virility, job quality.
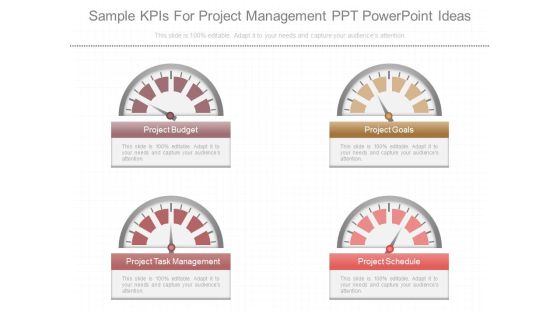
Sample Kpis For Project Management Ppt Powerpoint Ideas
This is a sample kpis for project management ppt powerpoint ideas. This is a four stage process. The stages in this process are project budget, project goals, project task management, project schedule.
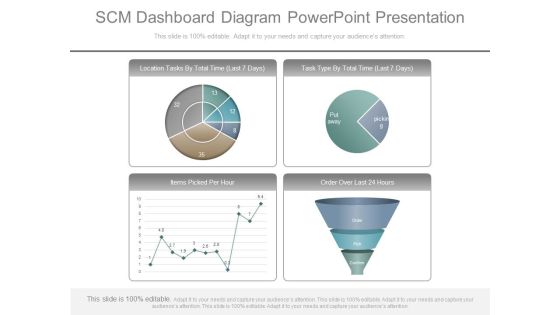
Scm Dashboard Diagram Powerpoint Presentation
This is a scm dashboard diagram powerpoint presentation. This is a four stage process. The stages in this process are location tasks by total time, task type by total time, items picked per hour, order over last.
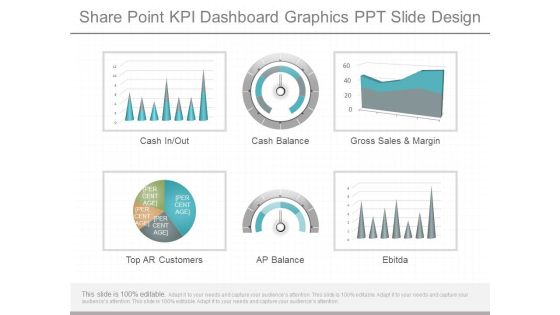
Share Point Kpi Dashboard Graphics Ppt Slide Design
This is a share point kpi dashboard graphics ppt slide design. This is a six stage process. The stages in this process are cash in out, cash balance, gross sales and margin, top ar customers, ap balance, ebitda.

Software Dashboard Manager Test Diagram Presentation Examples
This is a software dashboard manager test diagram presentation examples. This is a four stage process. The stages in this process are issues by risk level, reported issues, location on map, top contributing factors.

Supply Chain Metrics And Kpi Examples Presentation Visuals
This is a supply chain metrics and kpi examples presentation visuals. This is a four stage process. The stages in this process are carrying cost of inventory, inventory turnover, order tracking, rate of return.
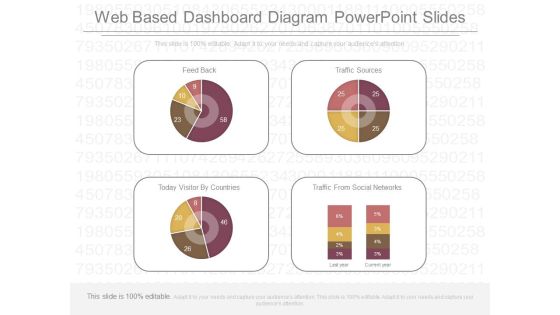
Web Based Dashboard Diagram Powerpoint Slides
This is a web based dashboard diagram powerpoint slides. This is a four stage process. The stages in this process are feed back, traffic sources, today visitor by countries, traffic from social networks.
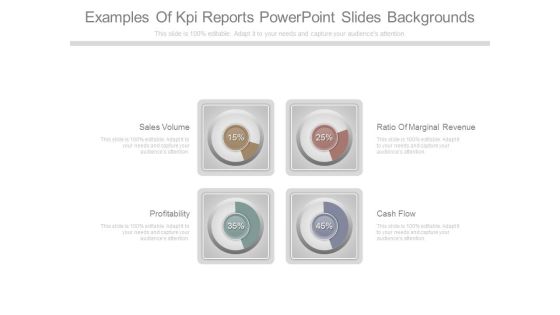
Examples Of Kpi Reports Powerpoint Slides Backgrounds
This is a examples of kpi reports powerpoint slides backgrounds. This is a four stage process. The stages in this process are sales volume, profitability, ratio of marginal revenue, cash flow.
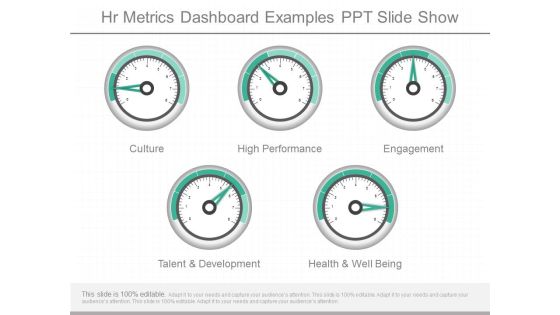
Hr Metrics Dashboard Examples Ppt Slide Show
This is a hr metrics dashboard examples ppt slide show. This is a five stage process. The stages in this process are culture, high performance, engagement, talent and development, health and well being.
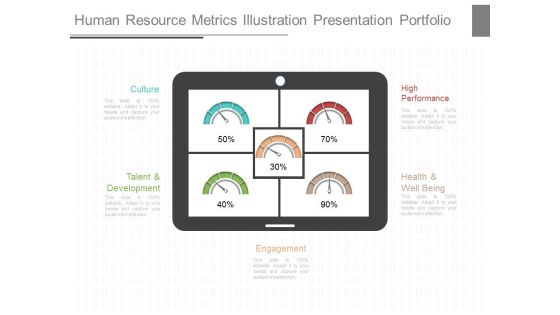
Human Resource Metrics Illustration Presentation Portfolio
This is a human resource metrics illustration presentation portfolio. This is a five stage process. The stages in this process are culture, high performance, talent and development, health and well being, engagement.
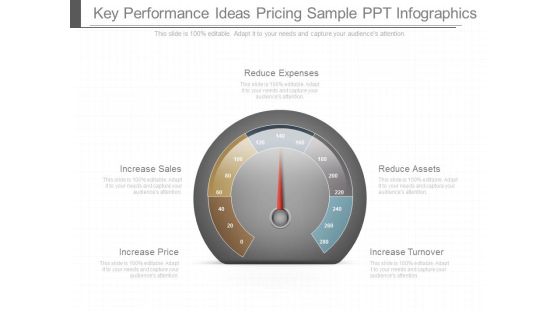
Key Performance Ideas Pricing Sample Ppt Infographics
This is a key performance ideas pricing sample ppt infographics. This is a five stage process. The stages in this process are increase price, increase sales, reduce expenses, reduce assets, increase turnover.

Key Performance Indicator Dashboard Diagram Example Of Ppt
This is a key performance indicator dashboard diagram example of ppt. This is a five stage process. The stages in this process are relationships, account plans, account strategy, setting tools, reporting.

Kpi Dashboard Ppt Powerpoint Slide Design Templates
This is a kpi dashboard ppt powerpoint slide design templates. This is a four stage process. The stages in this process are sales, new customer, budget, resource and task.
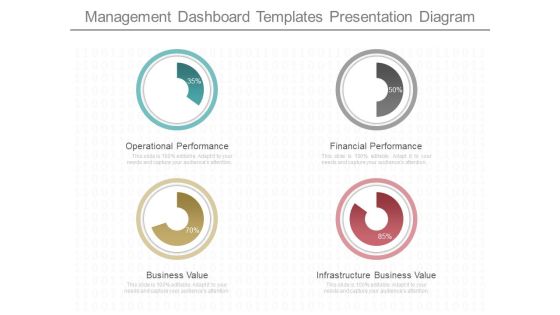
Management Dashboard Templates Presentation Diagram
This is a management dashboard templates presentation diagram. This is a four stage process. The stages in this process are operational performance, business value, financial performance, infrastructure business value.

Manufacturing Kpi Examples Powerpoint Slides
This is a manufacturing kpi examples powerpoint slides. This is a six stage process. The stages in this process are planning, production execution, production quality, costing, work order analysis, inventory.

Mobile Commerce Dashboard Ppt Powerpoint Images
This is a mobile commerce dashboard ppt powerpoint images. This is a four stage process. The stages in this process are revenue by chennai, mobile vs site revenue, onsite behavior, mobile revenue and aov.

Portfolio Management Dashboard Diagram Powerpoint Slides
This is a portfolio management dashboard diagram powerpoint slides. This is a three stage process. The stages in this process are portfolio delivery roadmap, portfolio financials, project alpha, project beeta, project gama, project zeta, project zeema, schedule, risks, issues, budget.

Project Kpi Sample Dashboard Diagram Powerpoint Images
This is a project kpi sample dashboard diagram powerpoint images. This is a four stage process. The stages in this process are costs thousands, employee names, burndown, project status.

Project Management Kpi Dashboard Diagram Powerpoint Images
This is a project management kpi dashboard diagram powerpoint images. This is a four stage process. The stages in this process are project budget, project goals, project task management, project schedule.

Project Management Status Dashboard Diagram Powerpoint Ideas
This is a project management status dashboard diagram powerpoint ideas. This is a six stage process. The stages in this process are tabular reports, project s status, task status, visual reports, completed tasks, task in progress.
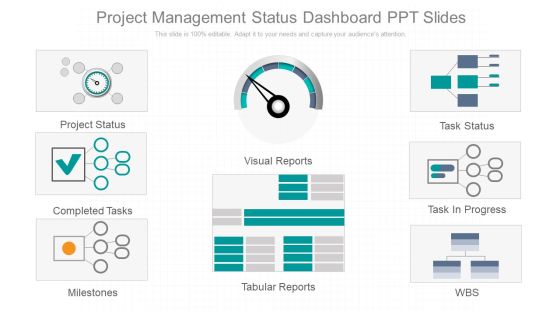
Project Management Status Dashboard Ppt Slides
This is a project management status dashboard ppt slides. This is a eight stage process. The stages in this process are project status, completed tasks, milestones, visual reports, tabular reports, task status, task in progress, wbs.

Average Days Sales Outstanding Analysis Ppt Example
This is a average days sales outstanding analysis ppt example. This is a four stage process. The stages in this process are target for week, inventory, sales vs quotes, sales vs quotes.

Bi Dashboard Design For Solutions Ppt Powerpoint Slides
This is a bi dashboard design for solutions ppt powerpoint slides. This is a four stage process. The stages in this process are total understand, total brands, total revenue, total sales.

Build Dashboard For Business Diagram Powerpoint Show
This is a build dashboard for business diagram powerpoint show. This is a four stage process. The stages in this process are average internal pv examination lead time, average entry variance, average internal audit lead time, amount contribution.

Business Intelligence Dashboard Design Ppt Powerpoint Topics
This is a business intelligence dashboard design ppt powerpoint topics. This is a four stage process. The stages in this process are sales analysis, sales forecasting, global distribution, sales by region, latin america, north america, eastern europe, western europe.

Business Kpi Dashboard Diagram Powerpoint Templates
This is a business kpi dashboard diagram powerpoint templates. This is a six stage process. The stages in this process are analytics, cost per sales, reporting, kpis, dashboard, visualization.

Capital Markets Dashboard Ppt Powerpoint Slide Background
This is a capital markets dashboard ppt powerpoint slide background. This is a three stage process. The stages in this process are weekly sales, product inventory, key performance indicators.

Competitive Intelligence Dashboard Diagram Ppt Slides
This is a competitive intelligence dashboard diagram ppt slides. This is a four stage process. The stages in this process are monthly sales, inventory turns, customer complaints, company, subject area.

Cool Dashboards For Product Showcase Ppt Powerpoint Slides
This is a cool dashboards for product showcase ppt powerpoint slides. This is a three stage process. The stages in this process are product showcase, product information, products variety.

Customer Service Key Performance Indicators Ppt Example
This is a customer service key performance indicators ppt example. This is a three stage process. The stages in this process are overall satisfaction with service, satisfaction with value for money, overall satisfaction with relationship.

Daily Executive Dashboards For Web Ppt Presentation Ideas
This is a daily executive dashboards for web ppt presentation ideas. This is a six stage process. The stages in this process are homepage, login, purchase ticket, email confirmation, ecommerce website, revenue per minute.

Dashboard Design And Development For Travel Diagram Background
This is a dashboard design and development for travel diagram background. This is a five stage process. The stages in this process are number of trips, sales, delayed flights, regional load, flight expense.

Dashboard For Six Sigma Ppt Powerpoint Templates
This is a dashboard for six sigma ppt powerpoint templates. This is a four stage process. The stages in this process are program savings, project count, project cycle time, six sigma training.

Dashboard Program Ppt Presentation Powerpoint
This is a dashboard program ppt presentation powerpoint. This is a six stage process. The stages in this process are tasks, progress, matrix, resource, utilization, time, safety, progress, sales rate.
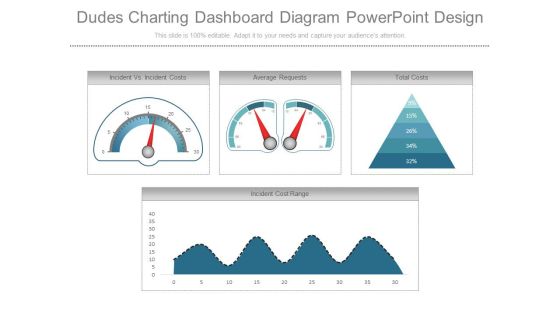
Dudes Charting Dashboard Diagram Powerpoint Design
This is a dudes charting dashboard diagram powerpoint design. This is a four stage process. The stages in this process are incident vs incident costs, average requests, total costs, incident cost range.

Average Profit Margin Examples Presentation Slides
This is a average profit margin examples presentation slides. This is a five stage process. The stages in this process are sales growth, sales opportunities, product performance, average profit margin, sales target.

Custom Market Research Format Diagram Presentation Ideas
This is a custom market research format diagram presentation ideas. This is a six stage process. The stages in this process are markets, products, industries, customers, vendors, competitors, custom market research.

Actual Project Management Linguistic Presentation Visual Aids
This is a actual project management linguistic presentation visual aids. This is a four stage process. The stages in this process are area, kpi name, target compliance, actual, linguistic, project management, engineering, finance.

Current Ratio Working Capital Presentation Visual Aids
This is a current ratio working capital presentation visual aids. This is a five stage process. The stages in this process are current ratio, working capital, return on equity, vendor expenses, income and expenses.

Bank Dashboards Sample Ppt Templates
This is a bank dashboards sample ppt templates. This is a four stage process. The stages in this process are bank pipeline, loans pipeline, lead by source campaign, deposit pipeline, january, february, march, april.

Cpi Spi Dashboard Sample Diagram Powerpoint Slide Designs
This is a cpi spi dashboard sample diagram powerpoint slide designs. This is a four stage process. The stages in this process are cpi spi, performance summary, cost schedule variance, task matrix.

Customer Service Kpi Diagram Powerpoint Slide Design
This is a customer service kpi diagram powerpoint slide design. This is a three stage process. The stages in this process are information desk, valet damage claims, gift shop sales.

Data Visualization For Market Ppt Example
This is a data visualization for market ppt example. This is a six stage process. The stages in this process are tree map chart, exploded pie chart, semi circle chart, bubble chart, line chart, stacked chart, series.
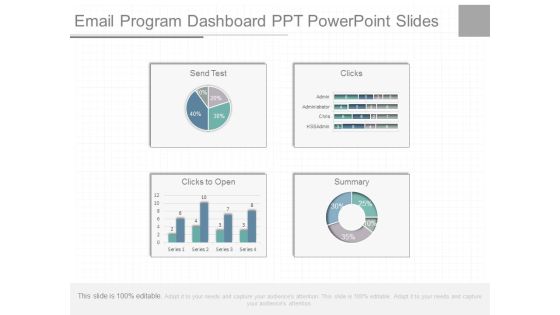
Email Program Dashboard Ppt Powerpoint Slides
This is a email program dashboard ppt powerpoint slides. This is a four stage process. The stages in this process are send test, clicks, clicks to open, summary, admin, administrator, chris, hssadmin.
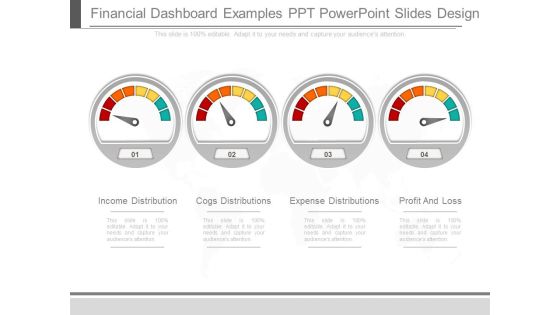
Financial Dashboard Examples Ppt Powerpoint Slides Design
This is a financial dashboard examples ppt powerpoint slides design. This is a four stage process. The stages in this process are income distribution, cogs distributions, expense distributions, profit and loss.
 Home
Home