Turnover Rate

Monthly Customer Acquisition Business Cost Comparison Table Diagrams PDF
This slide covers comparison table based on cost to acquire new customers. It includes elements such as average contract value, gross margin and profits, customer acquisition cost, sales and marketing expenses, addition of new customers, customer churn rates, lifetime value, etc. Pitch your topic with ease and precision using this Monthly Customer Acquisition Business Cost Comparison Table Diagrams PDF. This layout presents information on Gross Profit, Gross Margin, Customer Churn Rate. It is also available for immediate download and adjustment. So, changes can be made in the color, design, graphics or any other component to create a unique layout.

Measuring Net Retention And Revenue Churn With Kpi Dashboard Ideas PDF
Mentioned slide outlines a comprehensive dashboard outlining the results of customer churn prevention strategies. The key performance indicators KPIs covered in the slide are net promoter score NPS, loyal customer rate, customer lifetime value CLV, revenue churn, net retention rate, etc. The Measuring Net Retention And Revenue Churn With Kpi Dashboard Ideas PDF is a compilation of the most recent design trends as a series of slides. It is suitable for any subject or industry presentation, containing attractive visuals and photo spots for businesses to clearly express their messages. This template contains a variety of slides for the user to input data, such as structures to contrast two elements, bullet points, and slides for written information. Slidegeeks is prepared to create an impression.
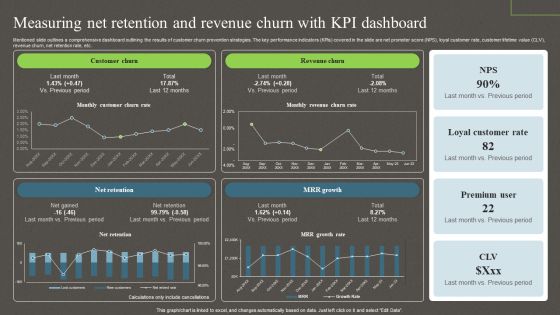
Measuring Net Retention And Revenue Churn With Kpi Dashboard Ppt PowerPoint Presentation File Backgrounds PDF
Mentioned slide outlines a comprehensive dashboard outlining the results of customer churn prevention strategies. The key performance indicators KPIs covered in the slide are net promoter score NPS, loyal customer rate, customer lifetime value CLV, revenue churn, net retention rate, etc. Boost your pitch with our creative Measuring Net Retention And Revenue Churn With Kpi Dashboard Ppt PowerPoint Presentation File Backgrounds PDF. Deliver an awe inspiring pitch that will mesmerize everyone. Using these presentation templates you will surely catch everyones attention. You can browse the ppts collection on our website. We have researchers who are experts at creating the right content for the templates. So you do not have to invest time in any additional work. Just grab the template now and use them.

Effective Sales Plan For New Product Introduction In Market Dashboard To Measure Sales Download PDF
This slide illustrates sales representative performance measurement dashboard with key metrics such as average first contact resolution rate, occupancy rate, NPS and top agents by solved tickets.Deliver and pitch your topic in the best possible manner with this Effective Sales Plan For New Product Introduction In Market Dashboard To Measure Sales Download PDF Use them to share invaluable insights on Sales Enquiry, Feature Request, Setup Request and impress your audience. This template can be altered and modified as per your expectations. So, grab it now.

Effective Sales Technique For New Product Launch Dashboard To Measure Sales Rep Performance Themes PDF
This slide illustrates sales representative performance measurement dashboard with key metrics such as average first contact resolution rate, occupancy rate, NPS and top agents by solved tickets.Deliver and pitch your topic in the best possible manner with this Effective Sales Technique For New Product Launch Dashboard To Measure Sales Rep Performance Themes PDF Use them to share invaluable insights on Contact Resolution, Feature Request, Promoters and impress your audience. This template can be altered and modified as per your expectations. So, grab it now.
Sales Process Management To Boost Business Effectiveness Sales Pipeline Tracking And Reporting Introduction PDF
This slide shows dashboard to track the performance of sales pipeline. Major points covered under this are number of opportunities, conversion rate, win rate, opportunity status etc. Deliver and pitch your topic in the best possible manner with this Sales Process Management To Boost Business Effectiveness Sales Pipeline Tracking And Reporting Introduction PDF. Use them to share invaluable insights on Return On Investment, Investment Review, Average Length and impress your audience. This template can be altered and modified as per your expectations. So, grab it now.
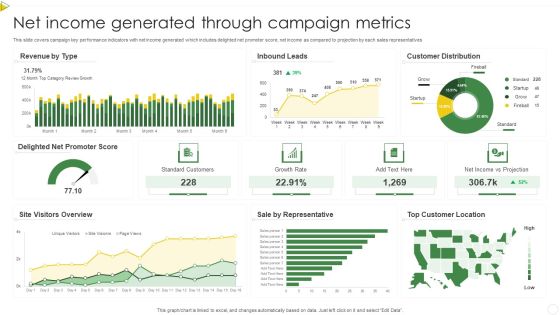
Net Income Generated Through Campaign Metrics Summary PDF
This slide covers campaign key performance indicators with net income generated which includes delighted net promoter score, net income as compared to projection by each sales representatives. Pitch your topic with ease and precision using this Net Income Generated Through Campaign Metrics Summary PDF. This layout presents information on Standard Customers, Growth Rate, Net Income. It is also available for immediate download and adjustment. So, changes can be made in the color, design, graphics or any other component to create a unique layout.
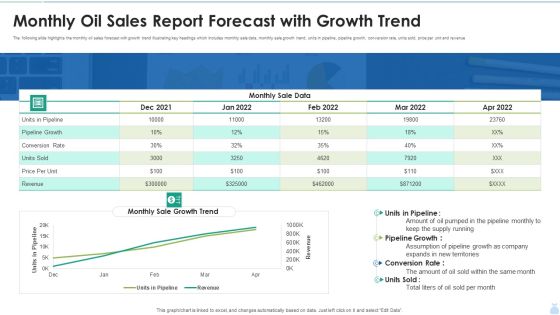
Monthly Oil Sales Report Forecast With Growth Trend Graphics PDF
The following slide highlights the monthly oil sales forecast with growth trend illustrating key headings which includes monthly sale data, monthly sale growth trend, units in pipeline, pipeline growth, conversion rate, units sold, price per unit and revenue. Showcasing this set of slides titled Monthly Oil Sales Report Forecast With Growth Trend Graphics PDF. The topics addressed in these templates are Pipeline Growth, Monthly Sale Data, Conversion Rate. All the content presented in this PPT design is completely editable. Download it and make adjustments in color, background, font etc. as per your unique business setting.

Data Driven Insurance Sales Procedure Boosting Revenue Sample PDF
The following slide highlights insurance sales cycle based on data for predictive analysis and real-time insights. It boost company sales. It includes components such as integrate front and back office, customer centric sales and improve renewal rates. Persuade your audience using this Data Driven Insurance Sales Procedure Boosting Revenue Sample PDF. This PPT design covers three stages, thus making it a great tool to use. It also caters to a variety of topics including Customer Centric Sales, Improve Renewal Rates, Revenue. Download this PPT design now to present a convincing pitch that not only emphasizes the topic but also showcases your presentation skills

Customer Decline Of Sales Analysis Dashboard Rules PDF
The following slide presents a key performance indicating dashboards that can be used by managers in order to analyse customer-lost sales. Major key performance indicators are lost deals rate, lost sales rate, customer data analytics, etc. Pitch your topic with ease and precision using this Customer Decline Of Sales Analysis Dashboard Rules PDF. This layout presents information on Customer Data Analytics. It is also available for immediate download and adjustment. So, changes can be made in the color, design, graphics or any other component to create a unique layout.

Retargeting Strategies To Improve Sales Impact Of Retargeting Campaign On Conversion Designs PDF
This slide covers the graphical representation of positive outcomes of the retargeting campaigns on website conversion rate. It also includes key insights such as increased repeat purchase rate, decreased returning purchasers to repeat purchaser rate, repeat customer revenue, etc. Formulating a presentation can take up a lot of effort and time, so the content and message should always be the primary focus. The visuals of the PowerPoint can enhance the presenters message, so our Retargeting Strategies To Improve Sales Impact Of Retargeting Campaign On Conversion Designs PDF was created to help save time. Instead of worrying about the design, the presenter can concentrate on the message while our designers work on creating the ideal templates for whatever situation is needed. Slidegeeks has experts for everything from amazing designs to valuable content, we have put everything into Retargeting Strategies To Improve Sales Impact Of Retargeting Campaign On Conversion Designs PDF.

Yearly Sales Assessment With Key Performance Indicator Matrix Introduction PDF
This slide covers quarterly product units sold through out a financial year in an organization with growth in revenue, profit and number of customer from previous years sales. It includes product sold and growth rate. Presenting Yearly Sales Assessment With Key Performance Indicator Matrix Introduction PDF to dispense important information. This template comprises four stages. It also presents valuable insights into the topics including Sold Growth Rate, Customers, Growth In Profit. This is a completely customizable PowerPoint theme that can be put to use immediately. So, download it and address the topic impactfully.
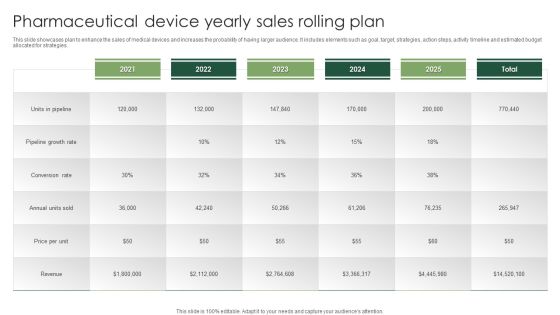
Pharmaceutical Device Yearly Sales Rolling Plan Mockup PDF
This slide showcases plan to enhance the sales of medical devices and increases the probability of having larger audience. It includes elements such as goal, target, strategies, action steps, activity timeline and estimated budget allocated for strategies. Showcasing this set of slides titled Pharmaceutical Device Yearly Sales Rolling Plan Mockup PDF. The topics addressed in these templates are Pipeline Growth Rate, Conversion Rate. All the content presented in this PPT design is completely editable. Download it and make adjustments in color, background, font etc. as per your unique business setting.

Various Kpis Included In Performance Sales Report Graphics PDF
The slide covers the key performance indicators of a report to measure product sales. Various KPIs included are conversion rate, referrals and customer lifetime value. Persuade your audience using this Various Kpis Included In Performance Sales Report Graphics PDF. This PPT design covers three stages, thus making it a great tool to use. It also caters to a variety of topics including Conversion Rate, Referrals, Customer Lifetime Value. Download this PPT design now to present a convincing pitch that not only emphasizes the topic but also showcases your presentation skills.
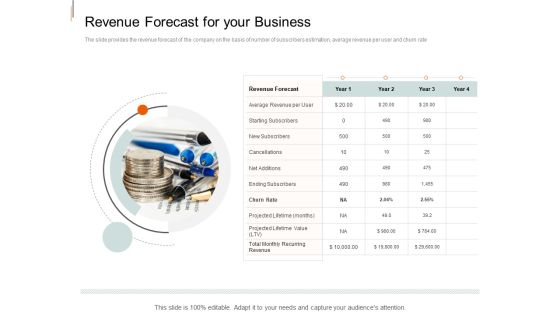
Equity Crowd Investing Revenue Forecast For Your Business Ppt Summary Tips PDF
The slide provides the revenue forecast of the company on the basis of number of subscribers estimation, average revenue per user and churn rate. Presenting equity crowd investing revenue forecast for your business ppt summary tips pdf to provide visual cues and insights. Share and navigate important information on four stages that need your due attention. This template can be used to pitch topics like revenue forecast your business, revenue forecast, churn rate. In addtion, this PPT design contains high-resolution images, graphics, etc, that are easily editable and available for immediate download.

Investor Pitch Deck To Collect Capital From Subordinated Loan Revenue Forecast By Subscribers Slides PDF
The slide provides the revenue forecast of the company on the basis of number of subscribers estimation, average revenue per user and churn rate. Deliver and pitch your topic in the best possible manner with this investor pitch deck to collect capital from subordinated loan revenue forecast by subscribers slides pdf. Use them to share invaluable insights on average revenue per user, cancellations, churn rate, total recurring revenue, projected lifetime value and impress your audience. This template can be altered and modified as per your expectations. So, grab it now.

Upgrade Management Of Complex Business Associates Current Issues Faced By Our Business Ideas PDF
This slide covers the current issues faced by our company based on profit margin earned and customer churn rate. The competitor analysis will help us to evaluate our situation in the current market. Deliver an awe inspiring pitch with this creative upgrade management of complex business associates current issues faced by our business ideas pdf bundle. Topics like churn rate, customers lost, revenue lost, profit margin can be discussed with this completely editable template. It is available for immediate download depending on the needs and requirements of the user.

Key Metrics For Client Engagement Loyalty Program Microsoft PDF
This slide shows key metrics to measure customer loyalty program . It includes factors such as retention rate, negative churn, promoter score, and effort score. Persuade your audience using this Key Metrics For Client Engagement Loyalty Program Microsoft PDF. This PPT design covers four stages, thus making it a great tool to use. It also caters to a variety of topics including Retention Rate, Negative Churn, Promoter Score, Effort Score. Download this PPT design now to present a convincing pitch that not only emphasizes the topic but also showcases your presentation skills.

Customer Support Team Web Based Platform Dashboard Demonstration PDF
This slide showcases consumer service team web panel dashboard. It provides information about average customer health, churn rate, lifetime value, net promoter score, first call resolution FCR, etc. Pitch your topic with ease and precision using this Customer Support Team Web Based Platform Dashboard Demonstration PDF. This layout presents information on Churn Rate, Lifetime Value, Customer Health Score. It is also available for immediate download and adjustment. So, changes can be made in the color, design, graphics or any other component to create a unique layout.

Current User Statistics Of The Company Before Offline Marketing Strategies Implementation Inspiration PDF
This slide shows the current user statistics of the company before adopting Offline Marketing Strategies. These stats are related to sales revenue, churn rate, offline conversion rate, offline marketing ROI, customer satisfaction etc. from the years 2019 to 2021 along with key takeaways.Deliver an awe inspiring pitch with this creative current user statistics of the company before offline marketing strategies implementation inspiration pdf bundle. Topics like offline conversion, customer satisfaction, overall company sales can be discussed with this completely editable template. It is available for immediate download depending on the needs and requirements of the user.
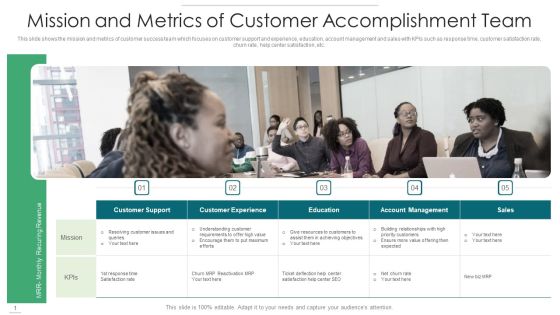
Mission And Metrics Of Customer Accomplishment Team Demonstration PDF
This slide shows the mission and metrics of customer success team which focuses on customer support and experience, education, account management and sales with KPIs such as response time, customer satisfaction rate, churn rate, help center satisfaction, etc. Presenting mission and metrics of customer accomplishment team demonstration pdf to dispense important information. This template comprises five stages. It also presents valuable insights into the topics including customer support, customer experience, education, account management, sales. This is a completely customizable PowerPoint theme that can be put to use immediately. So, download it and address the topic impactfully.
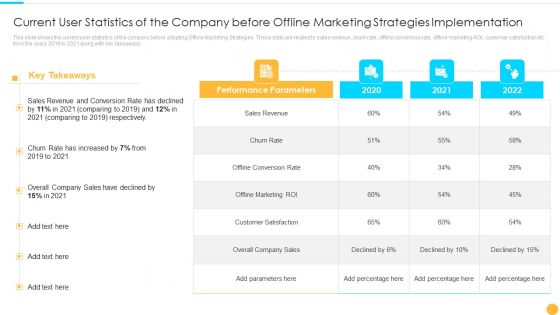
Current User Statistics Of The Company Before Offline Categories Of Offline Promotion Methods Microsoft PDF
This slide shows the current user statistics of the company before adopting Offline Marketing Strategies. These stats are related to sales revenue, churn rate, offline conversion rate, offline marketing ROI, customer satisfaction etc. from the years 2019 to 2021 along with key takeaways. Deliver and pitch your topic in the best possible manner with this current user statistics of the company before offline categories of offline promotion methods microsoft pdf. Use them to share invaluable insights on revenue, sales, marketing and impress your audience. This template can be altered and modified as per your expectations. So, grab it now.

Recurring Income Generation Model Key Metrices For Revenue Model Pictures PDF
The purpose of the following slide is to compare various revenue models based on different metrices such as Annual recurring revenue, Average revenue per unit, customer conversion rate, customer net profitability and customer churn rate. This Recurring Income Generation Model Key Metrices For Revenue Model Pictures PDF is perfect for any presentation, be it in front of clients or colleagues. It is a versatile and stylish solution for organizing your meetings. The Recurring Income Generation Model Key Metrices For Revenue Model Pictures PDF features a modern design for your presentation meetings. The adjustable and customizable slides provide unlimited possibilities for acing up your presentation. Slidegeeks has done all the homework before launching the product for you. So, do not wait, grab the presentation templates today

Saas Continuous Income Generation Model For Software Startup Key Metrices For Revenue Model Introduction PDF
The purpose of the following slide is to compare various revenue models based on different metrices such as Annual recurring revenue, Average revenue per unit, customer conversion rate, customer net profitability and customer churn rate. This modern and well arranged Saas Continuous Income Generation Model For Software Startup Key Metrices For Revenue Model Introduction PDF provides lots of creative possibilities. It is very simple to customize and edit with the Powerpoint Software. Just drag and drop your pictures into the shapes. All facets of this template can be edited with Powerpoint no extra software is necessary. Add your own material, put your images in the places assigned for them, adjust the colors, and then you can show your slides to the world, with an animated slide included.
How To Administer Accounts To Increase Sales Revenue Impact Of Successful Implementation Icons PDF
The successful implementation of effective account management results in improved marketing contribution to revenue, better customer retention rate, decrease in customer acquisition cost. Deliver an awe inspiring pitch with this creative how to administer accounts to increase sales revenue impact of successful implementation icons pdf bundle. Topics like cost, customer, revenue, marketing can be discussed with this completely editable template. It is available for immediate download depending on the needs and requirements of the user.

Swot Analysis Of Ibn Outsourcing Company Threats Ppt Inspiration Format Ideas PDF
This slide shows some threats that may effect the company in future course of time and impact the company profits. Some potential threats are Intense Competition , Declining Customer Retention Rate, Government Regulations and Political Instability etc. Presenting swot analysis of ibn outsourcing company threats ppt inspiration format ideas pdf. to provide visual cues and insights. Share and navigate important information on four stages that need your due attention. This template can be used to pitch topics like intense competition, high customer attrition rate, government regulations and political instability, threat. In addtion, this PPT design contains high resolution images, graphics, etc, that are easily editable and available for immediate download.

SWOT Analysis Of IBN Outsourcing Company Threats Clipart PDF
This slide shows some threats that may effect the company in future course of time and impact the company profits. Some potential threats are Intense Competition , Declining Customer Retention Rate, Government Regulations and Political Instability etc.This is a swot analysis of ibn outsourcing company threats clipart pdf. template with various stages. Focus and dispense information on one stage using this creative set, that comes with editable features. It contains large content boxes to add your information on topics like government regulations and political instability, high customer attrition rate. You can also showcase facts, figures, and other relevant content using this PPT layout. Grab it now.

Strategies To Enhance Recruitment Comparative Assessment Of Recruitment Process Metrics Summary PDF
This slide shows the comparative assessment of recruitment process metrics which includes time to hire new candidate, first-year attrition, offer acceptance rate, applicants per opening, etc. This is a Strategies To Enhance Recruitment Comparative Assessment Of Recruitment Process Metrics Summary PDF template with various stages. Focus and dispense information on two stages using this creative set, that comes with editable features. It contains large content boxes to add your information on topics like Industry Benchmark, Offer Acceptance Rate, Applicants Per Opening. You can also showcase facts, figures, and other relevant content using this PPT layout. Grab it now.
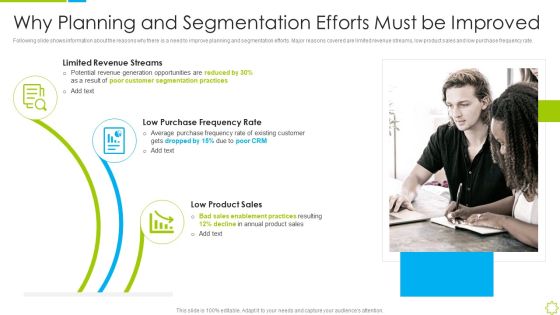
Launch New Sales Enablement Program Lead Generation Why Planning And Segmentation Rules PDF
Following slide shows information about the reasons why there is a need to improve planning and segmentation efforts. Major reasons covered are limited revenue streams, low product sales and low purchase frequency rate. This is a launch new sales enablement program lead generation why planning and segmentation rules pdf template with various stages. Focus and dispense information on three stages using this creative set, that comes with editable features. It contains large content boxes to add your information on topics like limited revenue streams, low purchase frequency rate, low product sales . You can also showcase facts, figures, and other relevant content using this PPT layout. Grab it now.

Go To Market Approach For New Product Dashboard To Measure Sales Rep Performance Formats PDF
This slide illustrates sales representative performance measurement dashboard with key metrics such as average first contact resolution rate, occupancy rate, NPS and top agents by solved tickets.Deliver and pitch your topic in the best possible manner with this Go To Market Approach For New Product Dashboard To Measure Sales Rep Performance Formats PDF Use them to share invaluable insights on Dashboard To Measure Sales Rep Performance and impress your audience. This template can be altered and modified as per your expectations. So, grab it now.

Creating New Product Launch Campaign Strategy Dashboard To Measure Sales Rep Performance Introduction PDF
This slide illustrates sales representative performance measurement dashboard with key metrics such as average first contact resolution rate, occupancy rate, NPS and top agents by solved tickets. Make sure to capture your audiences attention in your business displays with our gratis customizable Creating New Product Launch Campaign Strategy Dashboard To Measure Sales Rep Performance Introduction PDF. These are great for business strategies, office conferences, capital raising or task suggestions. If you desire to acquire more customers for your tech business and ensure they stay satisfied, create your own sales presentation with these plain slides.

Launch New Sales Enablement Program Lead Generation Why Planning And Segmentation Graphics PDF
Following slide shows information about the reasons why there is a need to improve planning and segmentation efforts. Major reasons covered are limited revenue streams, low product sales and low purchase frequency rate. Presenting launch new sales enablement program lead generation why planning and segmentation graphics pdf to provide visual cues and insights. Share and navigate important information on three stages that need your due attention. This template can be used to pitch topics like revenue streams, purchase frequency rate, low product. In addtion, this PPT design contains high resolution images, graphics, etc, that are easily editable and available for immediate download.

Retail Outlet Operational Efficiency Analytics Key Challenges Of Retail Store Sales And Marketing Mockup PDF
This slide provides information regarding challenges of retail store sales and marketing operations such as the drop in visitors footfall, poor customer retention rate, limited social media presence, limited shelf space, etc. This is a Retail Outlet Operational Efficiency Analytics Key Challenges Of Retail Store Sales And Marketing Mockup PDF template with various stages. Focus and dispense information on four stages using this creative set, that comes with editable features. It contains large content boxes to add your information on topics like Drop Visitors Footfall, Poor Customer, Retention Rate. You can also showcase facts, figures, and other relevant content using this PPT layout. Grab it now.

Companys Financial Comparison Before And After Client Acquisition Techniques To Boost Sales Slides PDF
This slide shows the comparison of companys performance before and after the product marketing strategy implementation. It shows the comparison based on parameters such as product demand, number of product sold, total sale, lead conversion rate, customer retention rate, per customer acquisition cost etc. Find a pre-designed and impeccable Companys Financial Comparison Before And After Client Acquisition Techniques To Boost Sales Slides PDF. The templates can ace your presentation without additional effort. You can download these easy-to-edit presentation templates to make your presentation stand out from others. So, what are you waiting for Download the template from Slidegeeks today and give a unique touch to your presentation.

Business Connection Network Company Outline Sales Solution Clients And Stats Themes PDF
The slide highlights LinkedIn Corporations sales solution clients. It depicts key stats for client firms which includes deals closed, win rates, pipeline influence and response rate. The best PPT templates are a great way to save time, energy, and resources. Slidegeeks have 100 percent editable powerpoint slides making them incredibly versatile. With these quality presentation templates, you can create a captivating and memorable presentation by combining visually appealing slides and effectively communicating your message. Download Business Connection Network Company Outline Sales Solution Clients And Stats Themes PDF from Slidegeeks and deliver a wonderful presentation.

Online Marketing Tactics To Enhance Sales Metrics To Measure Impact Of Social Media Strategy Background PDF
This slide focuses on metrics to measure impact of social media strategy which includes social reach, engagement per post, conversion rate, customer retention, return on investments, website traffic, etc. Deliver and pitch your topic in the best possible manner with this Online Marketing Tactics To Enhance Sales Metrics To Measure Impact Of Social Media Strategy Background PDF. Use them to share invaluable insights on Social Reach, Engagement Per Post, Conversion Rate, Customer Retention and impress your audience. This template can be altered and modified as per your expectations. So, grab it now.

Neuromarketing Strategy Training Courses For Improving Business Sales Ppt Styles Design Templates PDF
Following slide includes various neuromarketing courses with can be used by marketers to increase organization profitability. It includes key elements such as courses, description, timeframe, rating, cost and platforms. Showcasing this set of slides titled Neuromarketing Strategy Training Courses For Improving Business Sales Ppt Styles Design Templates PDF. The topics addressed in these templates are Courses, Timeframe, Rating, Cost, Platform. All the content presented in this PPT design is completely editable. Download it and make adjustments in color, background, font etc. as per your unique business setting.

Business Opportunity Dashboard With Customer Metrics Information PDF
This Slide illustrates market opportunity dashboard with customer metrics which contains favorable net promoter score NPS, standard customers, growth rate, cumulative average of customer location, net income vs projection, customer distribution, sales by representatives, etc. Pitch your topic with ease and precision using this Business Opportunity Dashboard With Customer Metrics Information PDF. This layout presents information on Customer Distribution, Growth Rate, Top Customers Locations. It is also available for immediate download and adjustment. So, changes can be made in the color, design, graphics or any other component to create a unique layout.

Process Enhancement Plan To Boost Sales Performance Gap Analysis Of Actual Vs Desired Business Performance Download PDF
This slide illustrates gap analysis of organizational current and target state to develop action plan for filling performance gaps. It provides information about qualified leads, sales win rates, business profits and customer satisfaction rate. The best PPT templates are a great way to save time, energy, and resources. Slidegeeks have 100 percent editable powerpoint slides making them incredibly versatile. With these quality presentation templates, you can create a captivating and memorable presentation by combining visually appealing slides and effectively communicating your message. Download Process Enhancement Plan To Boost Sales Performance Gap Analysis Of Actual Vs Desired Business Performance Download PDF from Slidegeeks and deliver a wonderful presentation.

Subordinated Loan Funding Number Of Subscribershistorical And Forecasted Ppt Gallery Display PDF
The slide provides the table of End Subscribers historical and forecasted on the basis of various factors including churn rate. New addition of subscribers, cancelled subscription etc. Deliver an awe-inspiring pitch with this creative subordinated loan funding number of subscribershistorical and forecasted ppt gallery display pdf. bundle. Topics like headings, new subscribers, cancelled subscriptions, net addition, retention rate, end subscribers, net addition, can be discussed with this completely editable template. It is available for immediate download depending on the needs and requirements of the user.
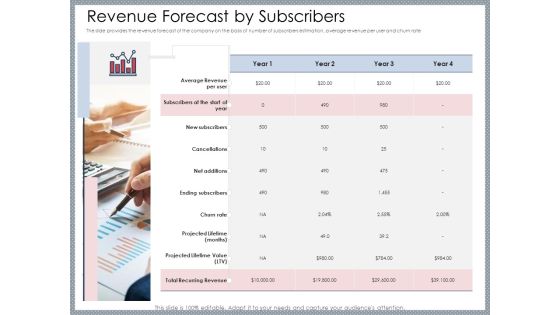
Mezzanine Venture Capital Funding Pitch Deck Revenue Forecast By Subscribers Ideas PDF
The slide provides the revenue forecast of the company on the basis of number of subscribers estimation, average revenue per user and churn rate. This is a mezzanine venture capital funding pitch deck revenue forecast by subscribers ideas pdf template with various stages. Focus and dispense information on one stages using this creative set, that comes with editable features. It contains large content boxes to add your information on topics like revenue, subscribers, user, rate, lifetime. You can also showcase facts, figures, and other relevant content using this PPT layout. Grab it now.

Mezzanine Debt Financing Pitch Deck Revenue Forecast By Subscribers Demonstration PDF
The slide provides the revenue forecast of the company on the basis of number of subscribers estimation, average revenue per user and churn rate. This is a mezzanine debt financing pitch deck revenue forecast by subscribers demonstration pdf template with various stages. Focus and dispense information on one stage using this creative set, that comes with editable features. It contains large content boxes to add your information on topics like projected, revenue, rate. You can also showcase facts, figures, and other relevant content using this PPT layout. Grab it now.

Investor Funding Deck For Hybrid Financing Number Of Subscribers Historical And Forecasted Guidelines PDF
The slide provides the table of End Subscribers historical and forecasted on the basis of various factors including churn rate. New addition of subscribers, cancelled subscription etc. Deliver and pitch your topic in the best possible manner with this investor funding deck for hybrid financing number of subscribers historical and forecasted guidelines pdf. Use them to share invaluable insights on subscriber year, new subscribers, cancelled subscriptions, retention rate, net addition and impress your audience. This template can be altered and modified as per your expectations. So, grab it now.
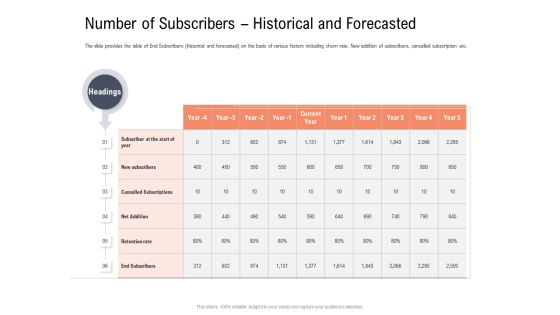
Investor Pitch Deck To Collect Capital From Subordinated Loan Number Of Subscribers Historical And Forecasted Graphics PDF
The slide provides the table of End Subscribers historical and forecasted on the basis of various factors including churn rate. New addition of subscribers, cancelled subscription etc. Deliver an awe-inspiring pitch with this creative investor pitch deck to collect capital from subordinated loan number of subscribers historical and forecasted graphics pdf bundle. Topics like new subscribers, retention rate, end subscribers, cancelled subscriptions can be discussed with this completely editable template. It is available for immediate download depending on the needs and requirements of the user.

Investor Pitch Deck To Generate Capital From Initial Currency Offering Number Of Subscribers Historical And Forecasted Infographics PDF
The slide provides the table of End Subscribers historical and forecasted on the basis of various factors including churn rate, new addition of subscribers, cancelled subscription etc. Deliver and pitch your topic in the best possible manner with this investor pitch deck to generate capital from initial currency offering number of subscribers historical and forecasted infographics pdf. Use them to share invaluable insights on cancelled subscriptions, retention rate, end subscribers and impress your audience. This template can be altered and modified as per your expectations. So, grab it now.

Estimated Five Year Targets Of CNN E Commerce Company Graphics PDF
This slide shows the estimated future trends of CNN E Commerce Company for 5 years after the implementation of Strategies. These targets are related to Company Revenue, Customer Churn Rate, Customer Repeat Order Rate, Net Promoter Score etc. Deliver and pitch your topic in the best possible manner with this estimated five year targets of CNN e commerce company graphics pdf. Use them to share invaluable insights on net promoter score, 2019 to 2023 and impress your audience. This template can be altered and modified as per your expectations. So, grab it now.
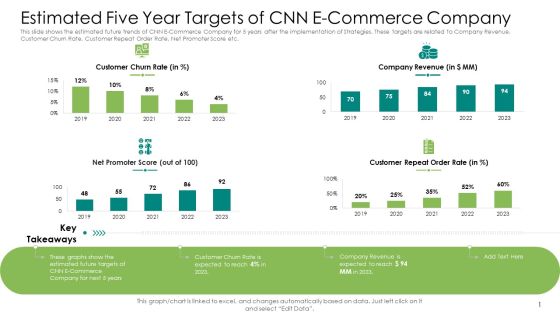
Estimated Five Year Targets Of CNN E Commerce Company Background PDF
This slide shows the estimated future trends of CNN E Commerce Company for 5 years after the implementation of Strategies. These targets are related to Company Revenue, Customer Churn Rate, Customer Repeat Order Rate, Net Promoter Score etc. Deliver and pitch your topic in the best possible manner with this estimated five year targets of CNN e commerce company background pdf. Use them to share invaluable insights on net promoter score, 2019 to 2023 and impress your audience. This template can be altered and modified as per your expectations. So, grab it now.
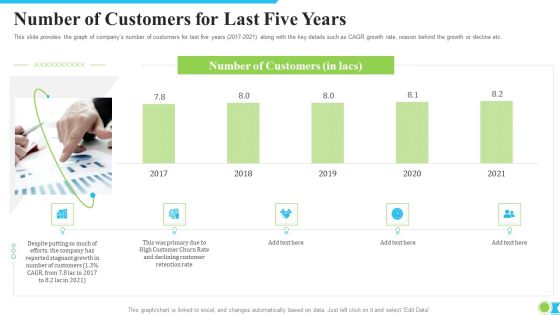
Number Of Customers For Last Five Years Ppt Slides PDF
This slide provides the graph of companys number of customers for last five years 2017 2021 along with the key details such as CAGR growth rate, reason behind the growth or decline etc. Deliver and pitch your topic in the best possible manner with this number of customers for last five years ppt slides pdf. Use them to share invaluable insights on declining customer, high customer churn rate, stagnant growth and impress your audience. This template can be altered and modified as per your expectations. So, grab it now.

Agile Group For Product Development Metrics Used By Product Leader To Measure Performance Designs PDF
This slide focuses on metrics used by product leader to measure performance such as net promoter score, feature adoption, retention rate, churn rate, customer satisfaction, stickiness, etc. Deliver an awe inspiring pitch with this creative agile group for product development metrics used by product leader to measure performance designs pdf bundle. Topics like quantifies customer happiness with product, customers that leave over certain period, customer satisfaction can be discussed with this completely editable template. It is available for immediate download depending on the needs and requirements of the user.

Assuring Management In Product Innovation To Enhance Processes Metrics Used By Product Leader To Measure Performance Diagrams PDF
This slide focuses on metrics used by product leader to measure performance such as net promoter score, feature adoption, retention rate, churn rate, customer satisfaction, stickiness, etc.Presenting assuring management in product innovation to enhance processes metrics used by product leader to measure performance diagrams pdf to provide visual cues and insights. Share and navigate important information on one stage that need your due attention. This template can be used to pitch topics like percentage of fulfilling, customers that leave, quantifies customer happiness In addtion, this PPT design contains high resolution images, graphics, etc, that are easily editable and available for immediate download.

Annual Business Revenue Predictive With Subscriber Details Ppt Summary Designs PDF
The following slide highlights the annual business revenue forecast with subscriber details illustrating key headings which includes key headings monthly visitor growth rate, visitor, signups, new paying customer, customer churn, net paying customer and total revenue. Showcasing this set of slides titled annual business revenue predictive with subscriber details ppt summary designs pdf. The topics addressed in these templates are assumptions, 2020 to 2024, monthly visitor growth rate. All the content presented in this PPT design is completely editable. Download it and make adjustments in color, background, font etc. as per your unique business setting.
Performance Tracking Kpis For 3 Stage App Marketing Plan Pictures PDF
This slide showcases app launch success metrics such as beta testing, deadline for creating landing page, application downloads, daily active users, monthly active users, app store rating, retention rate, churn ratio, etc.Presenting Performance Tracking Kpis For 3 Stage App Marketing Plan Pictures PDF to dispense important information. This template comprises three stages. It also presents valuable insights into the topics including Pre Launch Stage, Launch Stage, Post Launch Stage. This is a completely customizable PowerPoint theme that can be put to use immediately. So, download it and address the topic impactfully.
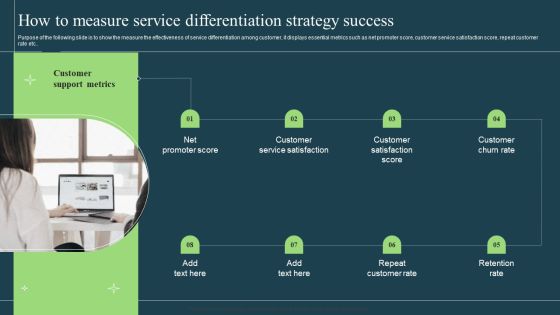
Differentiation Techniques Ways To Surpass Competitors How To Measure Service Differentiation Strategy Success Introduction PDF
Purpose of the following slide is to show the measure the effectiveness of service differentiation among customer, it displays essential metrics such as net promoter score, customer service satisfaction score, repeat customer. This is a Differentiation Techniques Ways To Surpass Competitors How To Measure Service Differentiation Strategy Success Introduction PDF template with various stages. Focus and dispense information on eight stages using this creative set, that comes with editable features. It contains large content boxes to add your information on topics like Customer Service Satisfaction, Customer Churn Rate, Retention Rate. You can also showcase facts, figures, and other relevant content using this PPT layout. Grab it now.

Web Usage Analysis Summary Dashboard To Track Performance Background PDF
This slide covers website usage analytics report for tracking performs. It involves all details about number of visitors, leads, consumer, major landing pages and average revenue per consumer. Showcasing this set of slides titled Web Usage Analysis Summary Dashboard To Track Performance Background PDF. The topics addressed in these templates are Customer Churn Rate, Bounce Rate, Monthly Recurring Revenue. All the content presented in this PPT design is completely editable. Download it and make adjustments in color, background, font etc. as per your unique business setting.

Landing Page Leads And Revenue Generation Analytics For User Experience Optimization Dashboard Formats PDF
This slide covers website analytics based on revenue earned. It also included leads generated, bounce rates, customer churn stats, annual and monthly recurring revenue, etc. Pitch your topic with ease and precision using this Landing Page Leads And Revenue Generation Analytics For User Experience Optimization Dashboard Formats PDF. This layout presents information on Monthly Recurring Revenue, Bounce Rate, Gross Volume. It is also available for immediate download and adjustment. So, changes can be made in the color, design, graphics or any other component to create a unique layout.

Business Customer Incident Management Dashboard Background PDF
The following slide showcases customer management dashboard to retain and attract customers. It includes problems resolved and logged. It also includes CSAT, net promoter score, FCR, CRR and churn rate. Showcasing this set of slides titled Business Customer Incident Management Dashboard Background PDF. The topics addressed in these templates are Customer Satisfaction Rate, Net Promoter Score, First Contact Resolution. All the content presented in this PPT design is completely editable. Download it and make adjustments in color, background, font etc. as per your unique business setting.

Customer Lifetime Value Based Success KPIS Dashboard Ppt PowerPoint Presentation Layouts Gridlines PDF
This slide covers dashboard for estimation of customer lifetime value as success metrics. It includes KPIs such as customer lifetime value, customer lifetime period, customer risk, customer contact rate, customer retention costs, average lifetime value, customer churn rate, average revenue per account, etc. Pitch your topic with ease and precision using this Customer Lifetime Value Based Success KPIS Dashboard Ppt PowerPoint Presentation Layouts Gridlines PDF. This layout presents information on Average Revenue, Customer Lifetime, Customer Risk. It is also available for immediate download and adjustment. So, changes can be made in the color, design, graphics or any other component to create a unique layout.

Competitor Analysis Grid Of E-Commerce Firms Professional PDF
This slide showcases comparison of e-commerce firms on the basis of performance indicators. The KPIs included are revenue, churn, conversion and bounce rate, average order value and website traffic.Pitch your topic with ease and precision using this Competitor Analysis Grid Of E-Commerce Firms Professional PDF. This layout presents information on Website Traffic, Conversion Rate, Website Traffic. It is also available for immediate download and adjustment. So, changes can be made in the color, design, graphics or any other component to create a unique layout.

Customer Relationship Management Performance Gap Assessment Template PDF
This slide represents the gap analysis of customer relationship management. The purpose of this slide is to demonstrate methods to increase customer interactions with the business. The key components include net promoter score, churn rate, upsell rate, the average time to resolution, and so on. Showcasing this set of slides titled Customer Relationship Management Performance Gap Assessment Template PDF. The topics addressed in these templates are Customer Service, Website Performance, Organize Training Programs. All the content presented in this PPT design is completely editable. Download it and make adjustments in color, background, font etc. as per your unique business setting.

Membership Based Revenue Plan Key Metrices For Revenue Model Inspiration PDF
The purpose of the following slide is to compare various revenue models based on different metrices such as Annual recurring revenue, Average revenue per unit, customer conversion rate, customer net profitability and customer churn rate. If your project calls for a presentation, then Slidegeeks is your go-to partner because we have professionally designed, easy-to-edit templates that are perfect for any presentation. After downloading, you can easily edit Membership Based Revenue Plan Key Metrices For Revenue Model Inspiration PDF and make the changes accordingly. You can rearrange slides or fill them with different images. Check out all the handy templates

 Home
Home