Transformation Plan
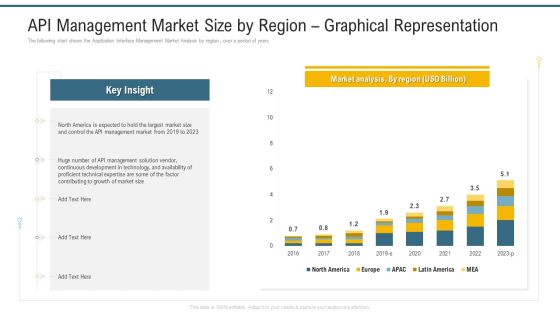
API Management Market Size By Region Graphical Representation Ppt Layouts Visuals PDF
The following chart shows the Application Interface Management Market Analysis by region , over a period of years. Deliver and pitch your topic in the best possible manner with this api management market size by region graphical representation ppt layouts visuals pdf. Use them to share invaluable insights on development in technology, growth of market size, management market and impress your audience. This template can be altered and modified as per your expectations. So, grab it now.

Monthly Company Performance Analysiscompetitor Analysis Pictures PDF
This graph or chart is linked to excel, and changes automatically based on data. Just left click on it and select Edit Data. Deliver and pitch your topic in the best possible manner with this monthly company performance analysiscompetitor analysis pictures pdf. Use them to share invaluable insights on revenue, competitor analysis and impress your audience. This template can be altered and modified as per your expectations. So, grab it now.
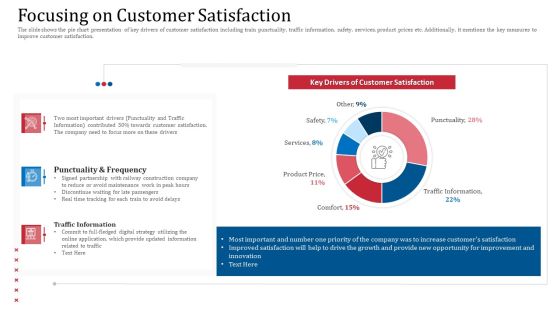
Focusing On Customer Satisfaction Background PDF
The slide shows the pie chart presentation of key drivers of customer satisfaction including train punctuality, traffic information, safety, services, product prices etc. Additionally, it mentions the key measures to improve customer satisfaction.Deliver and pitch your topic in the best possible manner with this focusing on customer satisfaction background pdf. Use them to share invaluable insights on punctuality and frequency, traffic information, updated information and impress your audience. This template can be altered and modified as per your expectations. So, grab it now.

Application Development Best Practice Tools And Templates Jira Dashboard For Software Teams Progress Microsoft PDF
This slide covers the software teams progress through JIRA dashboard which focuses on pie chart, sprint health dashboard and assigned task details. Deliver and pitch your topic in the best possible manner with this application development best practice tools and templates jira dashboard for software teams progress microsoft pdf. Use them to share invaluable insights on improvement, travel provider, initiative, task and impress your audience. This template can be altered and modified as per your expectations. So, grab it now.
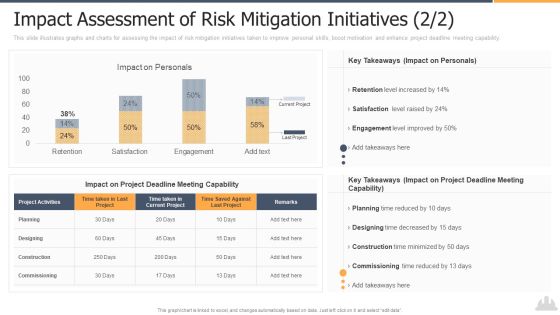
Impact Assessment Of Risk Mitigation Initiatives 2 2 Infographics PDF
This slide illustrates graphs and charts for assessing the impact of risk mitigation initiatives taken to improve project quality and reduce overall cost during project lifecycle. Deliver and pitch your topic in the best possible manner with this impact assessment of risk mitigation initiatives 2 2 infographics pdf. Use them to share invaluable insights on retention, satisfaction, engagement and impress your audience. This template can be altered and modified as per your expectations. So, grab it now.
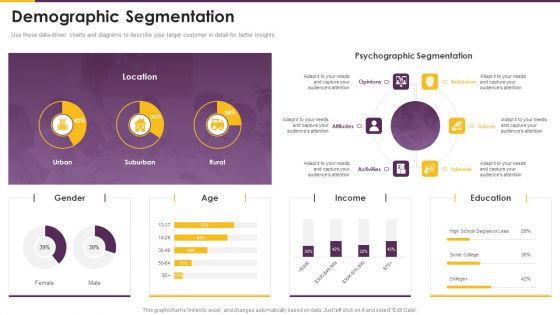
Detailed Guide Consumer Journey Marketing Demographic Segmentation Designs PDF
Use these data-driven charts and diagrams to describe your target customer in detail for better insights. Deliver and pitch your topic in the best possible manner with this detailed guide consumer journey marketing demographic segmentation designs pdf. Use them to share invaluable insights on demographic segmentation and impress your audience. This template can be altered and modified as per your expectations. So, grab it now.

Security Monitoring Dashboard With Application Control And Operating System Statistics Template PDF
This graph or chart is linked to excel, and changes automatically based on data. Just left click on it and select Edit Data. Deliver and pitch your topic in the best possible manner with this security monitoring dashboard with application control and operating system statistics template pdf. Use them to share invaluable insights on application control, restrict office macros, application patching, application hardening and impress your audience. This template can be altered and modified as per your expectations. So, grab it now.

Supplier Scorecard Retail Compliance Scorecards For Supplier With Damage Free Deliveries Status Sample PDF
This graph or chart is linked to excel, and changes automatically based on data. Just left click on it and select Edit Data. Deliver and pitch your topic in the best possible manner with this supplier scorecard retail compliance scorecards for supplier with damage free deliveries status sample pdf. Use them to share invaluable insights on damage free deliveries, arrival reporting, departure reporting and impress your audience. This template can be altered and modified as per your expectations. So, grab it now.

Supplier Scorecard Retail Supplier Scorecard For Evaluating Risk Compliance Clipart PDF
This graph or chart is linked to excel, and changes automatically based on data. Just left click on it and select Edit Data. Deliver and pitch your topic in the best possible manner with this supplier scorecard retail supplier scorecard for evaluating risk compliance clipart pdf. Use them to share invaluable insights on risk summary, risk category, vendors evaluated, low, medium, high and impress your audience. This template can be altered and modified as per your expectations. So, grab it now.
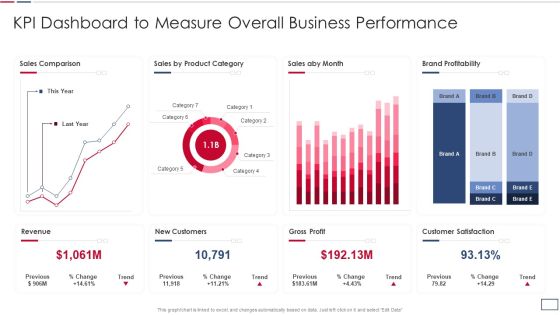
Software Developer Playbook Kpi Dashboard To Measure Overall Business Performance Topics PDF
This graph or chart is linked to excel, and changes automatically based on data. Just left click on it and select Edit Data. Deliver and pitch your topic in the best possible manner with this software developer playbook kpi dashboard to measure overall business performance topics pdf. Use them to share invaluable insights on revenue new customers, gross profit, customer satisfaction, sales comparison and impress your audience. This template can be altered and modified as per your expectations. So, grab it now.

Sales Forecasting For Online Branding Agency Investor Funding Elevator Pitch Deck Rules PDF
Purpose of the following slide is to show the total amount of funds required by the organization , the provided pie chart displays the utilization of these funds. Deliver and pitch your topic in the best possible manner with this sales forecasting for online branding agency investor funding elevator pitch deck rules pdf. Use them to share invaluable insights on growth, organization and impress your audience. This template can be altered and modified as per your expectations. So, grab it now.

Promotion Scorecard With Traffic Sources And Leads Funnel Ppt Layouts Background PDF
This graph or chart is linked to excel, and changes automatically based on data. Just left click on it and select Edit Data. Deliver and pitch your topic in the best possible manner with this promotion scorecard with traffic sources and leads funnel ppt layouts background pdf. Use them to share invaluable insights on lead month, lead funnel, dollar, traffic sources and impress your audience. This template can be altered and modified as per your expectations. So, grab it now.
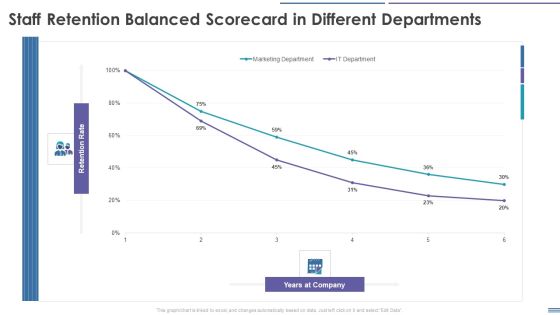
Staff Retention Balanced Scorecard Staff Retention Balanced Scorecard In Different Departments Template PDF
This graph or chart is linked to excel, and changes automatically based on data. Just left click on it and select Edit Data. Deliver and pitch your topic in the best possible manner with this Staff Retention Balanced Scorecard Staff Retention Balanced Scorecard In Different Departments Template PDF. Use them to share invaluable insights on Marketing Department, IT Department and impress your audience. This template can be altered and modified as per your expectations. So, grab it now.
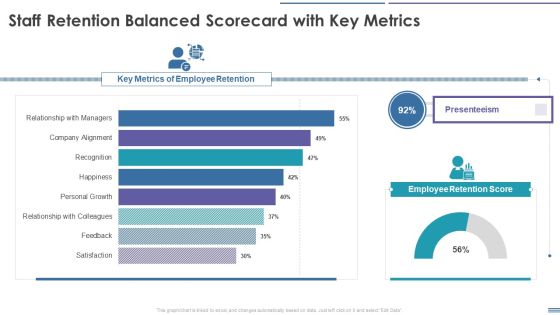
Staff Retention Balanced Scorecard Staff Retention Balanced Scorecard With Key Metrics Demonstration PDF
This graph or chart is linked to excel, and changes automatically based on data. Just left click on it and select Edit Data. Deliver and pitch your topic in the best possible manner with this Staff Retention Balanced Scorecard Staff Retention Balanced Scorecard With Key Metrics Demonstration PDF. Use them to share invaluable insights on Key Metrics Of Employee Retention, Presenteeism, Employee Retention Score and impress your audience. This template can be altered and modified as per your expectations. So, grab it now.

Why Is Agile Cost Effective IT Determining The Software Development Cost Agile Demonstration PDF
This graph or chart is linked to excel, and changes automatically based on data. Just left click on it and select Edit Data. Deliver and pitch your topic in the best possible manner with this Why Is Agile Cost Effective IT Determining The Software Development Cost Agile Demonstration PDF. Use them to share invaluable insights on Analysis And Design, Development, Project Management, Quality Assurance and impress your audience. This template can be altered and modified as per your expectations. So, grab it now.

Auto Sales Weekly Performance Assessment Scorecard Background PDF
This graph or chart is linked to excel, and changes automatically based on data. Just left click on it and select Edit Data. Deliver and pitch your topic in the best possible manner with this Auto Sales Weekly Performance Assessment Scorecard Background PDF. Use them to share invaluable insights on Auto Sales Weekly, Performance Assessment Scorecard and impress your audience. This template can be altered and modified as per your expectations. So, grab it now.

Automobile Sales Scorecard Scorecard For Global Auto Sales Themes PDF
This graph or chart is linked to excel, and changes automatically based on data. Just left click on it and select Edit Data. Deliver and pitch your topic in the best possible manner with this Automobile Sales Scorecard Scorecard For Global Auto Sales Themes PDF. Use them to share invaluable insights on Scorecard For Global, Auto Sales Global and impress your audience. This template can be altered and modified as per your expectations. So, grab it now.

Automobile Sales Scorecard Yoy Percentage Comparison For Auto Sales Icons PDF
This graph or chart is linked to excel, and changes automatically based on data. Just left click on it and select Edit Data.Deliver and pitch your topic in the best possible manner with this Automobile Sales Scorecard Yoy Percentage Comparison For Auto Sales Icons PDF. Use them to share invaluable insights on Electric Vehicle Full, Hybrid Electric Vehicle, Ybrid Electric Vehicle, 2020 TO 2021 and impress your audience. This template can be altered and modified as per your expectations. So, grab it now.

Healthcare Financial Analysis Scorecard With Outpatient Satisfaction Ppt Professional Background Image PDF
This graph or chart is linked to excel, and changes automatically based on data. Just left click on it and select Edit Data. Deliver and pitch your topic in the best possible manner with this Healthcare Financial Analysis Scorecard With Outpatient Satisfaction Ppt Professional Background Image PDF. Use them to share invaluable insights on Net Promoter Score, Outpatient Satisfaction Employee, Revenue Satisfaction Patients and impress your audience. This template can be altered and modified as per your expectations. So, grab it now.

Shipping Vendor Spend Scorecard Summary In Graph Ppt Pictures Introduction PDF
This graph or chart is linked to excel, and changes automatically based on data. Just left click on it and select Edit Data. Deliver and pitch your topic in the best possible manner with this Shipping Vendor Spend Scorecard Summary In Graph Ppt Pictures Introduction PDF. Use them to share invaluable insights on Vendor Scorecard Summary, Vendor Spend Shipping, Actual Spend Vs and impress your audience. This template can be altered and modified as per your expectations. So, grab it now.
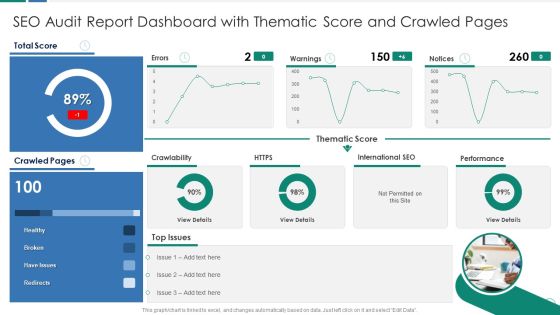
SEO Audit Report Dashboard With Thematic Score And Crawled Pages Download PDF
This graph or chart is linked to excel, and changes automatically based on data. Just left click on it and select Edit Data. Deliver and pitch your topic in the best possible manner with this SEO Audit Report Dashboard With Thematic Score And Crawled Pages Download PDF. Use them to share invaluable insights on Thematic Score Warnings, International SEO Performance, Total Score Healthy and impress your audience. This template can be altered and modified as per your expectations. So, grab it now.
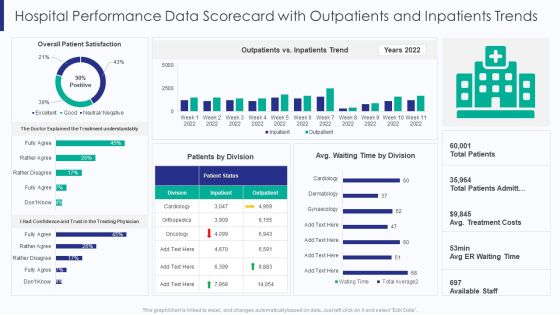
Healthcare Hospital Performance Data Scorecard With Outpatients And Inpatients Trends Ppt Summary Good PDF
This graphor chart is linked to excel, and changes automatically based on data. Just left click on it and select Edit Data. Deliver and pitch your topic in the best possible manner with this Healthcare Hospital Performance Data Scorecard With Outpatients And Inpatients Trends Ppt Summary Good PDF. Use them to share invaluable insights on Overall Patient Satisfaction, Outpatients Vs Inpatients, Trend Years 2022 and impress your audience. This template can be altered and modified as per your expectations. So, grab it now.

Healthcare Hospital Performance Data Scorecard With Patient Readmission Rate Ppt Model Objects PDF
This graphor chart is linked to excel, and changes automatically based on data. Just left click on it and select Edit Data. Deliver and pitch your topic in the best possible manner with this Healthcare Hospital Performance Data Scorecard With Patient Readmission Rate Ppt Model Objects PDF. Use them to share invaluable insights on Time To Service, Average Patient Satisfaction, Patient Readmission Rate and impress your audience. This template can be altered and modified as per your expectations. So, grab it now.

IT Security Evaluation Scorecard With Bar Graph Ppt Gallery Design Templates PDF
This graph or chart is linked to excel, and changes automatically based on data. Just left click on it and select Edit Data. Deliver and pitch your topic in the best possible manner with this IT Security Evaluation Scorecard With Bar Graph Ppt Gallery Design Templates PDF. Use them to share invaluable insights on CPU Utilization Memory, Utilization Packet Loss and impress your audience. This template can be altered and modified as per your expectations. So, grab it now.

IT Security Evaluation Scorecard With Impact Status Ppt Portfolio Guidelines PDF
This graph or chart is linked to excel, and changes automatically based on data. Just left click on it and select Edit Data. Deliver and pitch your topic in the best possible manner with this IT Security Evaluation Scorecard With Impact Status Ppt Portfolio Guidelines PDF. Use them to share invaluable insights on Device Availability Application, Performance Port Health, Devices Reference Firmware and impress your audience. This template can be altered and modified as per your expectations. So, grab it now.

IT Security Evaluation Scorecard With Ip Availability Ppt Pictures Portrait PDF
This graph or chart is linked to excel, and changes automatically based on data. Just left click on it and select Edit Data. Deliver and pitch your topic in the best possible manner with this IT Security Evaluation Scorecard With Ip Availability Ppt Pictures Portrait PDF. Use them to share invaluable insights on Devices Memory Utilization, Interfaces Errors Discards, IP Availability Summary and impress your audience. This template can be altered and modified as per your expectations. So, grab it now.
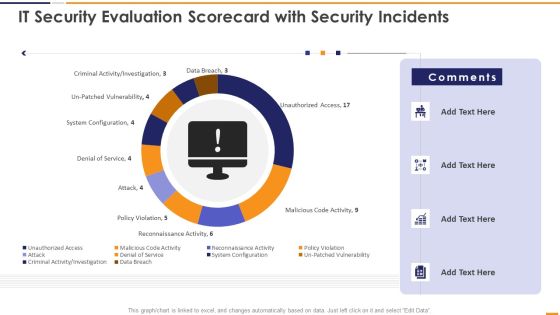
IT Security Evaluation Scorecard With Security Incidents Ppt Pictures Vector PDF
This graph or chart is linked to excel, and changes automatically based on data. Just left click on it and select Edit Data. Deliver and pitch your topic in the best possible manner with this IT Security Evaluation Scorecard With Security Incidents Ppt Pictures Vector PDF. Use them to share invaluable insights on Unauthorized Access Sales, Malicious Code Activity, Reconnaissance Activity Attack and impress your audience. This template can be altered and modified as per your expectations. So, grab it now.

IT Security Evaluation Scorecard With System Details Ppt Inspiration Vector PDF
This graph or chart is linked to excel, and changes automatically based on data. Just left click on it and select Edit Data. Deliver and pitch your topic in the best possible manner with this IT Security Evaluation Scorecard With System Details Ppt Inspiration Vector PDF. Use them to share invaluable insights on System Details Availability, System Metrics Memory, Pressure Memory Leak and impress your audience. This template can be altered and modified as per your expectations. So, grab it now.
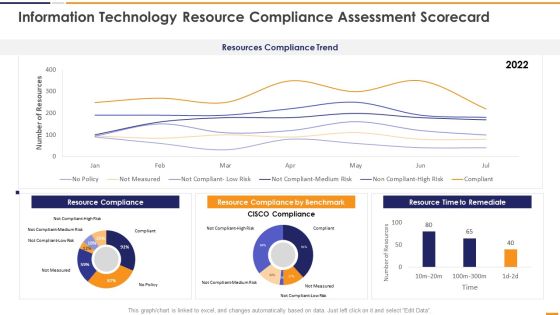
IT Security Evaluation Scorecard Information Technology Resource Compliance Background PDF
This graph or chart is linked to excel, and changes automatically based on data. Just left click on it and select Edit Data. Deliver and pitch your topic in the best possible manner with this IT Security Evaluation Scorecard Information Technology Resource Compliance Background PDF. Use them to share invaluable insights on Resources Compliance Trend, Resource Compliance 2022, Resource Compliance Benchmark, Resource Time Remediate and impress your audience. This template can be altered and modified as per your expectations. So, grab it now.
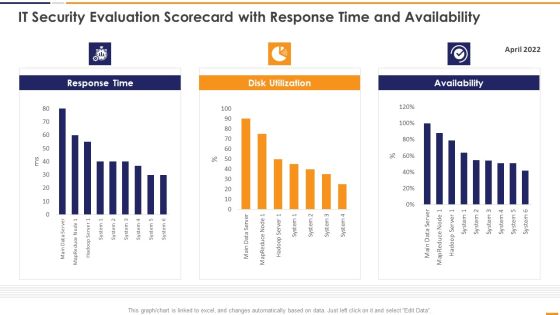
IT Security Evaluation Scorecard With Response Time And Availability Brochure PDF
This graph or chart is linked to excel, and changes automatically based on data. Just left click on it and select Edit Data. Deliver and pitch your topic in the best possible manner with this IT Security Evaluation Scorecard With Response Time And Availability Brochure PDF. Use them to share invaluable insights on Response Time 2022, Disk Utilization Availability and impress your audience. This template can be altered and modified as per your expectations. So, grab it now.

IT Security Evaluation Scorecard With Suspended Services Instance Graphics PDF
This graph or chart is linked to excel, and changes automatically based on data. Just left click on it and select Edit Data. Deliver and pitch your topic in the best possible manner with this IT Security Evaluation Scorecard With Suspended Services Instance Graphics PDF. Use them to share invaluable insights on Send Ports Alarms, Host Instance Orchestration, Receive Location Data and impress your audience. This template can be altered and modified as per your expectations. So, grab it now.
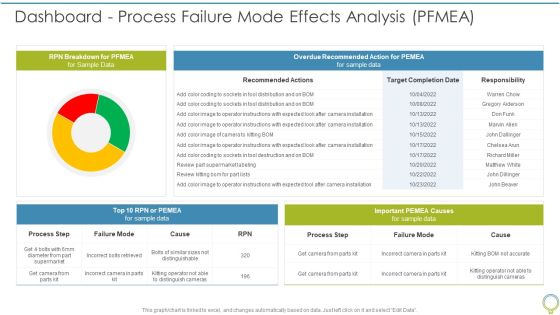
FMEA To Determine Potential Dashboard Process Failure Mode Effects Analysis PFMEA Elements PDF
This graph or chart is linked to excel, and changes automatically based on data. Just left click on it and select Edit Data. Deliver and pitch your topic in the best possible manner with this FMEA To Determine Potential Dashboard Process Failure Mode Effects Analysis PFMEA Elements PDF. Use them to share invaluable insights on RPN Breakdown, Overdue Recommended, Process Step and impress your audience. This template can be altered and modified as per your expectations. So, grab it now.

Openfin Capital Raising Understanding The Competitive Landscape Ppt Portfolio Layouts PDF
This graph or chart is linked to excel, and changes automatically based on data. Just left click on it and select Edit Data. Deliver and pitch your topic in the best possible manner with this Openfin Capital Raising Understanding The Competitive Landscape Ppt Portfolio Layouts PDF. Use them to share invaluable insights on Usage Application, Food Ordering, Food Blogging and impress your audience. This template can be altered and modified as per your expectations. So, grab it now.

Automating Key Activities Of HR Manager Impact Of Technology Acceptance On HR Functioning Slides PDF
This slide shows the pie chart that represents the impact of technology acceptance on human resource functions such as employee engagement, recruitment, talent management, etc.Deliver and pitch your topic in the best possible manner with this Automating Key Activities Of HR Manager Impact Of Technology Acceptance On HR Functioning Slides PDF Use them to share invaluable insights on Acceptance Technology, Employee Engagement, Effectiveness Recruiting and impress your audience. This template can be altered and modified as per your expectations. So, grab it now.

Company Monthly Sales Performance Scorecard With Region Sample PDF
This graph or chart is linked to excel, and changes automatically based on data. Just left click on it and select Edit Data. Deliver and pitch your topic in the best possible manner with this Company Monthly Sales Performance Scorecard With Region Sample PDF. Use them to share invaluable insights on Company Monthly, Sales Performance, Scorecard Region and impress your audience. This template can be altered and modified as per your expectations. So, grab it now.

Current Year Sales Performance Scorecard With Profits Structure PDF
This graph or chart is linked to excel, and changes automatically based on data. Just left click on it and select Edit Data. Deliver and pitch your topic in the best possible manner with this Current Year Sales Performance Scorecard With Profits Structure PDF. Use them to share invaluable insights on Current Year, YTD Sales, Previous Year and impress your audience. This template can be altered and modified as per your expectations. So, grab it now.
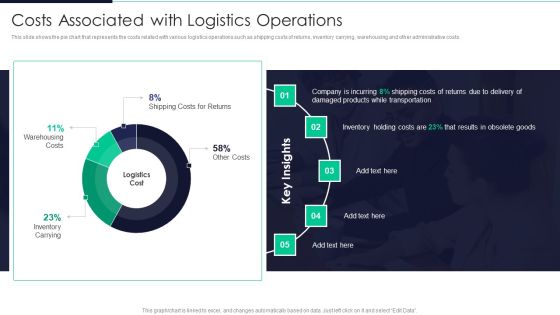
Developing Excellence In Logistics Operations Costs Associated With Logistics Operations Portrait PDF
This slide shows the pie chart that represents the costs related with various logistics operations such as shipping costs of returns, inventory carrying, warehousing and other administrative costs.Deliver and pitch your topic in the best possible manner with this Developing Excellence In Logistics Operations Costs Associated With Logistics Operations Portrait PDF Use them to share invaluable insights on Inventory Carrying, Inventory Carrying, Shipping Costs and impress your audience. This template can be altered and modified as per your expectations. So, grab it now.
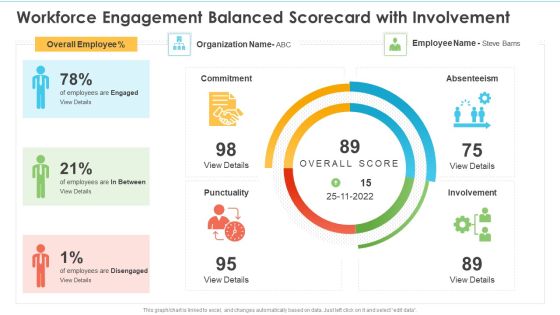
Workforce Engagement Balanced Scorecard With Involvement Ppt Portfolio Background Images PDF
This graph or chart is linked to excel, and changes automatically based on data. Just left click on it and select edit data. Deliver and pitch your topic in the best possible manner with this Workforce Engagement Balanced Scorecard With Involvement Ppt Portfolio Background Images PDF. Use them to share invaluable insights on Employee, Organization, Overall Employee and impress your audience. This template can be altered and modified as per your expectations. So, grab it now.
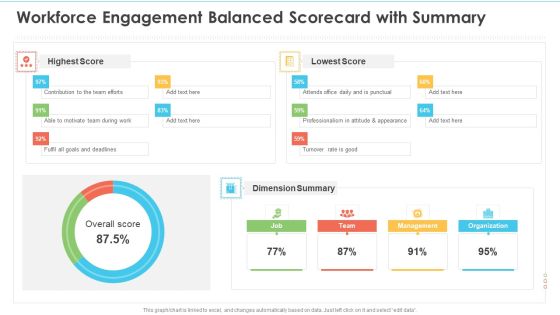
Workforce Engagement Balanced Scorecard With Summary Ppt Layouts Template PDF
This graph or chart is linked to excel, and changes automatically based on data. Just left click on it and select edit data. Deliver and pitch your topic in the best possible manner with this Workforce Engagement Balanced Scorecard With Summary Ppt Layouts Template PDF. Use them to share invaluable insights on Highest Score, Lowest Score, Dimension Summary and impress your audience. This template can be altered and modified as per your expectations. So, grab it now.

Workforce Engagement Scorecard With Net Promoter Score Ppt Portfolio Images PDF
This graph or chart is linked to excel, and changes automatically based on data. Just left click on it and select edit data. Deliver and pitch your topic in the best possible manner with this Workforce Engagement Scorecard With Net Promoter Score Ppt Portfolio Images PDF. Use them to share invaluable insights on Employee Involvement, Punctuality Involvement, Absenteeism and impress your audience. This template can be altered and modified as per your expectations. So, grab it now.

Resource Administration Accounting Scorecard With Average Purchase Cost Structure PDF
This graph or chart is linked to excel, and changes automatically based on data. Just left click on it and select Edit Data. Deliver and pitch your topic in the best possible manner with this Resource Administration Accounting Scorecard With Average Purchase Cost Structure PDF. Use them to share invaluable insights on Stock Balance, Stock Quantity, Average Cost and impress your audience. This template can be altered and modified as per your expectations. So, grab it now.

Resource Administration Accounting Scorecard With Defects And Fill Rate Mockup PDF
This graph or chart is linked to excel, and changes automatically based on data. Just left click on it and select Edit Data. Deliver and pitch your topic in the best possible manner with this Resource Administration Accounting Scorecard With Defects And Fill Rate Mockup PDF. Use them to share invaluable insights on Total Order Amount, Raw Material, Quantity Analysis and impress your audience. This template can be altered and modified as per your expectations. So, grab it now.

Resource Administration Accounting Scorecard With Inventory Summary Designs PDF
This graph or chart is linked to excel, and changes automatically based on data. Just left click on it and select Edit Data. Deliver and pitch your topic in the best possible manner with this Resource Administration Accounting Scorecard With Inventory Summary Designs PDF. Use them to share invaluable insights on Product Details, Top Selling Item, Purchase Order and impress your audience. This template can be altered and modified as per your expectations. So, grab it now.
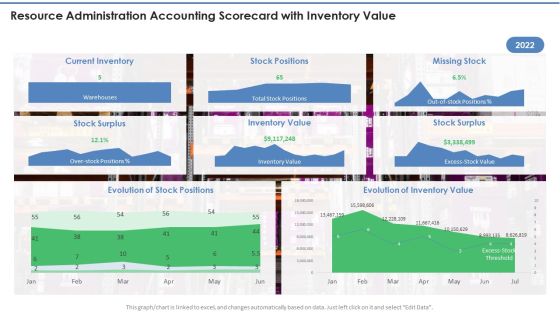
Resource Administration Accounting Scorecard With Inventory Value Infographics PDF
This graph or chart is linked to excel, and changes automatically based on data. Just left click on it and select Edit Data. Deliver and pitch your topic in the best possible manner with this Resource Administration Accounting Scorecard With Inventory Value Infographics PDF. Use them to share invaluable insights on Current Inventory, Stock Positions, Missing Stock and impress your audience. This template can be altered and modified as per your expectations. So, grab it now.
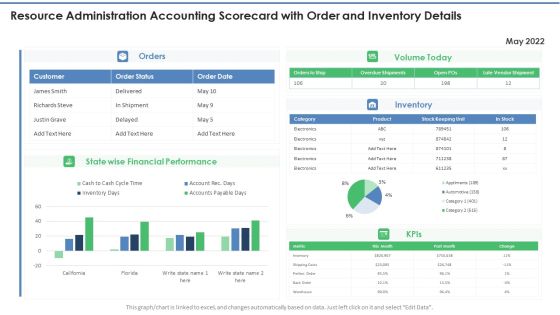
Resource Administration Accounting Scorecard With Order And Inventory Details Mockup PDF
This graph or chart is linked to excel, and changes automatically based on data. Just left click on it and select Edit Data. Deliver and pitch your topic in the best possible manner with this Resource Administration Accounting Scorecard With Order And Inventory Details Mockup PDF. Use them to share invaluable insights on Volume Today, Financial Performance, State wise and impress your audience. This template can be altered and modified as per your expectations. So, grab it now.
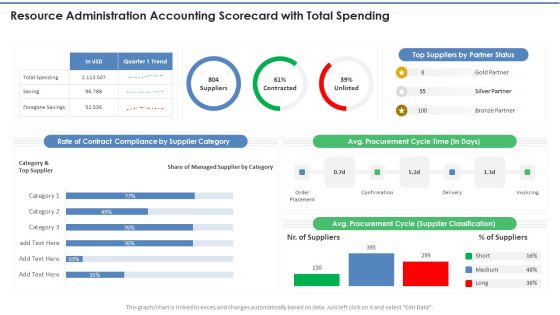
Resource Administration Accounting Scorecard With Total Spending Professional PDF
This graph or chart is linked to excel, and changes automatically based on data. Just left click on it and select Edit Data. Deliver and pitch your topic in the best possible manner with this Resource Administration Accounting Scorecard With Total Spending Professional PDF. Use them to share invaluable insights on Supplier Category, Cycle Time, Top Suppliers and impress your audience. This template can be altered and modified as per your expectations. So, grab it now.

Monthly Resource Administration Accounting Scorecard Template PDF
This graph or chart is linked to excel, and changes automatically based on data. Just left click on it and select Edit Data. Deliver and pitch your topic in the best possible manner with this Monthly Resource Administration Accounting Scorecard Template PDF. Use them to share invaluable insights on Revenue Vs Costs, Total Profit, Number Units Sold and impress your audience. This template can be altered and modified as per your expectations. So, grab it now.

Agricultural Business Company Profile Inventories By Segment 2016 And 2021 Sample PDF
This slide highlights the inventories for 2016 and 2021 through pie chart format. It includes retail products, potash, nitrogen, and phosphate.Deliver and pitch your topic in the best possible manner with this Agricultural Business Company Profile Inventories By Segment 2016 And 2021 Sample PDF Use them to share invaluable insights on Retail Products, Phosphate, Retail and impress your audience. This template can be altered and modified as per your expectations. So, grab it now.

Strategic Human Resource Retention Management Employee Survey Results Template PDF
Purpose of the following slide is to show the survey results as it displays pie chart that show actual results. Deliver and pitch your topic in the best possible manner with this Strategic Human Resource Retention Management Employee Survey Results Template PDF. Use them to share invaluable insights on Compensation, Underappreciated, Work Environment and impress your audience. This template can be altered and modified as per your expectations. So, grab it now.

Legal Advisory Company Description Total Revenue And Headcount Graphics PDF
This slide highlights the total revenue and employee headcount of law firm company which showcases three years from 2020 to 2022 in combination chart format.Deliver and pitch your topic in the best possible manner with this Legal Advisory Company Description Total Revenue And Headcount Graphics PDF. Use them to share invaluable insights on Total Employee, Revenue Earned, Employees Count and impress your audience. This template can be altered and modified as per your expectations. So, grab it now.

RPA In HR Operations Impact Of Technology Acceptance On HR Functioning Infographics PDF
This slide shows the pie chart that represents the impact of technology acceptance on human resource functions such as employee engagement, recruitment, talent management, etc.Deliver and pitch your topic in the best possible manner with this RPA In HR Operations Impact Of Technology Acceptance On HR Functioning Infographics PDF. Use them to share invaluable insights on Engage Employees, Manage Talent, Employee Engagement and impress your audience. This template can be altered and modified as per your expectations. So, grab it now.

Building Design Firm Details Ebitda And Margin Ppt Professional Shapes PDF
This slide highlights the earnings before interest, taxes, depreciation, and amortization of the architecture company which showcases five year data through combination chart. Deliver and pitch your topic in the best possible manner with this Building Design Firm Details Ebitda And Margin Ppt Professional Shapes PDF. Use them to share invaluable insights on EBITDA Margin Increased, 2018 To 2020 and impress your audience. This template can be altered and modified as per your expectations. So, grab it now.

Security Officer Service Company Profile Ebitda And Margin Ppt PowerPoint Presentation File Deck PDF
This slide highlights the EBITDA and margin of security guard and manpower services company which showcases five-year data through combination chart. Deliver and pitch your topic in the best possible manner with this Security Officer Service Company Profile Ebitda And Margin Ppt PowerPoint Presentation File Deck PDF. Use them to share invaluable insights on EBITDA Increased, 2018 To 2022, EBITDA Margin Increased and impress your audience. This template can be altered and modified as per your expectations. So, grab it now.

Platform Business Model Implementation In Firm Implementing Moscow Task Prioritization Model Inspiration PDF
This slide covers the task and priority table with estimated effort and chart for the tasks performed based on Moscow prioritization model.Deliver and pitch your topic in the best possible manner with this Platform Business Model Implementation In Firm Implementing Moscow Task Prioritization Model Inspiration PDF. Use them to share invaluable insights on Estimated Effort, Total Estimated, Task Priority and impress your audience. This template can be altered and modified as per your expectations. So, grab it now.

Farming Business Company Profile Inventories By Segment 2016 And 2021 Themes PDF
This slide highlights the inventories for 2016 and 2021 through pie chart format. It includes retail products, potash, nitrogen, and phosphate.Deliver and pitch your topic in the best possible manner with this Farming Business Company Profile Inventories By Segment 2016 And 2021 Themes PDF. Use them to share invaluable insights on Products Increased, Stock Value, Values Potash and impress your audience. This template can be altered and modified as per your expectations. So, grab it now.

Business To Customer Online And Traditional Demographic Segmentation Template PDF
Use these data driven charts and diagrams to describe your target customer in detail for better insights.Deliver and pitch your topic in the best possible manner with this Business To Customer Online And Traditional Demographic Segmentation Template PDF. Use them to share invaluable insights on Psychographic Segmentation, Opinions, Behaviors and impress your audience. This template can be altered and modified as per your expectations. So, grab it now.
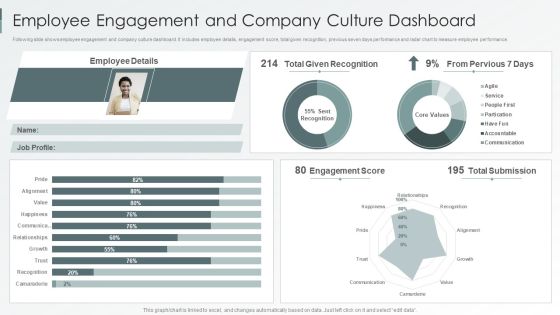
Enterprise Sustainability Performance Metrics Employee Engagement And Company Culture Dashboard Background PDF
Following slide shows employee engagement and company culture dashboard. It includes employee details, engagement score, total given recognition, previous seven days performance and radar chart to measure employee performance.Deliver and pitch your topic in the best possible manner with this Enterprise Sustainability Performance Metrics Employee Engagement And Company Culture Dashboard Background PDF. Use them to share invaluable insights on Given Recognition, Pervious, Engagement Score and impress your audience. This template can be altered and modified as per your expectations. So, grab it now.
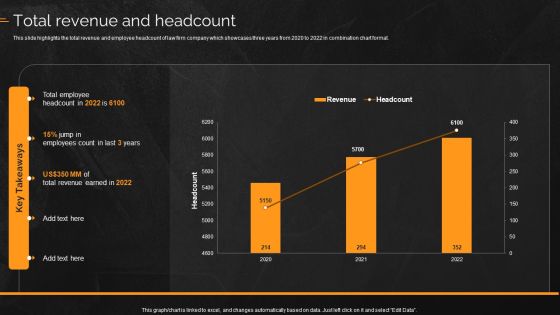
Law And Enforcement Company Profile Total Revenue And Headcount Topics PDF
This slide highlights the total revenue and employee headcount of law firm company which showcases three years from 2020 to 2022 in combination chart format. Deliver and pitch your topic in the best possible manner with this Law And Enforcement Company Profile Total Revenue And Headcount Topics PDF. Use them to share invaluable insights on Employees, Revenue and impress your audience. This template can be altered and modified as per your expectations. So, grab it now.

Commercial And Urban Architect Business Profile Ebitda And Margin Professional PDF
This slide highlights the earnings before interest, taxes, depreciation, and amortization of the architecture company which showcases five year data through combination chart. Deliver and pitch your topic in the best possible manner with this Commercial And Urban Architect Business Profile Ebitda And Margin Professional PDF. Use them to share invaluable insights on EBITDA And Margin and impress your audience. This template can be altered and modified as per your expectations. So, grab it now.

International Legal And Business Services Company Profile Total Revenue And Headcount Professional PDF
This slide highlights the total revenue and employee headcount of law firm company which showcases three years from 2020 to 2022 in combination chart format. Deliver and pitch your topic in the best possible manner with this International Legal And Business Services Company Profile Total Revenue And Headcount Professional PDF. Use them to share invaluable insights on Total Revenue, Headcount and impress your audience. This template can be altered and modified as per your expectations. So, grab it now.
 Home
Home