Trade Show Plan
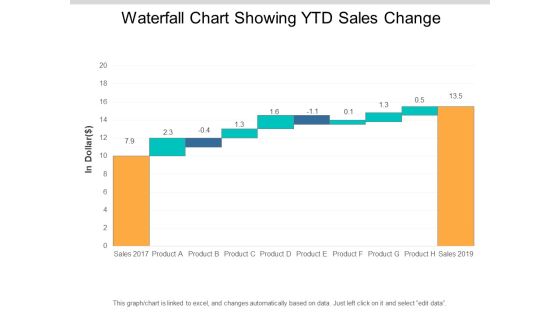
Waterfall Chart Showing Ytd Sales Change Ppt PowerPoint Presentation Professional Format
This is a waterfall chart showing ytd sales change ppt powerpoint presentation professional format. This is a ten stage process. The stages in this process are sales waterfall, waterfall chart, business.

Business Calendar Showing Sales Progress Ppt PowerPoint Presentation Inspiration Diagrams PDF
Presenting this set of slides with name business calendar showing sales progress ppt powerpoint presentation inspiration diagrams pdf. This is a twelve stage process. The stages in this process are lead generation, pipeline building, cold calling, customer visit. This is a completely editable PowerPoint presentation and is available for immediate download. Download now and impress your audience.
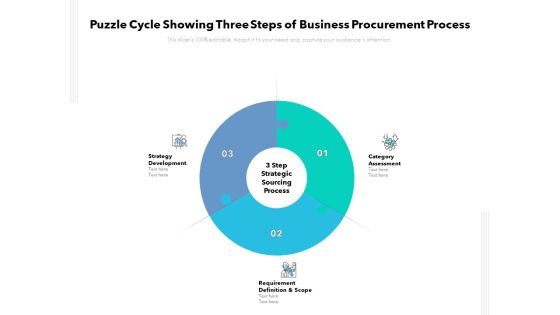
Puzzle Cycle Showing Three Steps Of Business Procurement Process Ppt PowerPoint Presentation Slides Ideas PDF
Presenting this set of slides with name puzzle cycle showing three steps of business procurement process ppt powerpoint presentation slides ideas pdf. This is a three stage process. The stages in this process are category assessment, requirement definition and scope, strategy development. This is a completely editable PowerPoint presentation and is available for immediate download. Download now and impress your audience.

Dashboard Showing Effective Management Of Sales Pipeline Sales Funnel Management Summary PDF
This slide shows the process steps followed by the company for the recruitment of new employees. It stars from Identifying the hiring needs and ends with employment offer.Deliver an awe inspiring pitch with this creative Dashboard Showing Effective Management Of Sales Pipeline Sales Funnel Management Summary PDF bundle. Topics like Closed Business, Sales Pipeline, Sales Activity can be discussed with this completely editable template. It is available for immediate download depending on the needs and requirements of the user.

Sales Process Management To Boost Dashboard Showing Sales Pipeline Opportunities Topics PDF
This slide shows the process steps followed by the company for the recruitment of new employees. It stars from Identifying the hiring needs and ends with employment offer.Deliver an awe inspiring pitch with this creative Sales Process Management To Boost Dashboard Showing Sales Pipeline Opportunities Topics PDF bundle. Topics like Sales Funnel, Forecast Summary, Opportunities can be discussed with this completely editable template. It is available for immediate download depending on the needs and requirements of the user.

Sales Management Pipeline For Effective Lead Generation Dashboard Showing Sales Pipeline Opportunities Mockup PDF
This slide shows the process steps followed by the company for the recruitment of new employees. It stars from Identifying the hiring needs and ends with employment offer. Deliver an awe inspiring pitch with this creative Sales Management Pipeline For Effective Lead Generation Dashboard Showing Sales Pipeline Opportunities Mockup PDF bundle. Topics like Opportunities, Sales Funnel can be discussed with this completely editable template. It is available for immediate download depending on the needs and requirements of the user.
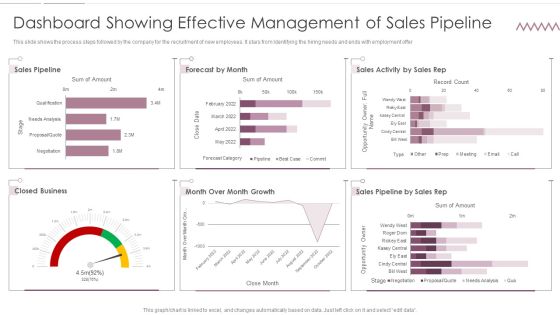
Sales Management Pipeline For Effective Lead Generation Dashboard Showing Effective Management Of Sales Pipeline Download PDF
This slide shows the process steps followed by the company for the recruitment of new employees. It stars from Identifying the hiring needs and ends with employment offer. Deliver an awe inspiring pitch with this creative Sales Management Pipeline For Effective Lead Generation Dashboard Showing Effective Management Of Sales Pipeline Download PDF bundle. Topics like Sales Pipeline, Growth, Business can be discussed with this completely editable template. It is available for immediate download depending on the needs and requirements of the user.

Chart Vector Showing Loss In Inside Sales Ppt PowerPoint Presentation Gallery Guide PDF
Persuade your audience using this chart vector showing loss in inside sales ppt powerpoint presentation gallery guide pdf. This PPT design covers three stages, thus making it a great tool to use. It also caters to a variety of topics including chart vector showing loss in inside sales. Download this PPT design now to present a convincing pitch that not only emphasizes the topic but also showcases your presentation skills.

Split Circular Chart Showing Product Sales Performance Ppt PowerPoint Presentation Professional Microsoft PDF
Persuade your audience using this split circular chart showing product sales performance ppt powerpoint presentation professional microsoft pdf. This PPT design covers five stages, thus making it a great tool to use. It also caters to a variety of topics including split circular chart showing product sales performance. Download this PPT design now to present a convincing pitch that not only emphasizes the topic but also showcases your presentation skills.

Curved Roadmap Showing Sales Revenue Target Ppt PowerPoint Presentation Outline Example Topics
Presenting this set of slides with name curved roadmap showing sales revenue target ppt powerpoint presentation outline example topics. This is a six stage process. The stages in this process are increase capacity, sales revenue target, addition of new strategy . This is a completely editable PowerPoint presentation and is available for immediate download. Download now and impress your audience.
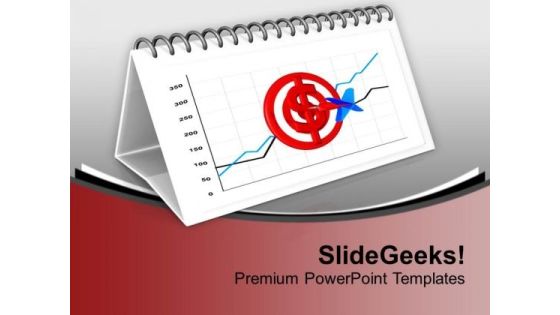
Calendar Shows Financial Progress Of The Year PowerPoint Templates Ppt Backgrounds For Slides 0713
Establish your dominion with our Calendar Shows Financial Progress Of The Year PowerPoint Templates PPT Backgrounds For Slides. Rule the stage with your thoughts. Your ideas demand attention. Our business PowerPoint Templates will get it done. Your listeners will never doodle. Our finance PowerPoint Templates PowerPoint Templates will hold their concentration.

Formulating Branding Strategy To Enhance Revenue And Sales Dashboard Showing Performance Of Various Graphics PDF
The following slide outlines the key performance indicator dashboard used by the organization to evaluate the effectiveness of multiple marketing campaigns. It provides information about total spending, impressions, acquisitions, cost per acquisition, clicks, etc. Create an editable Formulating Branding Strategy To Enhance Revenue And Sales Dashboard Showing Performance Of Various Graphics PDF that communicates your idea and engages your audience. Whether youre presenting a business or an educational presentation, pre designed presentation templates help save time. Formulating Branding Strategy To Enhance Revenue And Sales Dashboard Showing Performance Of Various Graphics PDF is highly customizable and very easy to edit, covering many different styles from creative to business presentations. Slidegeeks has creative team members who have crafted amazing templates. So, go and get them without any delay.
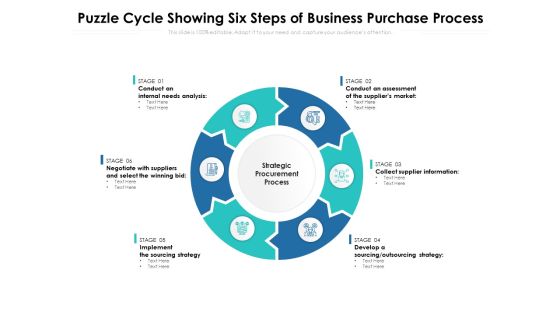
Puzzle Cycle Showing Six Steps Of Business Purchase Process Ppt PowerPoint Presentation Layouts Slide PDF
Presenting this set of slides with name puzzle cycle showing six steps of business purchase process ppt powerpoint presentation layouts slide pdf. This is a six stage process. The stages in this process are conduct an assessment of the suppliers market, collect supplier information, develop a sourcing, outsourcing strategy, implement the sourcing strategy, negotiate with suppliers and select the winning bid, conduct an internal needs analysis. This is a completely editable PowerPoint presentation and is available for immediate download. Download now and impress your audience.

Graph Showing Reduction In Product Sales Ppt PowerPoint Presentation Infographic Template Graphics Design PDF
Pitch your topic with ease and precision using this graph showing reduction in product sales ppt powerpoint presentation infographic template graphics design pdf. This layout presents information on graph showing reduction in product sales, 2015 to 2020. It is also available for immediate download and adjustment. So, changes can be made in the color, design, graphics or any other component to create a unique layout.

Recruitment Marketing Strategies For NPO Business Recruitment Marketing Funnel Showing Candidate Journey Infographics PDF
This slide outlines a marketing funnel showing candidate journey to effectively develop targeted marketing strategy during hiring and recruitment. It presents journey stages such as aware, engage, consider, applied, screen, interview, offer and hire. Present like a pro with Recruitment Marketing Strategies For NPO Business Recruitment Marketing Funnel Showing Candidate Journey Infographics PDF Create beautiful presentations together with your team, using our easy-to-use presentation slides. Share your ideas in real-time and make changes on the fly by downloading our templates. So whether you are in the office, on the go, or in a remote location, you can stay in sync with your team and present your ideas with confidence. With Slidegeeks presentation got a whole lot easier. Grab these presentations today.

Sales Graph Showing Payouts Losses And Wins Ppt PowerPoint Presentation Pictures Designs Download
This is a sales graph showing payouts losses and wins ppt powerpoint presentation pictures designs download. This is a eight stage process. The stages in this process are sales waterfall, waterfall chart, business.

Puzzle Cycle Showing Eight Steps Of Business Procurement Process Ppt PowerPoint Presentation Layouts Guide PDF
Presenting this set of slides with name puzzle cycle showing eight steps of business procurement process ppt powerpoint presentation layouts guide pdf. This is a eight stage process. The stages in this process are category assessment, requirement definition and scope, strategy development, strategy execution, negotiation and contact award, implementation and transition, supplier relationship management. This is a completely editable PowerPoint presentation and is available for immediate download. Download now and impress your audience.
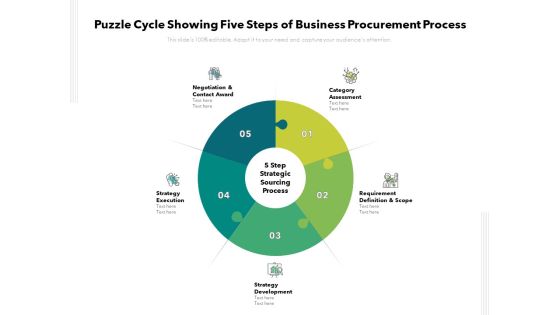
Puzzle Cycle Showing Five Steps Of Business Procurement Process Ppt PowerPoint Presentation Infographics Clipart PDF
Presenting this set of slides with name puzzle cycle showing five steps of business procurement process ppt powerpoint presentation infographics clipart pdf. This is a five stage process. The stages in this process are category assessment, requirement definition and scope, strategy development, strategy execution, negotiation and contact award. This is a completely editable PowerPoint presentation and is available for immediate download. Download now and impress your audience.
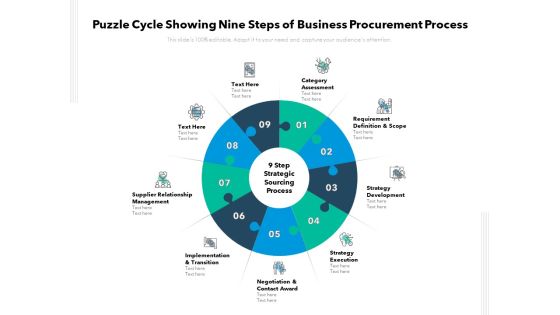
Puzzle Cycle Showing Nine Steps Of Business Procurement Process Ppt PowerPoint Presentation Styles Structure PDF
Presenting this set of slides with name puzzle cycle showing nine steps of business procurement process ppt powerpoint presentation styles structure pdf. This is a nine stage process. The stages in this process are category assessment, requirement definition and scope, strategy development, strategy execution, negotiation and contact award, implementation and transition, supplier relationship management. This is a completely editable PowerPoint presentation and is available for immediate download. Download now and impress your audience.

Puzzle Cycle Showing Seven Steps Of Business Procurement Process Ppt PowerPoint Presentation Pictures Layout Ideas PDF
Presenting this set of slides with name puzzle cycle showing seven steps of business procurement process ppt powerpoint presentation pictures layout ideas pdf. This is a seven stage process. The stages in this process are category assessment, requirement definition and scope, strategy development, strategy execution, negotiation and contact award, implementation and transition, supplier relationship management. This is a completely editable PowerPoint presentation and is available for immediate download. Download now and impress your audience.
Puzzle Cycle Showing Six Steps Of Business Procurement Process Ppt PowerPoint Presentation Icon Example PDF
Presenting this set of slides with name puzzle cycle showing six steps of business procurement process ppt powerpoint presentation icon example pdf. This is a six stage process. The stages in this process are category assessment, requirement definition and scope, strategy development, strategy execution, negotiation and contact award, implementation and transition. This is a completely editable PowerPoint presentation and is available for immediate download. Download now and impress your audience.
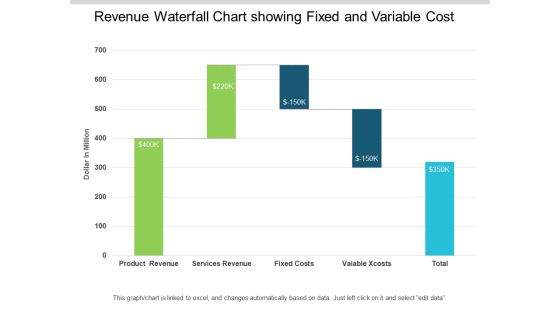
Revenue Waterfall Chart Showing Fixed And Variable Cost Ppt PowerPoint Presentation Infographic Template Images
This is a revenue waterfall chart showing fixed and variable cost ppt powerpoint presentation infographic template images. This is a five stage process. The stages in this process are sales waterfall, waterfall chart, business.
Waterfall Chart Showing Effective Pricing And Profitability Insight Ppt PowerPoint Presentation Icon Graphics
This is a waterfall chart showing effective pricing and profitability insight ppt powerpoint presentation icon graphics. This is a seven stage process. The stages in this process are sales waterfall, waterfall chart, business.

Area Graph Showing Sales Trends Over Time Ppt PowerPoint Presentation Model Background Designs
This is a area graph showing sales trends over time ppt powerpoint presentation model background designs. This is a three stage process. The stages in this process are financial analysis, quantitative, statistical modelling.
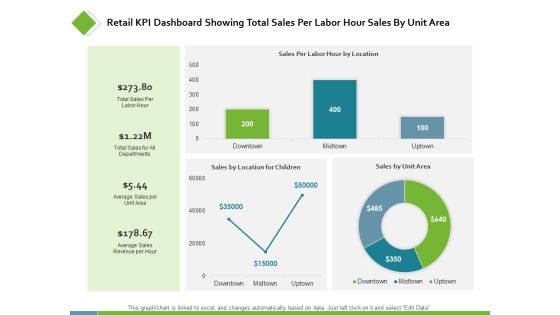
Retail KPI Dashboard Showing Total Sales Per Labor Ppt PowerPoint Presentation Styles Examples
This is a retail kpi dashboard showing total sales per labor ppt powerpoint presentation styles examples. This is a three stage process. The stages in this process are finance, analysis, business, investment, marketing.

Waterfall Graph Showing Net Sales And Gross Profit Ppt PowerPoint Presentation Infographics Format
This is a waterfall graph showing net sales and gross profit ppt powerpoint presentation infographics format. This is a three stage process. The stages in this process are profit and loss, balance sheet, income statement, benefit and loss.
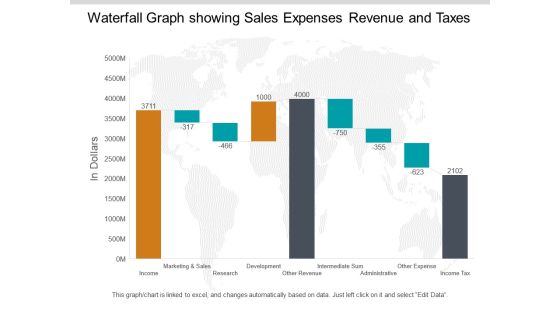
Waterfall Graph Showing Sales Expenses Revenue And Taxes Ppt PowerPoint Presentation Pictures Summary
This is a waterfall graph showing sales expenses revenue and taxes ppt powerpoint presentation pictures summary. This is a three stage process. The stages in this process are profit and loss, balance sheet, income statement, benefit and loss.

Chart Showing Quarterly Goals Strategic Objectives Ppt PowerPoint Presentation Outline Ideas
Presenting this set of slides with name chart showing quarterly goals strategic objectives ppt powerpoint presentation outline ideas. The topics discussed in these slides are conversion rates, grow revenue, sales campaigns. This is a completely editable PowerPoint presentation and is available for immediate download. Download now and impress your audience.
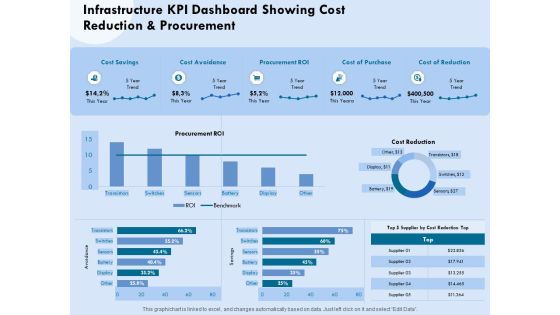
Functional Analysis Of Business Operations Infrastructure KPI Dashboard Showing Cost Reduction Elements PDF
Presenting this set of slides with name functional analysis of business operations infrastructure kpi dashboard showing cost reduction elements pdf. The topics discussed in these slides are cost savings, cost avoidance, procurement, cost of purchase, cost of reduction. This is a completely editable PowerPoint presentation and is available for immediate download. Download now and impress your audience.
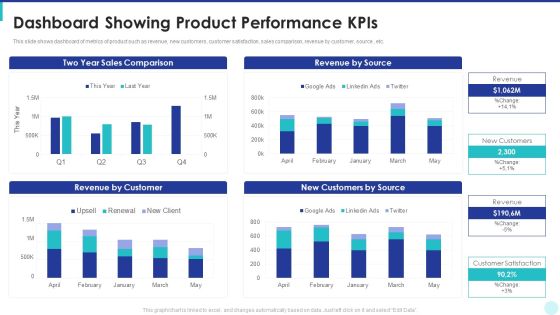
Optimization Of Product Development Life Cycle Dashboard Showing Product Performance Kpis Topics PDF
This slide shows dashboard of metrics of product such as revenue, new customers, customer satisfaction, sales comparison, revenue by customer, source , etc. Deliver an awe inspiring pitch with this creative optimization of product development life cycle dashboard showing product performance kpis topics pdf bundle. Topics like sales comparison, revenue by source, revenue by customer, customers by source can be discussed with this completely editable template. It is available for immediate download depending on the needs and requirements of the user.
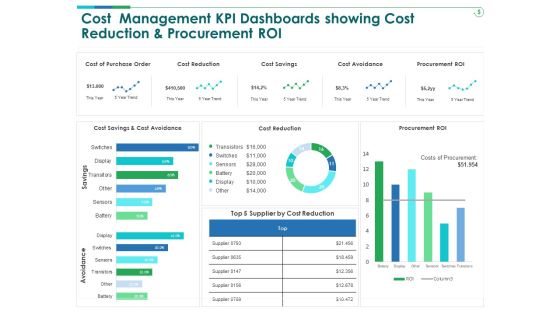
TCM Cost Management KPI Dashboards Showing Cost Reduction And Procurement ROI Structure PDF
Presenting this set of slides with name tcm cost management kpi dashboards showing cost reduction and procurement roi structure pdf. The topics discussed in these slides are cost, reduction, procurement. This is a completely editable PowerPoint presentation and is available for immediate download. Download now and impress your audience.

Dashboard Showing Spend Management By Procurement Ppt PowerPoint Presentation Gallery Display PDF
Presenting this set of slides with name dashboard showing spend management by procurement ppt powerpoint presentation gallery display pdf. The topics discussed in these slides are procurement, marketing, service. This is a completely editable PowerPoint presentation and is available for immediate download. Download now and impress your audience.
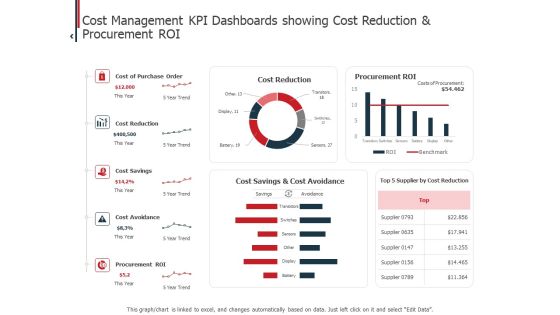
Expenditure Administration Cost Management KPI Dashboards Showing Cost Reduction And Procurement ROI Pictures PDF
Presenting this set of slides with name expenditure administration cost management kpi dashboards showing cost reduction and procurement roi pictures pdf. The topics discussed in these slides are cost, reduction, procurement. This is a completely editable PowerPoint presentation and is available for immediate download. Download now and impress your audience.

Product Cost Management PCM Cost Management KPI Dashboards Showing Cost Reduction And Procurement ROI Clipart PDF
Deliver and pitch your topic in the best possible manner with this product cost management pcm cost management kpi dashboards showing cost reduction and procurement roi clipart pdf. Use them to share invaluable insights on cost, reduction, procurement and impress your audience. This template can be altered and modified as per your expectations. So, grab it now.
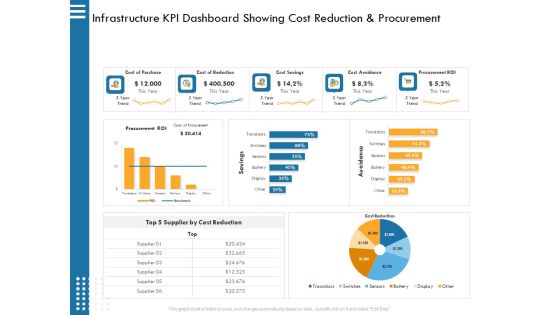
IT Infrastructure Governance Infrastructure KPI Dashboard Showing Cost Reduction And Procurement Ppt Infographics Picture PDF
Deliver an awe inspiring pitch with this creative it infrastructure governance infrastructure kpi dashboard showing cost reduction and procurement ppt infographics picture pdf. bundle. Topics like supplier, cost, reduction, procurement, avoidance. can be discussed with this completely editable template. It is available for immediate download depending on the needs and requirements of the user.

Definitive Guide Creating Strategy B2B Content Marketing Showing Five Stages Awareness Structure PDF
This is a definitive guide creating strategy b2b content marketing showing five stages awareness structure pdf template with various stages. Focus and dispense information on five stages using this creative set, that comes with editable features. It contains large content boxes to add your information on topics like consideration research, content marketing process, purchase, loyalty, awareness of need. You can also showcase facts, figures, and other relevant content using this PPT layout. Grab it now.

Infrastructure Project Management In Construction KPI Dashboard Showing Cost Reduction And Procurement Introduction PDF
Deliver and pitch your topic in the best possible manner with this infrastructure project management in construction kpi dashboard showing cost reduction and procurement introduction pdf. Use them to share invaluable insights on cost reduction, transistors, sensors, supplier and impress your audience. This template can be altered and modified as per your expectations. So, grab it now.

Dashboards Showing Consultancy Company Performance With Key Metrics Ppt Ideas Smartart PDF
This slide shows the dashboard related to consultancy company performance which includes budget preparation, sales and goals. Company profits and goals etc. Deliver an awe-inspiring pitch with this creative dashboards showing consultancy company performance with key metrics ppt ideas smartart pdf bundle. Topics like budget, products, customers can be discussed with this completely editable template. It is available for immediate download depending on the needs and requirements of the user.

Circular Layout Showing Tactics For Technology Integration Ppt PowerPoint Presentation Summary Gallery PDF
Presenting this set of slides with name circular layout showing tactics for technology integration ppt powerpoint presentation summary gallery pdf. This is a four stage process. The stages in this process are business roadmap, business policies and regulation, success tactics, technology integration. This is a completely editable PowerPoint presentation and is available for immediate download. Download now and impress your audience.

CRM Sales Pipeline Showing Deals In Real Estate Customer Relationship Management Designs PDF
This slide represents the sales pipeline prepared with the help of CRM software used by a real estate company. It includes details related to new deals and won deals along with their respective owners, stage priority, close probability and deal value. Showcasing this set of slides titled CRM Sales Pipeline Showing Deals In Real Estate Customer Relationship Management Designs PDF. The topics addressed in these templates are Close Probability, Deal Value, Priority. All the content presented in this PPT design is completely editable. Download it and make adjustments in color, background, font etc. as per your unique business setting.

Creating Customer Personas For Customizing Statistics Showing Impact Of Developing Strong Formats PDF
The slide outlines impact of building strong customer persona on business. It provides information about open rate, click through rate, targeted customers, business sales, opportunity and competition mix, database segmentation and marketing generated revenue. Crafting an eye-catching presentation has never been more straightforward. Let your presentation shine with this tasteful yet straightforward Creating Customer Personas For Customizing Statistics Showing Impact Of Developing Strong Formats PDF template. It offers a minimalistic and classy look that is great for making a statement. The colors have been employed intelligently to add a bit of playfulness while still remaining professional. Construct the ideal Creating Customer Personas For Customizing Statistics Showing Impact Of Developing Strong Formats PDF that effortlessly grabs the attention of your audience Begin now and be certain to wow your customers.

Quarterly Sales Performance Of Business Tracker Showing Customer Conversion Rate Formats PDF
This slide delineates a table to record quarter wise performance statistics of sales team in organization. It includes information about completed activities, targets, percentage to target and pace of operations. Pitch your topic with ease and precision using this Quarterly Sales Performance Of Business Tracker Showing Customer Conversion Rate Formats PDF. This layout presents information on Quarterly Sales Performance, Business Tracker Showing, Customer Conversion Rate. It is also available for immediate download and adjustment. So, changes can be made in the color, design, graphics or any other component to create a unique layout.

CRM Performance Metrics Dashboard Showing Sales In Real Estate Customer Information PDF
This slide represents the dashboard showing the sales performance of a real estate company. It includes details related top 5 agents US sales, sales vs target per agent, top 5 banks-sold units, sales by top 5 agencies. Pitch your topic with ease and precision using this CRM Performance Metrics Dashboard Showing Sales In Real Estate Customer Information PDF. This layout presents information on Us Sales, Sold Units, Target Per Agent. It is also available for immediate download and adjustment. So, changes can be made in the color, design, graphics or any other component to create a unique layout.
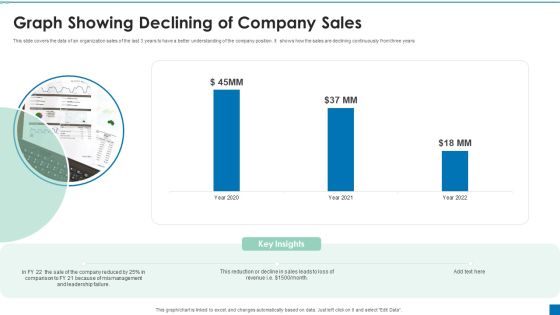
Graph Showing Declining Of Company Sales Ppt PowerPoint Presentation Portfolio Graphics Example PDF
This slide covers the data of an organization sales of the last 3 years to have a better understanding of the company position. It shows how the sales are declining continuously from three years.Pitch your topic with ease and precision using this Graph Showing Declining Of Company Sales Ppt PowerPoint Presentation Portfolio Graphics Example PDF. This layout presents information on Reduction Decline, Comparison, Mismanagement. It is also available for immediate download and adjustment. So, changes can be made in the color, design, graphics or any other component to create a unique layout.

Business Chart Showing Number Of Retailers And Resellers Ppt PowerPoint Presentation Outline Graphics Pictures PDF
Presenting this set of slides with name business chart showing number of retailers and resellers ppt powerpoint presentation outline graphics pictures pdf. This is a three stage process. The stages in this process are head tail, market leading, mid tail, long tail, number of retailers and resellers, sales. This is a completely editable PowerPoint presentation and is available for immediate download. Download now and impress your audience.
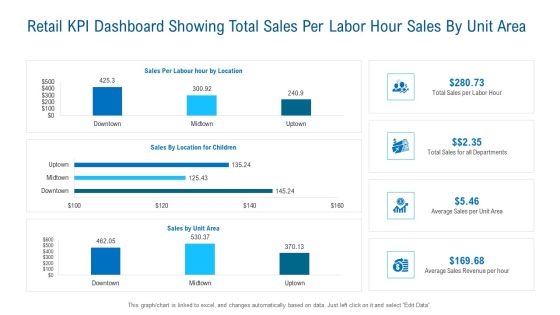
Retail KPI Dashboard Showing Total Sales Per Labor Hour Sales By Unit Area Guidelines PDF
Deliver an awe inspiring pitch with this creative retail kpi dashboard showing total sales per labor hour sales by unit area guidelines pdf bundle. Topics like sales per labour hour by location, sales by location for children, sales by unit area can be discussed with this completely editable template. It is available for immediate download depending on the needs and requirements of the user.

Dashboard Showing Monthly Sales And Sales Distribution Ppt PowerPoint Presentation Infographic Template Portrait PDF
Presenting this set of slides with name dashboard showing monthly sales and sales distribution ppt powerpoint presentation infographic template portrait pdf. The topics discussed in these slides are monthly sales, sales distribution. This is a completely editable PowerPoint presentation and is available for immediate download. Download now and impress your audience.

Bar Chart Showing Quarterly Business Sales Ppt PowerPoint Presentation Model Icon
Presenting this set of slides with name bar chart showing quarterly business sales ppt powerpoint presentation model icon. The topics discussed in these slides are revenue trend, bar chart, financial. This is a completely editable PowerPoint presentation and is available for immediate download. Download now and impress your audience.

Bar Chart Showing Sales Gross Margin Net Profit Ppt PowerPoint Presentation Inspiration Diagrams
Presenting this set of slides with name bar chart showing sales gross margin net profit ppt powerpoint presentation inspiration diagrams. The topics discussed in these slides are sales, gross margin, net profit. This is a completely editable PowerPoint presentation and is available for immediate download. Download now and impress your audience.

Three Axis Bar Chart Showing Sales In Millions Ppt PowerPoint Presentation Inspiration PDF
Presenting this set of slides with name three axis bar chart showing sales in millions ppt powerpoint presentation inspiration pdf. The topics discussed in these slides are air conditioner, television, 2011 to 2020. This is a completely editable PowerPoint presentation and is available for immediate download. Download now and impress your audience.

Chart Showing Reducing Sales Of Beverages Ppt PowerPoint Presentation Gallery Slide Portrait PDF
Pitch your topic with ease and precision using this chart showing reducing sales of beverages ppt powerpoint presentation gallery slide portrait pdf. This layout presents information on pepsi, coke. It is also available for immediate download and adjustment. So, changes can be made in the color, design, graphics or any other component to create a unique layout.

Dashboard Showing Procurement Cycle Time Ppt PowerPoint Presentation Icon Example Topics PDF
Pitch your topic with ease and precision using this dashboard showing procurement cycle time ppt powerpoint presentation icon example topics pdf. This layout presents information on top suppliers by partner status, rate of contract compliance by supplier category, avg procurement cycle supplier classification. It is also available for immediate download and adjustment. So, changes can be made in the color, design, graphics or any other component to create a unique layout.

Chart Showing Hierarchy Of An Organization Ppt PowerPoint Presentation Pictures Influencers
Presenting this set of slides with name chart showing hierarchy of an organization ppt powerpoint presentation pictures influencers. This is a three stage process. The stages in this process are top sales executive, foreign sales manager, organization. This is a completely editable PowerPoint presentation and is available for immediate download. Download now and impress your audience.
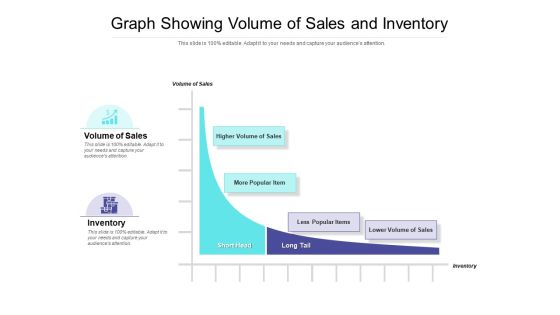
Graph Showing Volume Of Sales And Inventory Ppt PowerPoint Presentation Outline Professional PDF
Presenting this set of slides with name graph showing volume of sales and inventory ppt powerpoint presentation outline professional pdf. This is a two stage process. The stages in this process are volume of sales, inventory, higher volume of sales, higher volume of sales, less popular items, lower volume of sales. This is a completely editable PowerPoint presentation and is available for immediate download. Download now and impress your audience.

Chart Showing Sales Target Achievement In Past Three Months Ppt PowerPoint Presentation File Portfolio PDF
Presenting this set of slides with name chart showing sales target achievement in past three months ppt powerpoint presentation file portfolio pdf. The topics discussed in these slides are name, sales past 3 months. This is a completely editable PowerPoint presentation and is available for immediate download. Download now and impress your audience.
Business Charts PowerPoint Templates Design Of An Emoticon Showing Angry Face Sales
Business Charts PowerPoint templates design of an emoticon showing angry face Sales-Use this Business PowerPoint Diagram to represent different types of angry faces. It portrays the concept of animosity, annoyance, antagonism, ill humor, ill temper, impatience, indignation, infuriation, irascibility, ire, irritability, vexation, violence.

Arrow Layout Showing Asset Management Process Ppt PowerPoint Presentation Outline File Formats
Presenting this set of slides with name arrow layout showing asset management process ppt powerpoint presentation outline file formats. This is a four stage process. The stages in this process are acquisition, development, operation, divestiture, procurement of asset, testing asset functionality, evaluation of real time performance. This is a completely editable PowerPoint presentation and is available for immediate download. Download now and impress your audience.
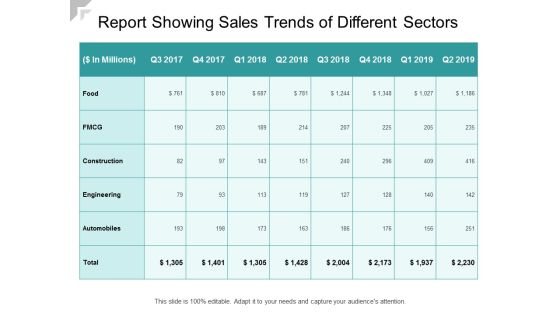
Report Showing Sales Trends Of Different Sectors Ppt PowerPoint Presentation Professional Examples
Presenting this set of slides with name report showing sales trends of different sectors ppt powerpoint presentation professional examples. The topics discussed in these slides are revenue trend, bar chart, financial. This is a completely editable PowerPoint presentation and is available for immediate download. Download now and impress your audience.

Bar Graph Showing Sales Projections Ppt PowerPoint Presentation Styles Graphics Download PDF
Presenting this set of slides with name bar graph showing sales projections ppt powerpoint presentation styles graphics download pdf. The topics discussed in these slides are Sales, Forecasted Sales. This is a completely editable PowerPoint presentation and is available for immediate download. Download now and impress your audience.
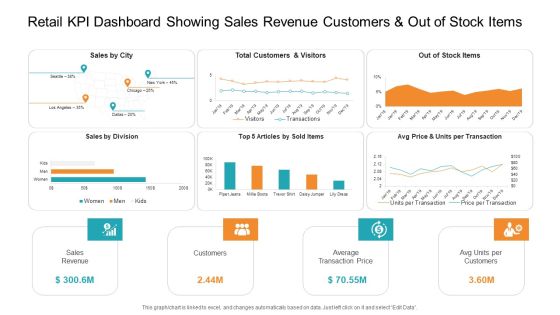
Retail KPI Dashboard Showing Sales Revenue Customers And Out Of Stock Items Introduction PDF
Deliver an awe-inspiring pitch with this creative retail KPI dashboard showing sales revenue customers and out of stock items introduction pdf. bundle. Topics like sales revenue, average transaction price, sales by division can be discussed with this completely editable template. It is available for immediate download depending on the needs and requirements of the user.

 Home
Home