Trade Finance

Competitor Market Share And Sales Revenues Ppt PowerPoint Presentation Summary Influencers
This is a competitor market share and sales revenues ppt powerpoint presentation summary influencers. This is a four stage process. The stages in this process are business, marketing, graph, finance, strategy.

Competitor Market Share And Sales Revenues Ppt PowerPoint Presentation File Demonstration
This is a competitor market share and sales revenues ppt powerpoint presentation file demonstration. This is a six stage process. The stages in this process are business, marketing, finance, your figures, development.
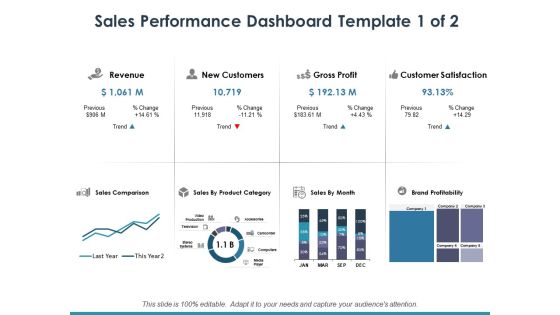
Sales Performance Dashboard Template 1 Ppt PowerPoint Presentation Infographic Template Maker
This is a sales performance dashboard template 1 ppt powerpoint presentation infographic template maker. This is a eight stage process. The stages in this process are dollar, business, finance, marketing.
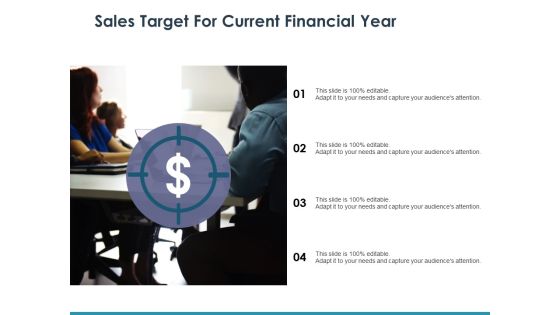
Sales Target For Current Financial Year Ppt PowerPoint Presentation File Professional
This is a sales target for current financial year ppt powerpoint presentation file professional. This is a four stage process. The stages in this process are dollar, business, finance, marketing, currency.

Company Sales And Performance Dashboard Ppt PowerPoint Presentation Pictures Infographic Template
This is a company sales and performance dashboard ppt powerpoint presentation pictures infographic template. This is a four stage process. The stages in this process are business, finance, analysis, management, marketing.
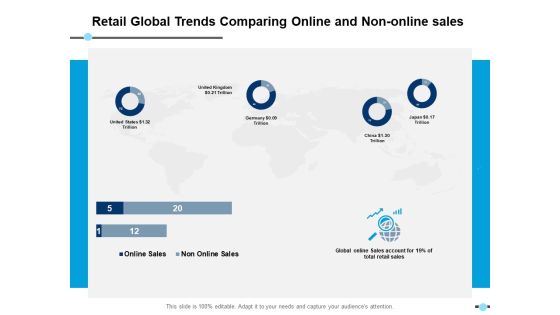
Retail Global Trends Comparing Online And Non Online Sales Donut Ppt PowerPoint Presentation Infographic Template Images
This is a retail global trends comparing online and non online sales donut ppt powerpoint presentation infographic template images. This is a four stage process. The stages in this process are finance, strategy, analysis, marketing.
Retail Sales By Product Category Icons Ppt PowerPoint Presentation Pictures Layout Ideas
This is a retail sales by product category icons ppt powerpoint presentation pictures layout ideas. This is a two stage process. The stages in this process are finance, strategy, analysis, marketing.

Sales Performance Dashboard Template 2 Of 2 Ppt PowerPoint Presentation Infographics Design Inspiration
This is a sales performance dashboard template 2 of 2 ppt powerpoint presentation infographics design inspiration. This is a three stage process. The stages in this process are finance, management, strategy, analysis, marketing.

Operations Performed By Banking Middle Office In Financial Institutions Designs PDF
This slide represents the model showing the middle office operations in financial institutions. It includes three operations performed by middle office such as risk management, regulatory compliance and trade processing. Presenting Operations Performed By Banking Middle Office In Financial Institutions Designs PDF to dispense important information. This template comprises three stages. It also presents valuable insights into the topics including Front Office, Middle Office, Back Office, Risk Management, Regulatory Compliance. This is a completely customizable PowerPoint theme that can be put to use immediately. So, download it and address the topic impactfully.
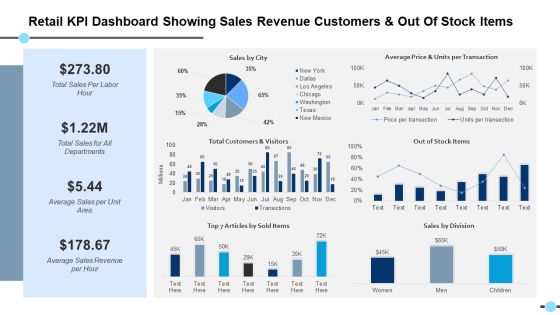
Retail Kpi Dashboard Showing Sales Revenue Customers And Out Of Stock Items Out Of Stock Items Ppt PowerPoint Presentation Files

Customer Deal Tracking In Sales Pipeline Dashboard Topics PDF
This slide covers information regarding dashboard for tracking various customer deals in sales pipeline. Presenting Customer Deal Tracking In Sales Pipeline Dashboard Topics PDF to provide visual cues and insights. Share and navigate important information on four stages that need your due attention. This template can be used to pitch topics like Customer Conversion, Average, Customer Deal Tracking. In addtion, this PPT design contains high resolution images, graphics, etc, that are easily editable and available for immediate download.
Salary Transfer To Employee Account In Employee Payment Services Icon Professional PDF
Presenting salary transfer to employee account in employee payment services icon professional pdf to dispense important information. This template comprises three stages. It also presents valuable insights into the topics including salary transfer to employee account in employee payment services icon. This is a completely customizable PowerPoint theme that can be put to use immediately. So, download it and address the topic impactfully.

Business Framework Break Even Volume PowerPoint Presentation
This power point slide has been crafted with graphic of break even volume. This tem originates from finance. This BVM has been used to show the amount of product that will needed to produce and sell to cover total costs of production. Use this diagram slide for sales and production related presentations.

Workforce At A Glance Ppt PowerPoint Presentation Visual Aids Show
This is a workforce at a glance ppt powerpoint presentation visual aids show. This is a two stage process. The stages in this process are executive, finance, human resource, marketing, operation, sales .

Workforce At A Glance Ppt PowerPoint Presentation Outline Display
This is a workforce at a glance ppt powerpoint presentation outline display. This is a two stage process. The stages in this process are women, executive, finance, human resource, marketing, operation, sales.

Financial Projection Graph Template 1 Ppt PowerPoint Presentation Clipart
This is a financial projection graph template 1 ppt powerpoint presentation clipart. This is a three stage process. The stages in this process are annual, sales, forecast, finance, marketing.

Stacked Column Template 2 Ppt PowerPoint Presentation Visuals
This is a stacked column template 2 ppt powerpoint presentation visuals. This is a twelve stage process. The stages in this process are business, marketing, analysis, sales in percentage, finance, growth strategy.
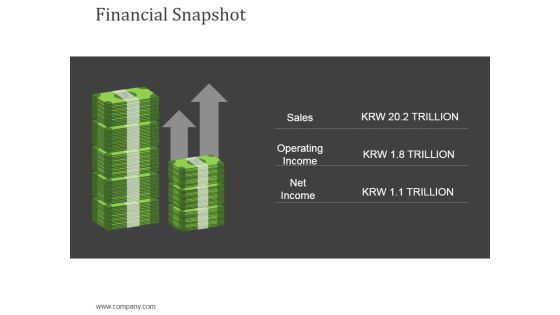
Financial Snapshot Ppt Powerpoint Presentation Layouts Slides
This is a financial snapshot ppt powerpoint presentation layouts slides. This is a two stage process. The stages in this process are sales, operating income, net income, currency, finance.
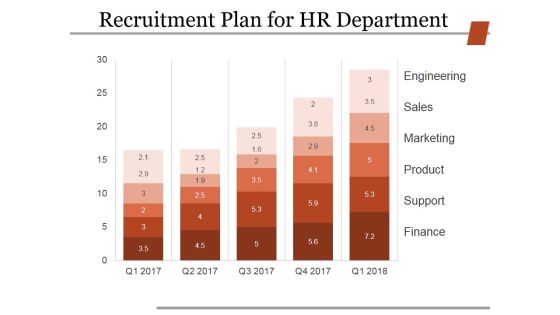
Recruitment Plan For Hr Department Ppt PowerPoint Presentation Infographic Template Design Inspiration
This is a recruitment plan for hr department ppt powerpoint presentation infographic template design inspiration. This is a five stage process. The stages in this process are engineering, sales, marketing, product, support, finance.
Scatter Bubble Chart Ppt PowerPoint Presentation Infographics Icons
This is a scatter bubble chart ppt powerpoint presentation infographics icons. This is a eight stage process. The stages in this process are highest sale, finance, business, management, marketing, chart.

Clustered Column Line Ppt Powerpoint Presentation Slides Demonstration
This is a clustered column line ppt powerpoint presentation slides demonstration. This is a four stage process. The stages in this process are product, sales in percentage, finance, marketing.

Line Bubble Chart Ppt PowerPoint Presentation Professional Infographic Template
This is a line bubble chart ppt powerpoint presentation professional infographic template. This is a five stage process. The stages in this process are product, in price, highest sale, business, finance.

Monthly Social Media Dashboard Ppt PowerPoint Presentation Model Slide
This is a monthly social media dashboard ppt powerpoint presentation model slide. This is a four stage process. The stages in this process are sales, social events, business, finance, key social metrics.
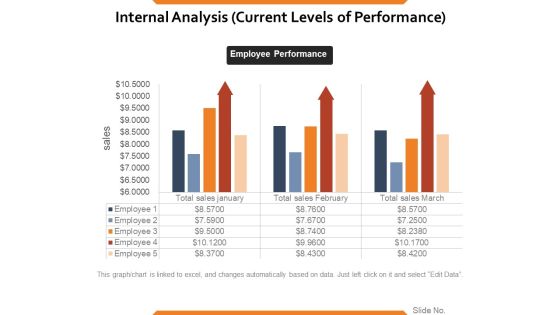
Internal Analysis Current Levels Of Performance Ppt PowerPoint Presentation Ideas Vector
This is a internal analysis current levels of performance ppt powerpoint presentation ideas vector. This is a three stage process. The stages in this process are sales, employee performance, business, finance, marketing.
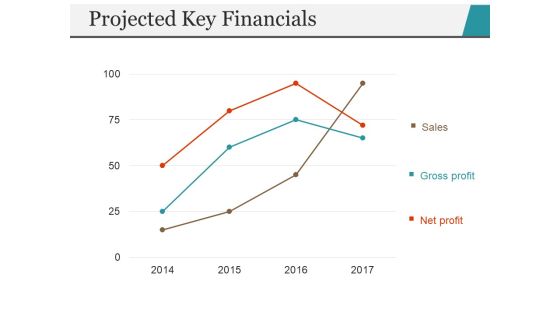
Projected Key Financials Template 2 Ppt PowerPoint Presentation Portfolio Inspiration
This is a projected key financials template 2 ppt powerpoint presentation portfolio inspiration. This is a three stage process. The stages in this process are sales, gross profit, net profit, year, finance.

Area Chart Ppt PowerPoint Presentation Slides Rules
This is a area chart ppt powerpoint presentation slides rules. This is a two stage process. The stages in this process are sales in percentage, business, marketing, product, finance.

Market Segmentation Evaluation Ppt PowerPoint Presentation Infographics Background
This is a market segmentation evaluation ppt powerpoint presentation infographics background. This is a two stage process. The stages in this process are market sales, net profit, icons, finance, business, marketing.

Area Stacked Ppt PowerPoint Presentation Diagram Images
This is a area stacked ppt powerpoint presentation diagram images. This is a two stage process. The stages in this process are sales in percentage, product, business, marketing, finance.

Clustered Column Ppt PowerPoint Presentation Slides Ideas
This is a clustered column ppt powerpoint presentation slides ideas. This is a two stage process. The stages in this process are sales in percentage, business, marketing, finance, graph.
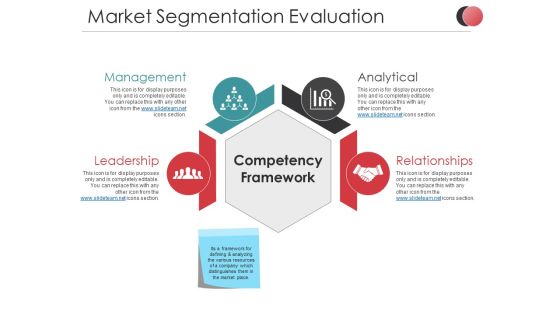
Market Segmentation Evaluation Ppt PowerPoint Presentation Summary Slideshow
This is a market segmentation evaluation ppt powerpoint presentation summary slideshow. This is a two stage process. The stages in this process are net profit, market sales, business, marketing, finance, icons.

Scatter Bubble Chart Ppt PowerPoint Presentation Infographic Template Examples
This is a scatter bubble chart ppt powerpoint presentation infographic template examples. This is a two stage process. The stages in this process are highest sale, product, in price, finance, business.

Area Chart Ppt PowerPoint Presentation Summary Objects
This is a area chart ppt powerpoint presentation summary objects. This is a two stage process. The stages in this process are product, sales in percentage, finance, business, marketing.

Bar Graph Ppt PowerPoint Presentation Gallery Grid
This is a bar graph ppt powerpoint presentation gallery grid. This is a three stage process. The stages in this process are sales in percentage, product, finance, business, marketing.
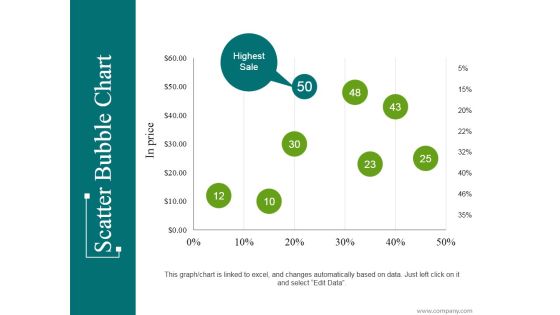
Scatter Bubble Chart Ppt PowerPoint Presentation Infographic Template Introduction
This is a scatter bubble chart ppt powerpoint presentation infographic template introduction. This is a eight stage process. The stages in this process are highest sale, business, marketing, percentage, finance.

Clustered Column Ppt PowerPoint Presentation Portfolio Smartart
This is a clustered column ppt powerpoint presentation portfolio smartart. This is a two stage process. The stages in this process are financial year, product, sales in percentage, finance, business, graph.

Scatter Chart Ppt PowerPoint Presentation Summary Visuals
This is a scatter chart ppt powerpoint presentation summary visuals. This is a eight stage process. The stages in this process are product, profit in sales, in percentage, finance, business.
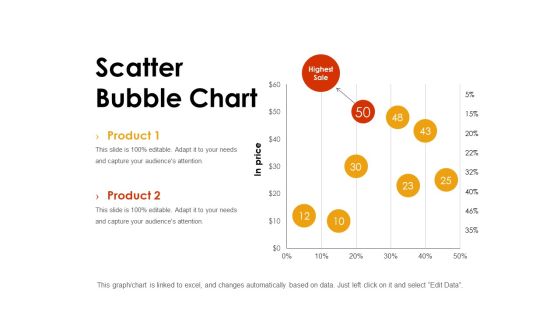
Scatter Bubble Chart Ppt PowerPoint Presentation Styles Background
This is a scatter bubble chart ppt powerpoint presentation styles background. This is a two stage process. The stages in this process are chart, in price, highest sale, finance, marketing.

Area Chart Ppt PowerPoint Presentation Professional Brochure
This is a area chart ppt powerpoint presentation professional brochure. This is a two stage process. The stages in this process are sales in percentage, business, marketing, finance, graph.

Bar Chart Ppt PowerPoint Presentation Portfolio Diagrams
This is a bar chart ppt powerpoint presentation portfolio diagrams. This is a three stage process. The stages in this process are sales in percentage, business, marketing, graph, finance.

Area Chart Ppt PowerPoint Presentation Model Influencers
This is a area chart ppt powerpoint presentation model influencers. This is a two stage process. The stages in this process are sales in percentage, chart, business, marketing, finance.

Area Chart Ppt PowerPoint Presentation Summary Show
This is a area chart ppt powerpoint presentation summary show. This is a two stage process. The stages in this process are sales in percentage, financial year, business, marketing, finance.

Area Chart Ppt PowerPoint Presentation Portfolio Templates
This is a area chart ppt powerpoint presentation portfolio templates. This is a two stage process. The stages in this process are sales in percentage, chart, business, marketing, finance.
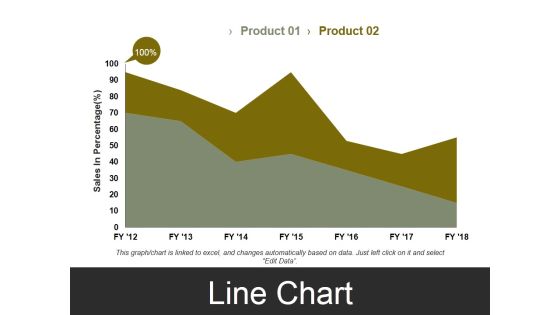
Line Chart Template 3 Ppt PowerPoint Presentation Styles Visual Aids
This is a line chart template 3 ppt powerpoint presentation styles visual aids. This is a two stage process. The stages in this process are sales in percentage, business, marketing, finance, graph.

Bar Chart Ppt PowerPoint Presentation Icon Layout
This is a bar chart ppt powerpoint presentation icon layout. This is a one stage process. The stages in this process are sales in percentage, financial years, bar chart, finance, marketing.

clustered column line ppt powerpoint presentation ideas example
This is a clustered column line ppt powerpoint presentation ideas example. This is a three stage process. The stages in this process are sales in percentage, business, marketing, finance, graph.

Clustered Column Chart Ppt PowerPoint Presentation Show Slideshow
This is a clustered column chart ppt powerpoint presentation show slideshow. This is a six stage process. The stages in this process are financial year in, sales in percentage, business, marketing, finance.

Clustered Column Ppt PowerPoint Presentation Gallery Structure
This is a clustered column ppt powerpoint presentation gallery structure. This is a two stage process. The stages in this process are product, sales in percentage, financial year, bar graph, finance.
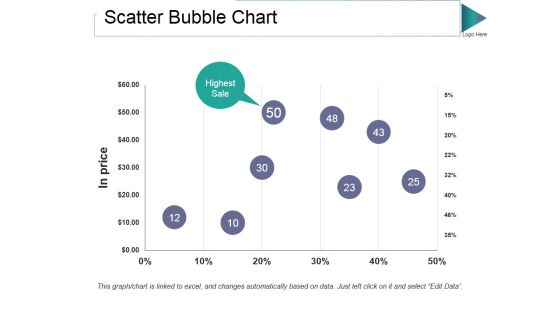
Scatter Bubble Chart Ppt PowerPoint Presentation Gallery Guidelines
This is a scatter bubble chart ppt powerpoint presentation gallery guidelines. This is a one stage process. The stages in this process are in price, highest sale, percentage, finance, business.

Bar Chart Ppt PowerPoint Presentation Outline Backgrounds
This is a bar chart ppt powerpoint presentation outline backgrounds. This is a one stage process. The stages in this process are sales in percentage, financial years, product, bar graph, finance.

Area Chart Ppt PowerPoint Presentation Model Slides
This is a area chart ppt powerpoint presentation model slides. This is a two stage process. The stages in this process are business, marketing, sales in percentage, chart, percentage, finance.

Area Chart Ppt PowerPoint Presentation File Visuals
This is a area chart ppt powerpoint presentation file visuals. This is a two stage process. The stages in this process are business, sales in percentage, marketing, graph, strategy, finance.

Bar Chart Ppt PowerPoint Presentation Summary File Formats
This is a bar chart ppt powerpoint presentation summary file formats. This is a two stage process. The stages in this process are business, finance, financial years, sales in percentage, graph.
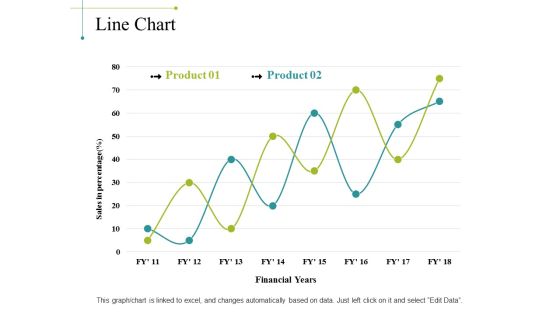
Line Chart Ppt PowerPoint Presentation Portfolio Background Image
This is a line chart ppt powerpoint presentation portfolio background image. This is a two stage process. The stages in this process are sales in percentage, financial years, chart, business, marketing, finance.

Area Chart Ppt PowerPoint Presentation Ideas Professional
This is a area chart ppt powerpoint presentation ideas professional. This is a two stage process. The stages in this process are business, sales in percentage, area chart, marketing, finance.

Combo Chart Ppt PowerPoint Presentation Gallery Design Ideas
This is a combo chart ppt powerpoint presentation gallery design ideas. This is a three stage process. The stages in this process are business, financial years, sales in percentage, finance, graph.

Bar Chart Ppt PowerPoint Presentation Layouts Template
This is a bar chart ppt powerpoint presentation layouts template. This is a two stage process. The stages in this process are financial year, sales in percentage, business, marketing, finance.

Bar Graph Ppt PowerPoint Presentation Layouts Influencers
This is a bar graph ppt powerpoint presentation layouts influencers. This is a two stage process. The stages in this process are business, marketing, in bar graph, sales in percentage, finance.

Area Chart Ppt PowerPoint Presentation Inspiration Background Designs
This is a area chart ppt powerpoint presentation inspiration background designs. This is a two stage process. The stages in this process are business, sales in percentage, area chart, marketing, finance.
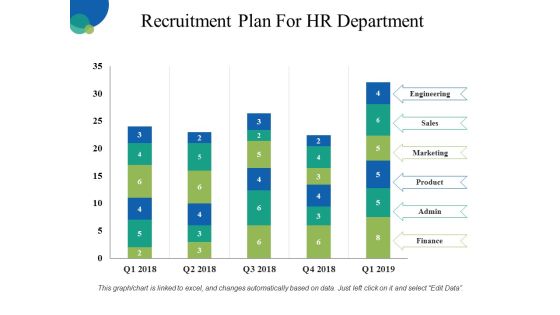
Recruitment Plan For HR Department Ppt PowerPoint Presentation Inspiration Layout Ideas
This is a recruitment plan for hr department ppt powerpoint presentation inspiration layout ideas. This is a five stage process. The stages in this process are engineering, sales, marketing, product, finance.

Area Chart Ppt PowerPoint Presentation Infographics Guide
This is a area chart ppt powerpoint presentation infographics guide. This is a two stage process. The stages in this process are area chart, product, sales in percentage, finance, business.
 Home
Home