AI PPT Maker
Templates
PPT Bundles
Design Services
Business PPTs
Business Plan
Management
Strategy
Introduction PPT
Roadmap
Self Introduction
Timelines
Process
Marketing
Agenda
Technology
Medical
Startup Business Plan
Cyber Security
Dashboards
SWOT
Proposals
Education
Pitch Deck
Digital Marketing
KPIs
Project Management
Product Management
Artificial Intelligence
Target Market
Communication
Supply Chain
Google Slides
Research Services
 One Pagers
All Categories
-
Home
- Customer Favorites
- Trade Finance
Trade Finance

Revenue Generation Opportunity For Soft Drinks Capital Raising Pitch Deck Ppt Infographic Template Slides PDF
Revenue generation opportunities is key aspect of pitch deck as it displays the major market opportunity from where the organization can generate revenues in the future. The provided slide highlights 3 major revenue generation opportunity, these are direct sales to customer, bulk sales on online platforms and partnership opportunity with food chain. Deliver an awe inspiring pitch with this creative revenue generation opportunity for soft drinks capital raising pitch deck ppt infographic template slides pdf bundle. Topics like revenue generation 2021, online store, food chain partnership, retail stores can be discussed with this completely editable template. It is available for immediate download depending on the needs and requirements of the user.
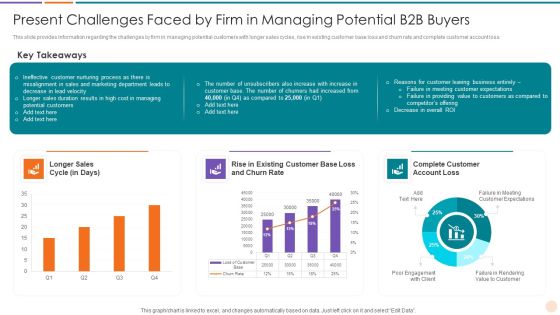
Improving Lead Generation Present Challenges Faced By Firm In Managing Potential Introduction PDF
This slide provides information regarding the challenges by firm in managing potential customers with longer sales cycles, rise in existing customer base loss and churn rate and complete customer account loss. Deliver an awe inspiring pitch with this creative improving lead generation present challenges faced by firm in managing potential introduction pdf bundle. Topics like longer sales, cycle rise existing, customer base loss and churn rate, complete customer, account loss can be discussed with this completely editable template. It is available for immediate download depending on the needs and requirements of the user.
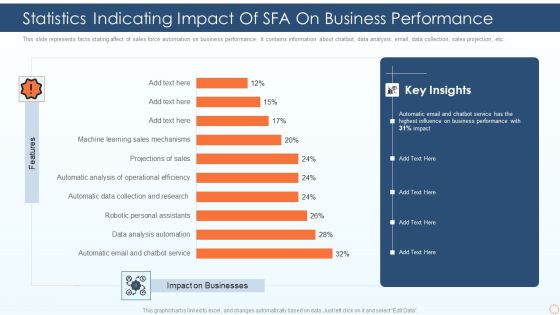
Statistics Indicating Impact Of SFA On Business Performance Ppt PowerPoint Presentation Gallery Outfit PDF
This slide represents facts stating affect of sales force automation on business performance. It contains information about chatbot, data analysis, email, data collection, sales projection, etc. Pitch your topic with ease and precision using this statistics indicating impact of sfa on business performance ppt powerpoint presentation gallery outfit pdf. This layout presents information on automatic email and chatbot service, data analysis automation, robotic personal assistants. It is also available for immediate download and adjustment. So, changes can be made in the color, design, graphics or any other component to create a unique layout.

Designing And Deployment CRM Implementation Dashboard With Customer Satisfaction Clipart PDF
This slide showcases the dashboard for CRM which includes the revenue, marketing expenses, satisfaction rate, conversion funnel, tickets volume by priority, and expected sales this year. Deliver an awe inspiring pitch with this creative designing and deployment crm implementation dashboard with customer satisfaction clipart pdf bundle. Topics like pipeline vs expected sales this year, revenue vs expense by month, customer satisfaction, conversion funnel, tickets volume by priority can be discussed with this completely editable template. It is available for immediate download depending on the needs and requirements of the user.
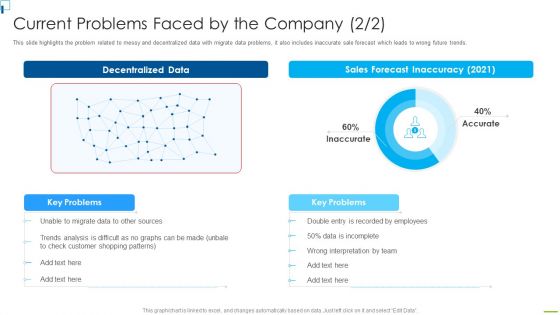
Designing And Deployment Current Problems Faced By The Company Portrait PDF
This slide highlights the problem related to messy and decentralized data with migrate data problems, it also includes inaccurate sale forecast which leads to wrong future trends. Deliver and pitch your topic in the best possible manner with this designing and deployment current problems faced by the company portrait pdf. Use them to share invaluable insights on decentralized data, sales forecast inaccuracy 2021, employees, trends analysis and impress your audience. This template can be altered and modified as per your expectations. So, grab it now.

Dashboard For Tracking Essential Marketing Activities Positive Marketing For Corporate Topics PDF
This slide covers information regarding the dashboard for tracking essential marketing activities in terms of total leads, email sent, sales ready leads, new customers and revenues, etc. Deliver and pitch your topic in the best possible manner with this dashboard for tracking essential marketing activities positive marketing for corporate topics pdf. Use them to share invaluable insights on total leads, sales ready leads, new customers, new revenue and impress your audience. This template can be altered and modified as per your expectations. So, grab it now.
Tracking Essential Retail Store Activities Dashboard Incorporation Of Experience Information PDF
This slide provides details regarding the dashboard for tracking retail store activities in terms of customer retention, rate of return, volume sales, etc. Deliver and pitch your topic in the best possible manner with this tracking essential retail store activities dashboard incorporation of experience information pdf. Use them to share invaluable insights on total volume sales, rate of return, customer retention, number of new and returning customers and impress your audience. This template can be altered and modified as per your expectations. So, grab it now.
Key Challenges Faced By The Company At Each Stage Icons PDF
This slide shows the major challenges faced by the company ate different stages of sales funnel. Key challenges mentioned in the slide are lengthy sales cycle, lack of qualified leads, low closing rate etc. Deliver an awe inspiring pitch with this creative Key Challenges Faced By The Company At Each Stage Icons PDF bundle. Topics like Key Challenges Faced By The Company At Each Stage can be discussed with this completely editable template. It is available for immediate download depending on the needs and requirements of the user.

Dashboard For Tracking Essential Marketing Activities Actively Influencing Customers Formats PDF
This slide covers information regarding the dashboard for tracking essential marketing activities in terms of total leads, email sent, sales ready leads, new customers and revenues, etc. Deliver and pitch your topic in the best possible manner with this Dashboard For Tracking Essential Marketing Activities Actively Influencing Customers Formats PDF. Use them to share invaluable insights on Total Leads, Sales Ready Leads, New Customers, New Revenue and impress your audience. This template can be altered and modified as per your expectations. So, grab it now.

Revenue Generation Opportunity For Carbonated Drinks Industry Elevator Pitch Microsoft PDF
Revenue generation opportunities is key aspect of pitch deck as it displays the major market opportunity from where the organization can generate revenues in the future. The provided slide highlights 3 major revenue generation opportunity, these are direct sales to customer, bulk sales on online platforms and partnership opportunity with food chain. Deliver an awe inspiring pitch with this creative Revenue Generation Opportunity For Carbonated Drinks Industry Elevator Pitch Microsoft PDF bundle. Topics like Understanding Revenue Opportunity, Partnership Opportunity, Food Chains can be discussed with this completely editable template. It is available for immediate download depending on the needs and requirements of the user.
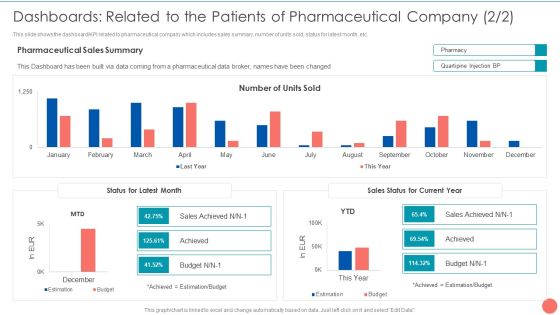
Tactics To Achieve Sustainability Dashboards Related To The Patients Of Pharmaceutical Company Mockup PDF
This slide shows the dashboard or KPI related to pharmaceutical company which includes sales summary, number of units sold, status for latest month, etc. Deliver and pitch your topic in the best possible manner with this Tactics To Achieve Sustainability Dashboards Related To The Patients Of Pharmaceutical Company Mockup PDF. Use them to share invaluable insights on Pharmaceutical Sales Summary, Number Units Sold, Status Latest Month and impress your audience. This template can be altered and modified as per your expectations. So, grab it now.

Clothing Business Market Entry Strategy Company Key Figures For Past 5 Years Infographics PDF
This slide covers the dashboard with major values for the last five years. It includes KPIs such as sales, net operating profit, sales by geographic areas, and number of employees. Deliver an awe inspiring pitch with this creative Clothing Business Market Entry Strategy Company Key Figures For Past 5 Years Infographics PDF bundle. Topics like Geographical Area, Operating Profit, Billions Of Euros can be discussed with this completely editable template. It is available for immediate download depending on the needs and requirements of the user.

KPI Dashboard Of Real Estate Customer Relationship Management Pictures PDF
This slide represents the dashboard generated through CRM software used in a real estate company. It shows details related to key performance metrics such as leads by source, closed and pending transactions, projected monthly sales volume etc. Showcasing this set of slides titled KPI Dashboard Of Real Estate Customer Relationship Management Pictures PDF. The topics addressed in these templates are Projected Monthly Sales Volume, Leads By Source, Annual Commissions. All the content presented in this PPT design is completely editable. Download it and make adjustments in color, background, font etc. as per your unique business setting.

Cosmetics And Skin Care Company Profile Market Share Comparison Slides PDF
This slide represents the comparison with competitors based on market share which shows our leading company with greatest share in US due to increased sales for skin care and makeup products, etc. Deliver an awe inspiring pitch with this creative Cosmetics And Skin Care Company Profile Market Share Comparison Slides PDF bundle. Topics like US Market Share, Competitor, Product Sales, Makeup Products can be discussed with this completely editable template. It is available for immediate download depending on the needs and requirements of the user.
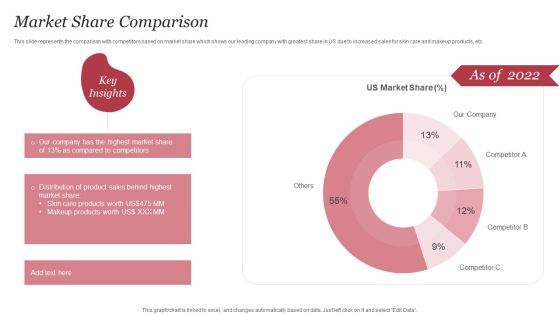
Personal Care Company Profile Market Share Comparison Ppt PowerPoint Presentation Gallery Deck PDF
This slide represents the comparison with competitors based on market share which shows our leading company with greatest share in US due to increased sales for skin care and makeup products, etc. Deliver an awe inspiring pitch with this creative Personal Care Company Profile Market Share Comparison Ppt PowerPoint Presentation Gallery Deck PDF bundle. Topics like US Market Share, Product Sales, Skin Care Products can be discussed with this completely editable template. It is available for immediate download depending on the needs and requirements of the user.

Fashion Marketing And Advertisement Analysis Dashboard Ppt PowerPoint Presentation Gallery Topics PDF
This slide defines the dashboard for fashion marketing and Advertisement revenue analysis . It includes information related to the revenue, sales, brands and gender breakdown. Pitch your topic with ease and precision using this Fashion Marketing And Advertisement Analysis Dashboard Ppt PowerPoint Presentation Gallery Topics PDF. This layout presents information on Total Revenue, Total Brands, Total Sales. It is also available for immediate download and adjustment. So, changes can be made in the color, design, graphics or any other component to create a unique layout.

Strategy Playbook For Ecommerce Business Statistics Associated With Global Ecommerce Growth Infographics PDF
This slide provides information regarding statistics associated to ecommerce growth in terms of expected ecommerce sales, ecommerce share of retails sales, number of global internet users preferring products online on monthly basis, etc. Deliver and pitch your topic in the best possible manner with this Strategy Playbook For Ecommerce Business Statistics Associated With Global Ecommerce Growth Infographics PDF. Use them to share invaluable insights on Global Ecommerce, People Preferring, Ecommerce Share and impress your audience. This template can be altered and modified as per your expectations. So, grab it now.

Smarketing Alignment Technologies Used By Business Ppt Show Visual Aids PDF
This slide shows various technologies used by business which can be used in sales and marketing alignment. It includes digital asset management, content calendar artificial intelligence, etc. Showcasing this set of slides titled Smarketing Alignment Technologies Used By Business Ppt Show Visual Aids PDF. The topics addressed in these templates are Email Marketing, Sales Enablement Platform, Content Management. All the content presented in this PPT design is completely editable. Download it and make adjustments in color, background, font etc. as per your unique business setting.
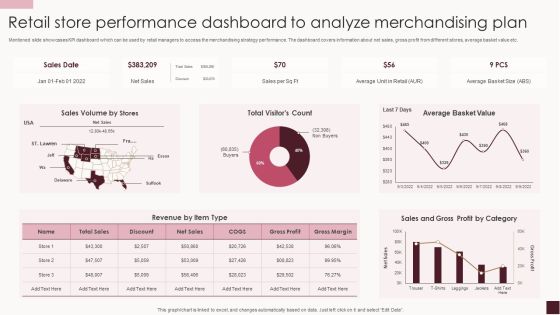
Retail Store Performance Dashboard To Analyze Merchandising Plan Structure PDF
Mentioned slide showcases KPI dashboard which can be used by retail managers to access the merchandising strategy performance. The dashboard covers information about net sales, gross profit from different stores, average basket value etc.Showcasing this set of slides titled Retail Store Performance Dashboard To Analyze Merchandising Plan Structure PDF. The topics addressed in these templates are Sales Volume, Average Basket, Gross Profit. All the content presented in this PPT design is completely editable. Download it and make adjustments in color, background, font etc. as per your unique business setting.

Annual B2C Business Review Dashboard Microsoft PDF
The following slide shows dashboard to help organizations arrange financial business indicators and communicate important companys information to key stakeholders. It includes sales, gross, operating and net profit and other major performance indicators. Showcasing this set of slides titled Annual B2C Business Review Dashboard Microsoft PDF. The topics addressed in these templates are Gross Profit, Sales, Operating Profit. All the content presented in this PPT design is completely editable. Download it and make adjustments in color, background, font etc. as per your unique business setting.

Commodity Marketing KPI Dashboard For International Business Expansion Formats PDF
This slide signifies the product marketing key performance indicator dashboard for international business expansion. It covers information about sales, target, target achievement, gross profit margin, sales by region, growth and inventory outstanding.Pitch your topic with ease and precision using this Commodity Marketing KPI Dashboard For International Business Expansion Formats PDF. This layout presents information on Target Achievement, Receivale Days, Gross Profit. It is also available for immediate download and adjustment. So, changes can be made in the color, design, graphics or any other component to create a unique layout.
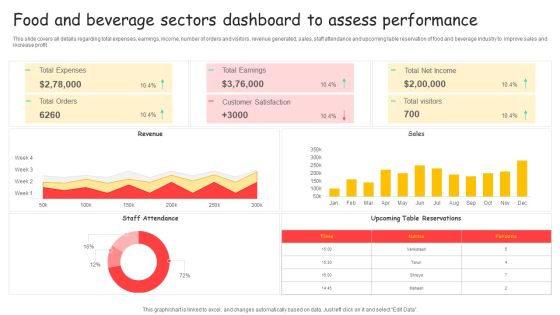
Food And Beverage Sectors Dashboard To Assess Performance Ppt Styles Elements PDF
This slide covers all details regarding total expenses, earnings, income, number of orders and visitors, revenue generated, sales, staff attendance and upcoming table reservation of food and beverage industry to improve sales and increase profit. Showcasing this set of slides titled Food And Beverage Sectors Dashboard To Assess Performance Ppt Styles Elements PDF. The topics addressed in these templates are Total Expenses, Total Earnings, Total Net Income. All the content presented in this PPT design is completely editable. Download it and make adjustments in color, background, font etc. as per your unique business setting.
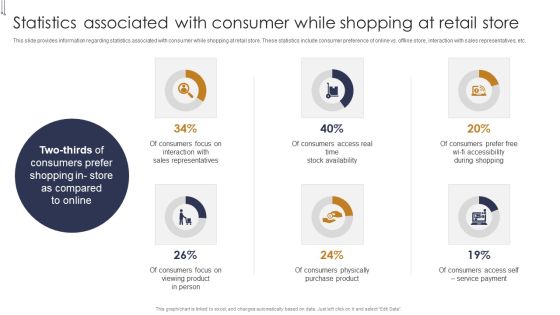
Statistics Associated With Consumer While Shopping Buyers Preference Management Playbook Microsoft PDF
This slide provides information regarding statistics associated with consumer while shopping at retail store. These statistics include consumer preference of online vs. offline store, interaction with sales representatives, etc. Deliver and pitch your topic in the best possible manner with this Statistics Associated With Consumer While Shopping Buyers Preference Management Playbook Microsoft PDF. Use them to share invaluable insights on Sales Representatives, Stock Availability, During Shopping and impress your audience. This template can be altered and modified as per your expectations. So, grab it now.
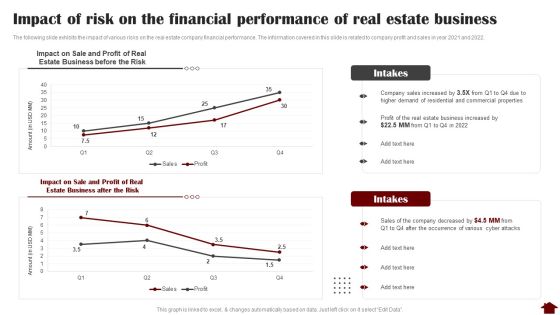
Impact Of Risk On The Financial Performance Of Real Estate Business Graphics PDF
The following slide exhibits the impact of various risks on the real estate company financial performance. The information covered in this slide is related to company profit and sales in year 2021 and 2022. Deliver an awe inspiring pitch with this creative Impact Of Risk On The Financial Performance Of Real Estate Business Graphics PDF bundle. Topics like Sale And Profit, Estate Business, Risk can be discussed with this completely editable template. It is available for immediate download depending on the needs and requirements of the user.

Business To Business Model Lead Management Dashboard Ppt Portfolio Backgrounds PDF
This slide showcases business to business b2b lead management dashboard. It provides information about lead funnel, pipeline, sales, opportunities, campaign, status, primary offer, etc. Pitch your topic with ease and precision using this Business To Business Model Lead Management Dashboard Ppt Portfolio Backgrounds PDF. This layout presents information on Leads Generated, Pipeline Generated, Sales Generated, Opportunities. It is also available for immediate download and adjustment. So, changes can be made in the color, design, graphics or any other component to create a unique layout.

Quarterly Business Performance Assessment And Evaluation Of A Manufacturing Firm Inspiration PDF
This slide includes Quarterly Business Review of a company. It gives an account of sales of Product A, Product B, Product C and Product D, respectively with trend analysis of revenues generated. Showcasing this set of slides titled Quarterly Business Performance Assessment And Evaluation Of A Manufacturing Firm Inspiration PDF. The topics addressed in these templates are Quarterly Business Analysis, Product, Sales. All the content presented in this PPT design is completely editable. Download it and make adjustments in color, background, font etc. as per your unique business setting.

KPI Dashboard Highlighting Results Of Multichannel Retail Marketing Rules PDF
The purpose of this slide is to highlight a comprehensive dashboard of omnichannel retail. The key metrics covered in the slide are types of marketing channels, comparison of channels for two different years, transactions by months etc. Pitch your topic with ease and precision using this KPI Dashboard Highlighting Results Of Multichannel Retail Marketing Rules PDF. This layout presents information on Comparison Of Channel Sales, Percentage Of Sales, Transactions By Month. It is also available for immediate download and adjustment. So, changes can be made in the color, design, graphics or any other component to create a unique layout.

COVID Impact Analysis On Business Outcomes Stats Ppt Layouts Introduction PDF
This slide depicts impact of corona virus on various issues faced by small, medium scale enterprises. It includes overview of disruptions such as employee absenteeism, supply chain, transportation, financial instability, profit reduction, decrease in sales, demand reduction, etc. Showcasing this set of slides titled COVID Impact Analysis On Business Outcomes Stats Ppt Layouts Introduction PDF. The topics addressed in these templates are Reduction Sales, Reduction Profit, Reduction Production. All the content presented in this PPT design is completely editable. Download it and make adjustments in color, background, font etc. as per your unique business setting.

Real Estate Firm Web Based Platform Dashboard Background PDF
This slide shows realtor service web panel dashboard. It provides information about properties for sale, sites for rent, total customers, cities, revenue, sites viewed, listings, reviews, etc. Pitch your topic with ease and precision using this Real Estate Firm Web Based Platform Dashboard Background PDF. This layout presents information on Total Revenue, Rental Locations, Properties For Sale. It is also available for immediate download and adjustment. So, changes can be made in the color, design, graphics or any other component to create a unique layout.
Six Months Business Valuation Chart Ppt Styles Icons PDF
This slide shows the 6 months graph to measure company valuation. It is representing that highest valuation of company was calculated in the month of June due to increase in sales. Pitch your topic with ease and precision using this Six Months Business Valuation Chart Ppt Styles Icons PDF. This layout presents information on Increase Sales, Company Valuation. It is also available for immediate download and adjustment. So, changes can be made in the color, design, graphics or any other component to create a unique layout.

Retail B2C Ecommerce Selling Forecasts Graph Portrait PDF
This slide depicts sales projections for both retail and ecommerce stores. It includes sales projections for brick and mortar and retail ecommerce stores for period of six years. Pitch your topic with ease and precision using this Retail B2C Ecommerce Selling Forecasts Graph Portrait PDF. This layout presents information on Retail B2C Ecommerce, Selling Forecasts Graph. It is also available for immediate download and adjustment. So, changes can be made in the color, design, graphics or any other component to create a unique layout.

Curastory Editing Platform Pitch Deck Customer Acquisition Channels With CLTV And CAC Themes PDF
This slide highlights the customer acquisition channels which includes sales inbound outbound, network including referrals and word of month and content marketing. Make sure to capture your audiences attention in your business displays with our gratis customizable Curastory Editing Platform Pitch Deck Customer Acquisition Channels With CLTV And CAC Themes PDF. These are great for business strategies, office conferences, capital raising or task suggestions. If you desire to acquire more customers for your tech business and ensure they stay satisfied, create your own sales presentation with these plain slides.
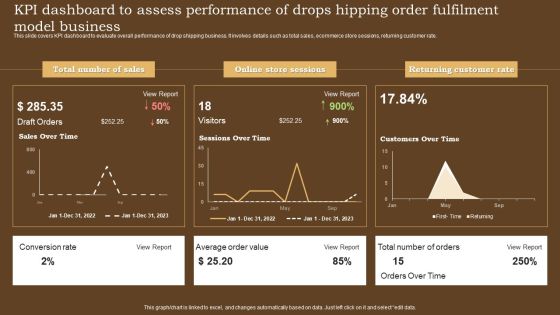
KPI Dashboard To Assess Performance Of Drops Hipping Order Fulfilment Model Business Themes PDF
This slide covers KPI dashboard to evaluate overall performance of drop shipping business. It involves details such as total sales, ecommerce store sessions, returning customer rate. Showcasing this set of slides titled KPI Dashboard To Assess Performance Of Drops Hipping Order Fulfilment Model Business Themes PDF. The topics addressed in these templates are Total Number Of Sales, Online Store Sessions, Returning Customer Rate. All the content presented in this PPT design is completely editable. Download it and make adjustments in color, background, font etc. as per your unique business setting.

Improving Corporate Performance Overview Of Financial Loss Incurred By The Firm Due Ideas PDF
Mentioned slide displays informational stats about financial loss incurred by the firm caused due to risk events. Risk event categories covered in the slide are sales practices, fraud activities, technology failure and natural disaster. Make sure to capture your audiences attention in your business displays with our gratis customizable Improving Corporate Performance Overview Of Financial Loss Incurred By The Firm Due Ideas PDF. These are great for business strategies, office conferences, capital raising or task suggestions. If you desire to acquire more customers for your tech business and ensure they stay satisfied, create your own sales presentation with these plain slides.
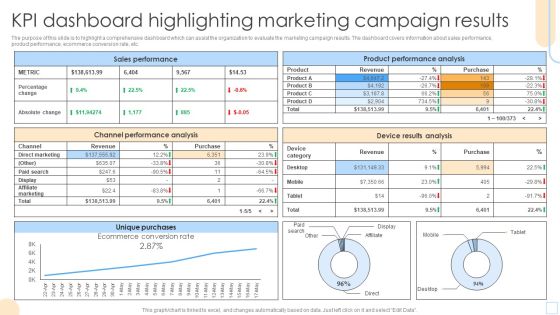
KPI Dashboard Highlighting Marketing Campaign Results Mockup PDF
The purpose of this slide is to highlight a comprehensive dashboard which can assist the organization to evaluate the marketing campaign results. The dashboard covers information about sales performance, product performance, ecommerce conversion rate, etc. Showcasing this set of slides titled KPI Dashboard Highlighting Marketing Campaign Results Mockup PDF. The topics addressed in these templates are Sales Performance, Product Performance Analysis. All the content presented in this PPT design is completely editable. Download it and make adjustments in color, background, font etc. as per your unique business setting.
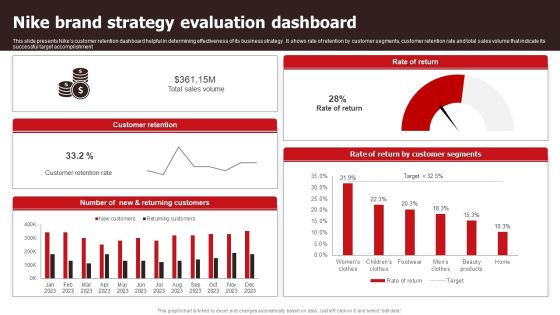
Nike Brand Strategy Evaluation Dashboard Sample PDF
This slide presents Nikes customer retention dashboard helpful in determining effectiveness of its business strategy . It shows rate of retention by customer segments, customer retention rate and total sales volume that indicate its successful target accomplishment. Showcasing this set of slides titled Nike Brand Strategy Evaluation Dashboard Sample PDF. The topics addressed in these templates are Sales Volume, Customer Retention Rate . All the content presented in this PPT design is completely editable. Download it and make adjustments in color, background, font etc. as per your unique business setting.
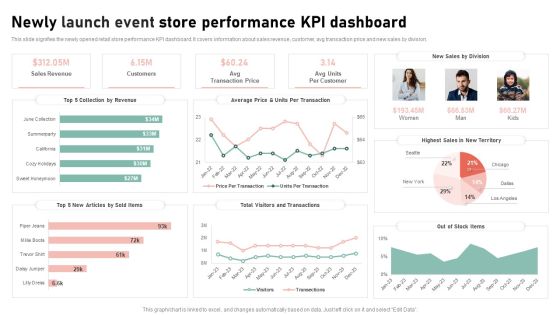
Newly Launch Event Store Performance Kpi Dashboard Elements Sample PDF
This slide signifies the newly opened retail store performance KPI dashboard. It covers information about sales revenue, customer, avg transaction price and new sales by division. Pitch your topic with ease and precision using this Newly Launch Event Store Performance Kpi Dashboard Elements Sample PDF. This layout presents information on Collection By Revenue, Articles By Sold Items, Visitors And Transactions. It is also available for immediate download and adjustment. So, changes can be made in the color, design, graphics or any other component to create a unique layout.
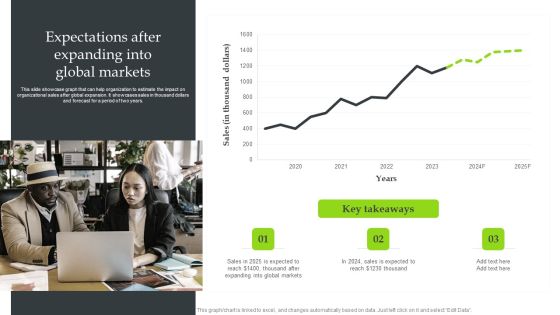
Expansion Strategic Plan Expectations After Expanding Into Global Markets Graphics PDF
This slide showcase graph that can help organization to estimate the impact on organizational sales after global expansion. It showcases sales in thousand dollars and forecast for a period of two years. From laying roadmaps to briefing everything in detail, our templates are perfect for you. You can set the stage with your presentation slides. All you have to do is download these easy-to-edit and customizable templates. Expansion Strategic Plan Expectations After Expanding Into Global Markets Graphics PDF will help you deliver an outstanding performance that everyone would remember and praise you for. Do download this presentation today.
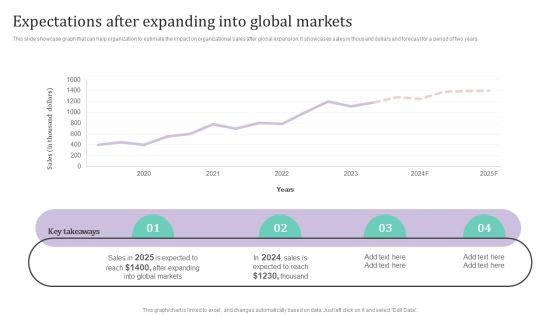
Expectations After Expanding Into Global Markets Ppt PowerPoint Presentation Diagram Lists PDF
This slide showcase graph that can help organization to estimate the impact on organizational sales after global expansion. It showcases sales in thousand dollars and forecast for a period of two years.Want to ace your presentation in front of a live audience Our Expectations After Expanding Into Global Markets Ppt PowerPoint Presentation Diagram Lists PDF can help you do that by engaging all the users towards you.. Slidegeeks experts have put their efforts and expertise into creating these impeccable powerpoint presentations so that you can communicate your ideas clearly. Moreover, all the templates are customizable, and easy-to-edit and downloadable. Use these for both personal and commercial use.

Strategic Global Expansion Business Plan Expectations After Expanding Into Global Markets Brochure PDF
This slide showcase graph that ca help organization to estimate the impact on organizational sales after global expansion. It showcases sales in thousand dollars and forecast for a period of two years. There are so many reasons you need a Strategic Global Expansion Business Plan Expectations After Expanding Into Global Markets Brochure PDF. The first reason is you can not spend time making everything from scratch, Thus, Slidegeeks has made presentation templates for you too. You can easily download these templates from our website easily.

Amazon Tactical Plan KPI Dashboard To Track Amazon Performance Clipart PDF
This slide provides information regarding dashboard to monitor Amazon performance. The KPIs include tracking of product sales, conversion rate, advertising spends, session, organic sales, etc. The Amazon Tactical Plan KPI Dashboard To Track Amazon Performance Clipart PDF is a compilation of the most recent design trends as a series of slides. It is suitable for any subject or industry presentation, containing attractive visuals and photo spots for businesses to clearly express their messages. This template contains a variety of slides for the user to input data, such as structures to contrast two elements, bullet points, and slides for written information. Slidegeeks is prepared to create an impression.

Car Manufacturing Organization Executive Report Background PDF
This slide illustrate overview of organization that design, develop, manufacture and distribute automotive components. It includes elements such as overview, product, competitors, market share coverage, key facts, and sales growth chart. Pitch your topic with ease and precision using this Car Manufacturing Organization Executive Report Background PDF. This layout presents information on Competitors, Market Share Coverage, Sales Growth Chart. It is also available for immediate download and adjustment. So, changes can be made in the color, design, graphics or any other component to create a unique layout.

Fashion Clothing Brand Executive Report Download PDF
This slide illustrate descriptions of fashion and knitwear clothing brand that provide latest trend to end consumer. It includes elements such as overview, products, company stats, sales by geographical area, growth chart, CEO and founder. Pitch your topic with ease and precision using this Fashion Clothing Brand Executive Report Download PDF. This layout presents information on Sales Contribution, Geographical Area, Growth Chart. It is also available for immediate download and adjustment. So, changes can be made in the color, design, graphics or any other component to create a unique layout.

Overview Of Financial Loss Incurred By The Firm Due To Risk Events Ppt Examples PDF
Mentioned slide displays informational stats about financial loss incurred by the firm caused due to risk events. Risk event categories covered in the slide are sales practices, fraud activities, technology failure and natural disaster. Make sure to capture your audiences attention in your business displays with our gratis customizable Overview Of Financial Loss Incurred By The Firm Due To Risk Events Ppt Examples PDF. These are great for business strategies, office conferences, capital raising or task suggestions. If you desire to acquire more customers for your tech business and ensure they stay satisfied, create your own sales presentation with these plain slides.

Marcom Mix Strategy Impact On Business Revenue Themes PDF
Mentioned slide showcases statistical data on promotional mix used by business to determine business sales growth. It includes promotional mix such as social media, email marketing, word of mouth, promotional campaign, advertisement, etc. Showcasing this set of slides titled Marcom Mix Strategy Impact On Business Revenue Themes PDF. The topics addressed in these templates are Social Media Marketing Led, Increase Sales, Email Marketing Led. All the content presented in this PPT design is completely editable. Download it and make adjustments in color, background, font etc. as per your unique business setting.

Business Intelligence Dashboard For Food And Beverage Industry Diagrams PDF
This slide showcases BI dashboard to track overall performance of business operations. It further includes elements such as sales, total transactions, non labor margin, expenses by category, etc. Pitch your topic with ease and precision using this Business Intelligence Dashboard For Food And Beverage Industry Diagrams PDF. This layout presents information on Expenses, Sales, Business Intelligence Dashboard. It is also available for immediate download and adjustment. So, changes can be made in the color, design, graphics or any other component to create a unique layout.
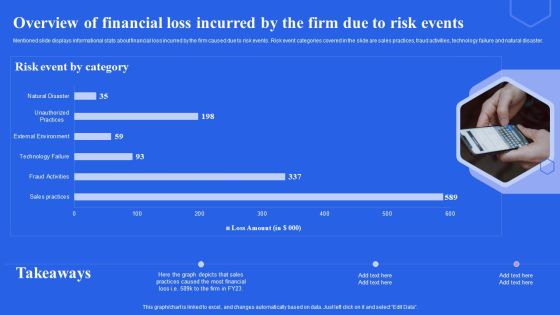
Overview Of Financial Loss Incurred By The Firm Due To Risk Events Ppt Infographics Slides PDF
Mentioned slide displays informational stats about financial loss incurred by the firm caused due to risk events. Risk event categories covered in the slide are sales practices, fraud activities, technology failure and natural disaster. Make sure to capture your audiences attention in your business displays with our gratis customizable Overview Of Financial Loss Incurred By The Firm Due To Risk Events Ppt Infographics Slides PDF. These are great for business strategies, office conferences, capital raising or task suggestions. If you desire to acquire more customers for your tech business and ensure they stay satisfied, create your own sales presentation with these plain slides.

Software Implementation Technique Key Performance Indicators Highlighting Current Problems Elements PDF
This slide represents the key performance indicators to track the problems faced by organization and draw effective strategies to tackle the problems. It includes key performance indicators of decline in organizational sales and customer engagement rate. Make sure to capture your audiences attention in your business displays with our gratis customizable Software Implementation Technique Key Performance Indicators Highlighting Current Problems Elements PDF. These are great for business strategies, office conferences, capital raising or task suggestions. If you desire to acquire more customers for your tech business and ensure they stay satisfied, create your own sales presentation with these plain slides.

Partner Relationship Management Impact On Business Revenue Summary PDF
Mentioned slide demonstrates statistics associated with business revenue earned by business and revenue influenced by partners. It includes key components such as yearly sales influenced by business, yearly sales influenced by partners. Create an editable Partner Relationship Management Impact On Business Revenue Summary PDF that communicates your idea and engages your audience. Whether you are presenting a business or an educational presentation, pre-designed presentation templates help save time. Partner Relationship Management Impact On Business Revenue Summary PDF is highly customizable and very easy to edit, covering many different styles from creative to business presentations. Slidegeeks has creative team members who have crafted amazing templates. So, go and get them without any delay.

E Mail Marketing User Business Data Portrait PDF
This slide shows data related to users of E-mail that can be used in framing E-Marketing strategy to convert leads into the sales. It include no of registered users, lead conversion rates and preference rate of users etc. Showcasing this set of slides titled E Mail Marketing User Business Data Portrait PDF. The topics addressed in these templates are Consumers Leads, Sales, Professional Mails. All the content presented in this PPT design is completely editable. Download it and make adjustments in color, background, font etc. as per your unique business setting.

Customer Experience Analysis Survey Outcome Percentage Portrait PDF
The following slide highlights percentage of results to analyze and enhance customer experience. It includes key elements such as customer experience with product, global net promoter score, regional sales agent performance, satisfaction channel, quarterly NPS, etc. Pitch your topic with ease and precision using this Customer Experience Analysis Survey Outcome Percentage Portrait PDF. This layout presents information on Customer Experience, Promoter Score, Regional Sales. It is also available for immediate download and adjustment. So, changes can be made in the color, design, graphics or any other component to create a unique layout.
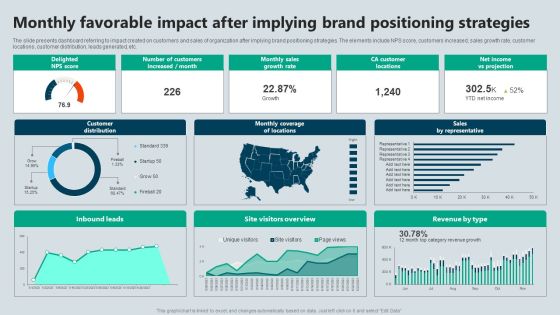
Monthly Favorable Impact After Implying Brand Positioning Strategies Demonstration PDF
The slide presents dashboard referring to impact created on customers and sales of organization after implying brand positioning strategies. The elements include NPS score, customers increased, sales growth rate, customer locations, customer distribution, leads generated, etc. Pitch your topic with ease and precision using this Monthly Favorable Impact After Implying Brand Positioning Strategies Demonstration PDF. This layout presents information on Strategies, Projection, Growth Rate. It is also available for immediate download and adjustment. So, changes can be made in the color, design, graphics or any other component to create a unique layout.

Post Implementation Total Number Of Passenger Kilometer Slides PDF
The slide provides six years graph 2021-2026 forecasted number of total passenger kilometers that travelers have covered through ABC railways trains. Additionally, it provides key details CAGR growth rate and key strategies and companys targets for 2024. Deliver an awe inspiring pitch with this creative post implementation total number of passenger kilometer slides pdf bundle. Topics like online sales channels, marketing strategy, investment strategy can be discussed with this completely editable template. It is available for immediate download depending on the needs and requirements of the user.

Agile Product Life Process Management Revenue Generation At Each Stage Of Product Lifecycle Icons PDF
This slide shows the revenue generation at each stage of product lifecycle which focuses on sales, profits, investments and losses at each stage such as introduction, growth, maturity and decline.Deliver and pitch your topic in the best possible manner with this agile product life process management revenue generation at each stage of product lifecycle icons pdf. Use them to share invaluable insights on revenue generation at each stage of product lifecycle and impress your audience. This template can be altered and modified as per your expectations. So, grab it now.
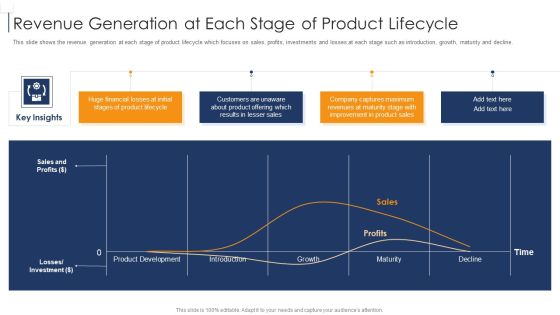
Product Lifecycle Management IT Revenue Generation At Each Stage Of Product Lifecycle Download PDF
This slide shows the revenue generation at each stage of product lifecycle which focuses on sales, profits, investments and losses at each stage such as introduction, growth, maturity and decline. Deliver and pitch your topic in the best possible manner with this product lifecycle management it revenue generation at each stage of product lifecycle download pdf. Use them to share invaluable insights on revenue generation at each stage of product lifecycle and impress your audience. This template can be altered and modified as per your expectations. So, grab it now.
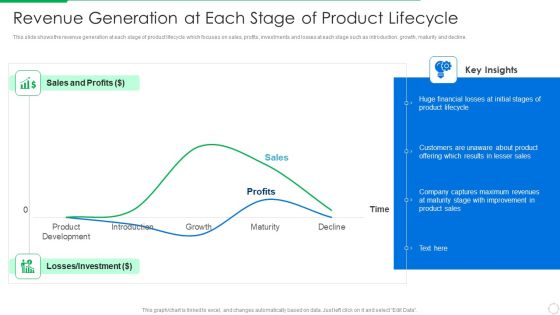
PLM Execution In Company Revenue Generation At Each Stage Of Product Lifecycle Information PDF
This slide shows the revenue generation at each stage of product lifecycle which focuses on sales, profits, investments and losses at each stage such as introduction, growth, maturity and decline. Deliver and pitch your topic in the best possible manner with this plm execution in company revenue generation at each stage of product lifecycle information pdf . Use them to share invaluable insights on revenue generation at each stage of product lifecycle and impress your audience. This template can be altered and modified as per your expectations. So, grab it now.

Retail Analytics Dashboard To Measure Merchandise Planning Effectiveness Microsoft PDF
This slide shows the retail analytics dashboard to measure merchandise planning effectiveness which includes conversion rate, sell through rate, return on investment, website traffic, abandonment rate, etc. Make sure to capture your audiences attention in your business displays with our gratis customizable Retail Analytics Dashboard To Measure Merchandise Planning Effectiveness Microsoft PDF. These are great for business strategies, office conferences, capital raising or task suggestions. If you desire to acquire more customers for your tech business and ensure they stay satisfied, create your own sales presentation with these plain slides.
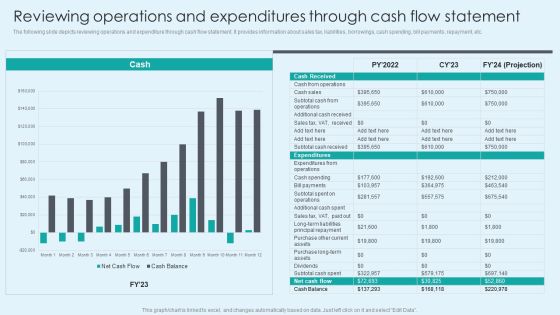
Reviewing Operations And Expenditures Through Cash Flow Statement Ideas PDF
The following slide depicts reviewing operations and expenditure through cash flow statement. It provides information about sales tax, liabilities, borrowings, cash spending, bill payments, repayment, etc. Boost your pitch with our creative Reviewing Operations And Expenditures Through Cash Flow Statement Ideas PDF. Deliver an awe-inspiring pitch that will mesmerize everyone. Using these presentation templates you will surely catch everyones attention. You can browse the ppts collection on our website. We have researchers who are experts at creating the right content for the templates. So you do not have to invest time in any additional work. Just grab the template now and use them.

Smart Manufacturing Dashboard To Track Production Quality Rules PDF
This slide represents smart manufacturing dashboard. It covers production volume, downtime causes, top product sold item, sales revenue, active machinery etc.Boost your pitch with our creative Smart Manufacturing Dashboard To Track Production Quality Rules PDF. Deliver an awe-inspiring pitch that will mesmerize everyone. Using these presentation templates you will surely catch everyones attention. You can browse the ppts collection on our website. We have researchers who are experts at creating the right content for the templates. So you do not have to invest time in any additional work. Just grab the template now and use them.

Stock Inventory Acquisition Inventory Forecasting For Seasonal Products Topics PDF
This slide showcases graph that can help organization to determine demand for seasonal products on the basis past sales data. It showcases data for past 2 financial years. Boost your pitch with our creative Stock Inventory Acquisition Inventory Forecasting For Seasonal Products Topics PDF. Deliver an awe-inspiring pitch that will mesmerize everyone. Using these presentation templates you will surely catch everyones attention. You can browse the ppts collection on our website. We have researchers who are experts at creating the right content for the templates. So you dont have to invest time in any additional work. Just grab the template now and use them.
