Track Record
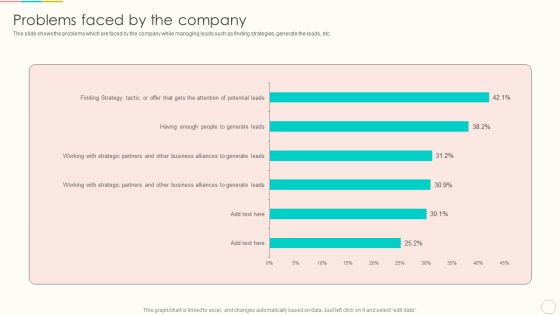
Lead Management To Engage Potential Customers Problems Faced By The Company Summary PDF
This slide shows the problems which are faced by the company while managing leads such as finding strategies, generate the leads, etc. Take your projects to the next level with our ultimate collection of Lead Management To Engage Potential Customers Problems Faced By The Company Summary PDF. Slidegeeks has designed a range of layouts that are perfect for representing task or activity duration, keeping track of all your deadlines at a glance. Tailor these designs to your exact needs and give them a truly corporate look with your own brand colors they will make your projects stand out from the rest.
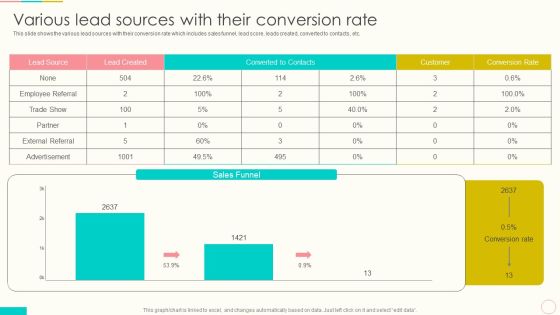
Lead Management To Engage Potential Customers Various Lead Sources With Their Conversion Rate Template PDF
This slide shows the various lead sources with their conversion rate which includes sales funnel, lead score, leads created, converted to contacts, etc. Take your projects to the next level with our ultimate collection of Lead Management To Engage Potential Customers Various Lead Sources With Their Conversion Rate Template PDF. Slidegeeks has designed a range of layouts that are perfect for representing task or activity duration, keeping track of all your deadlines at a glance. Tailor these designs to your exact needs and give them a truly corporate look with your own brand colors they will make your projects stand out from the rest.
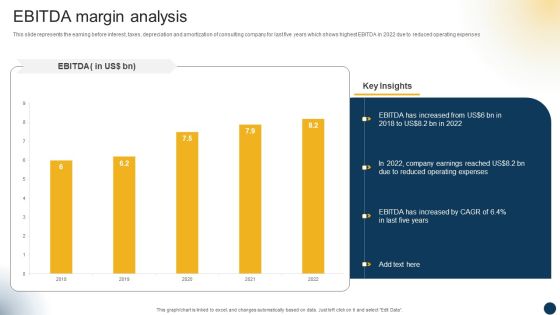
Organizational Advisory Solutions Business Profile EBITDA Margin Analysis Inspiration PDF
This slide represents the earning before interest, taxes, depreciation and amortization of consulting company for last five years which shows highest EBITDA in 2022 due to reduced operating expenses. Take your projects to the next level with our ultimate collection of Organizational Advisory Solutions Business Profile EBITDA Margin Analysis Inspiration PDF. Slidegeeks has designed a range of layouts that are perfect for representing task or activity duration, keeping track of all your deadlines at a glance. Tailor these designs to your exact needs and give them a truly corporate look with your own brand colors they will make your projects stand out from the rest.

Organizational Advisory Solutions Business Profile Research And Development R AND D Expenses Summary PDF
This slide shows the research and development expenses incurred by our company in last five years in various areas such as technological change, software implementation, etc. to improve productivity and reduce additional costs. Take your projects to the next level with our ultimate collection of Organizational Advisory Solutions Business Profile Research And Development R AND D Expenses Summary PDF. Slidegeeks has designed a range of layouts that are perfect for representing task or activity duration, keeping track of all your deadlines at a glance. Tailor these designs to your exact needs and give them a truly corporate look with your own brand colors they will make your projects stand out from the rest.
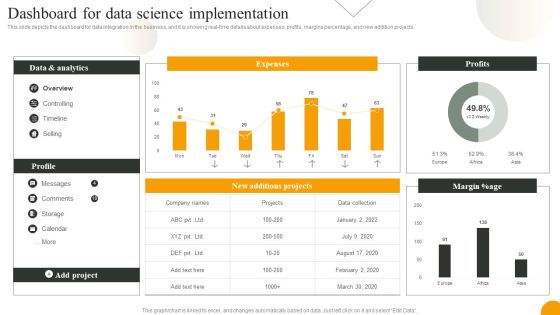
Using Data Science Technologies For Business Transformation Dashboard For Data Science Implementation Portrait PDF
This slide depicts the dashboard for data integration in the business, and it is showing real-time details about expenses, profits, margins percentage, and new addition projects. Take your projects to the next level with our ultimate collection of Using Data Science Technologies For Business Transformation Dashboard For Data Science Implementation Portrait PDF. Slidegeeks has designed a range of layouts that are perfect for representing task or activity duration, keeping track of all your deadlines at a glance. Tailor these designs to your exact needs and give them a truly corporate look with your own brand colors they will make your projects stand out from the rest.

Business Analytics Application Workforce Performance Analysis KPI Dashboard Template PDF
This slide represents the dashboard representing key metrics to analyze the performance of overall workforce. It includes details related to absence rate, benefits satisfaction, engagement index etc. Take your projects to the next level with our ultimate collection of Business Analytics Application Workforce Performance Analysis KPI Dashboard Template PDF. Slidegeeks has designed a range of layouts that are perfect for representing task or activity duration, keeping track of all your deadlines at a glance. Tailor these designs to your exact needs and give them a truly corporate look with your own brand colors theyll make your projects stand out from the rest.

Analyzing Top Reasons For Product Creating And Offering Multiple Product Ranges In New Business Designs PDF
This slide displays various reasons that may contribute to product portfolio failure in new region. Most contributing factor is unclear or continuously changing product definitions which contribute 42 precent to product failure.Take your projects to the next level with our ultimate collection of Analyzing Top Reasons For Product Creating And Offering Multiple Product Ranges In New Business Designs PDF. Slidegeeks has designed a range of layouts that are perfect for representing task or activity duration, keeping track of all your deadlines at a glance. Tailor these designs to your exact needs and give them a truly corporate look with your own brand colors they all make your projects stand out from the rest.

Account Based Marketing Customer Engagement Dashboard Demonstration PDF
Purpose of the following slide is to show key metrics that can help the organization to track their account based marketing efforts, it highlights essential KPIs such as CTR, session by account.Find a pre-designed and impeccable Account Based Marketing Customer Engagement Dashboard Demonstration PDF. The templates can ace your presentation without additional effort. You can download these easy-to-edit presentation templates to make your presentation stand out from others. So, what are you waiting for Download the template from Slidegeeks today and give a unique touch to your presentation.

Conversational Marketing Dashboard For B2B And B2C Organization Mockup PDF
Purpose of the following slide is to show key metrics that can help the organization to track conversational marketing efforts, it highlights essential KPIs such as subscribers, e-mail sent, sessions through link sent on e-mail. If your project calls for a presentation, then Slidegeeks is your go-to partner because we have professionally designed, easy-to-edit templates that are perfect for any presentation. After downloading, you can easily edit Conversational Marketing Dashboard For B2B And B2C Organization Mockup PDF and make the changes accordingly. You can rearrange slides or fill them with different images. Check out all the handy templates.
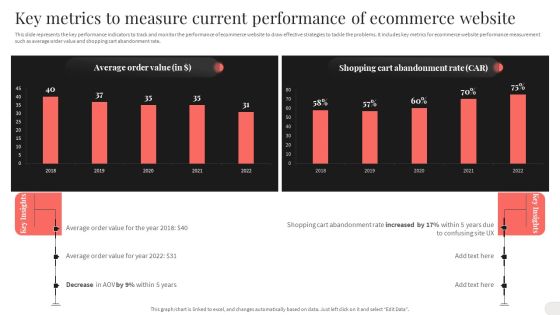
Key Metrics To Measure Current Performance Of Ecommerce Website Structure PDF
This slide represents the key performance indicators to track and monitor the performance of ecommerce website to draw effective strategies to tackle the problems. It includes key metrics for ecommerce website performance measurement such as average order value and shopping cart abandonment rate. There are so many reasons you need a Key Metrics To Measure Current Performance Of Ecommerce Website Structure PDF. The first reason is you can not spend time making everything from scratch, Thus, Slidegeeks has made presentation templates for you too. You can easily download these templates from our website easily.
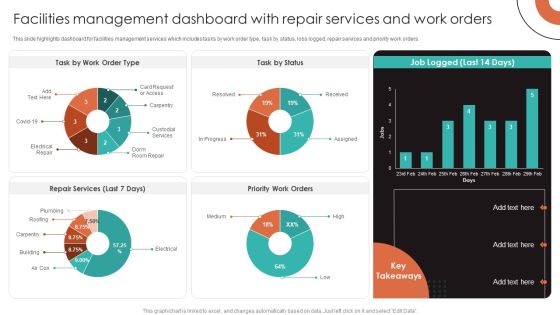
Facilities Management Dashboard With Repair Services And Work Orders Background PDF
This slide highlights dashboard for facilities management services which includes tasks by work order type, task by status, lobs logged, repair services and priority work orders. Take your projects to the next level with our ultimate collection of Facilities Management Dashboard With Repair Services And Work Orders Background PDF. Slidegeeks has designed a range of layouts that are perfect for representing task or activity duration, keeping track of all your deadlines at a glance. Tailor these designs to your exact needs and give them a truly corporate look with your own brand colors they will make your projects stand out from the rest.

Nielsen Business Profile Revenue Growth Trend In Q4 And Fy21 Ppt PowerPoint Presentation File Show PDF
This slide highlights the Nielsen company organic currency and organic constant currency growth trend. It also includes the full year revenue growth for measurement and content. Take your projects to the next level with our ultimate collection of Nielsen Business ProfiNielsen Business Profile Revenue Growth Trend In Q4 And Fy21 Ppt PowerPoint Presentation File Show PDF. Slidegeeks has designed a range of layouts that are perfect for representing task or activity duration, keeping track of all your deadlines at a glance. Tailor these designs to your exact needs and give them a truly corporate look with your own brand colors they will make your projects stand out from the rest.
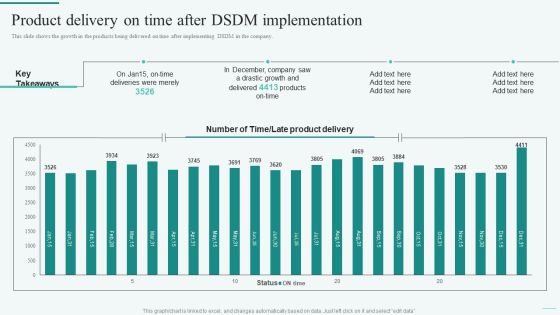
Product Delivery On Time After DSDM Implementation Integration Of Dynamic System To Enhance Processes Mockup PDF
This slide shows the growth in the products being delivered on time after implementing DSDM in the company.Take your projects to the next level with our ultimate collection of Product Delivery On Time After DSDM Implementation Integration Of Dynamic System To Enhance Processes Mockup PDF. Slidegeeks has designed a range of layouts that are perfect for representing task or activity duration, keeping track of all your deadlines at a glance. Tailor these designs to your exact needs and give them a truly corporate look with your own brand colors they all make your projects stand out from the rest.

Evaluating Failure Rate Of Equity Crowdfunding Developing Fundraising Techniques Pictures PDF
This slide showcases capital structure of organization that is used to finance the companys assets and operations. It showcases amount of money raised from different sources such as debt, equity capital and various other sources.Take your projects to the next level with our ultimate collection of Evaluating Failure Rate Of Equity Crowdfunding Developing Fundraising Techniques Pictures PDF. Slidegeeks has designed a range of layouts that are perfect for representing task or activity duration, keeping track of all your deadlines at a glance. Tailor these designs to your exact needs and give them a truly corporate look with your own brand colors they all make your projects stand out from the rest.

Guide To Mergers And Acquisitions Post Merger And Acquisition Performance Gap Assessment Template PDF
Following slide shows the comparison of current versus target capabilities of the firm post merger and acquisition. It includes information about the companys score as well as a performance rating. Take your projects to the next level with our ultimate collection of Guide To Mergers And Acquisitions Post Merger And Acquisition Performance Gap Assessment Template PDF. Slidegeeks has designed a range of layouts that are perfect for representing task or activity duration, keeping track of all your deadlines at a glance. Tailor these designs to your exact needs and give them a truly corporate look with your own brand colors they will make your projects stand out from the rest.

Promotion Strategies For New Service Launch Global Market Sizing For New Service Infographics PDF
This slide showcases market sizing that can help organization to estimate the profit and revenue potential before launching new service. Its key components are market size, estimated growth and target market. Take your projects to the next level with our ultimate collection of Promotion Strategies For New Service Launch Global Market Sizing For New Service Infographics PDF. Slidegeeks has designed a range of layouts that are perfect for representing task or activity duration, keeping track of all your deadlines at a glance. Tailor these designs to your exact needs and give them a truly corporate look with your own brand colors they will make your projects stand out from the rest.

Information Technology Operations Operations Dashboard For Issues Management Infographics PDF
The slide illustrates various KPIs to manage and track IT operations in business. Various elements included in the dashboard are month-wise issue status, types of issues, average resolution time, overall status and resolved issues. Showcasing this set of slides titled Information Technology Operations Operations Dashboard For Issues Management Infographics PDF. The topics addressed in these templates are Information Technology Operations, Operations Dashboard, Issues Management. All the content presented in this PPT design is completely editable. Download it and make adjustments in color, background, font etc. as per your unique business setting.

Building Management Dashboard Highlighting Power Consumption And Occupancy Rate Template PDF
This slide showcases dashboard that can help organization to keep track of power consumed by machinery and occupancy rate during facility management. Its key components are HVAC, occupancy rate, service requests and temperature. Pitch your topic with ease and precision using this Building Management Dashboard Highlighting Power Consumption And Occupancy Rate Template PDF. This layout presents information on Lighting, Power, Water, Electricity, Temperature. It is also available for immediate download and adjustment. So, changes can be made in the color, design, graphics or any other component to create a unique layout.

Market Analysis Of Smart Farming Tech With Growth Drivers Template PDF
The following slide highlights smart farming tech market analysis with growth drivers to measure progress and track performance. It include growth drivers such as increase demand of weather monitoring system, increase in human resource investment and key insights such as estimated market value, forecasted revenue etc.Pitch your topic with ease and precision using this Market Analysis Of Smart Farming Tech With Growth Drivers Template PDF. This layout presents information on Estimated Growth, Estimated Market Value, Forecasted Revenue. It is also available for immediate download and adjustment. So, changes can be made in the color, design, graphics or any other component to create a unique layout.

Cash Management Dashboard With Sales Outstanding And Liquidity Ratio Analysis Information PDF
This showcases dashboard that can help organization in cash management and track KPIs to evaluate the financial performance of company. It key components are liquidity ratios, cash balance. days sales outstanding, days inventory outstanding and days payable outstanding. Pitch your topic with ease and precision using this Cash Management Dashboard With Sales Outstanding And Liquidity Ratio Analysis Information PDF. This layout presents information on Cash Conversion, Working Capital, Cash Balance. It is also available for immediate download and adjustment. So, changes can be made in the color, design, graphics or any other component to create a unique layout.

Dashboard For Organization Expenses Management Summary PDF
This slide indicates the dashboard to track department wise expenses of an organization. It also provides information regarding each department budget allocation along with total yearly expenses. Crafting an eye catching presentation has never been more straightforward. Let your presentation shine with this tasteful yet straightforward Dashboard For Organization Expenses Management Summary PDF template. It offers a minimalistic and classy look that is great for making a statement. The colors have been employed intelligently to add a bit of playfulness while still remaining professional. Construct the ideal Dashboard For Organization Expenses Management Summary PDF that effortlessly grabs the attention of your audience Begin now and be certain to wow your customers.

Average Employee Compensation And Salary Dashboard Download PDF
The following slide showcases workforce compensation management dashboard to keep a track of benefits provided to employees. The dashboard includes employee count by salary range, workforce details and count by rating. Showcasing this set of slides titled Average Employee Compensation And Salary Dashboard Download PDF. The topics addressed in these templates are Average Employee Compensation, Salary Dashboard. All the content presented in this PPT design is completely editable. Download it and make adjustments in color, background, font etc. as per your unique business setting.

Employee Payroll Compensation And Salary Dashboard With Expenses Professional PDF
The following slide showcases payroll and compensation dashboard to assist HR team analyze and track important KPIs. The dashboard depicts expenses , items processed and compensation comparison. Showcasing this set of slides titled Employee Payroll Compensation And Salary Dashboard With Expenses Professional PDF. The topics addressed in these templates are Employee Payroll Compensation, Salary Dashboard With Expenses. All the content presented in this PPT design is completely editable. Download it and make adjustments in color, background, font etc. as per your unique business setting.

Company Sales Employee Performance Measurement Dashboard Information PDF
This slide exhibits sales performance dashboard to analyze revenue and track business progress. It includes various indicators such as leads created, opportunities won, sales ratio and top revenue generating products. Showcasing this set of slides titled Company Sales Employee Performance Measurement Dashboard Information PDF. The topics addressed in these templates are Quick Ratio Target, Opportunities Won, Revenue Generating Products. All the content presented in this PPT design is completely editable. Download it and make adjustments in color, background, font etc. as per your unique business setting.

Food Service Delivery And Management Dashboard With Annual Sales Brochure PDF
This slide shows a food delivery company dashboard keeping track of all the orders or services delivered. Moreover, it covers KPIs such as total restaurants, registered users, weekly sales, total orders etc. Showcasing this set of slides titled Food Service Delivery And Management Dashboard With Annual Sales Brochure PDF. The topics addressed in these templates are Food Service Delivery, Management Dashboard, Annual Sales. All the content presented in this PPT design is completely editable. Download it and make adjustments in color, background, font etc. as per your unique business setting.

Supply Chain Management Service Delivery And Management Dashboard Guidelines PDF
This slide shows an overview of the supply chain management delivery service to track the operationality of the overall process. It includes metrics such as on time deliveries, the average time to sell, and the out of stock rate. Pitch your topic with ease and precision using this Supply Chain Management Service Delivery And Management Dashboard Guidelines PDF. This layout presents information on Supply Chain Management, Service Delivery, Management Dashboard. It is also available for immediate download and adjustment. So, changes can be made in the color, design, graphics or any other component to create a unique layout.
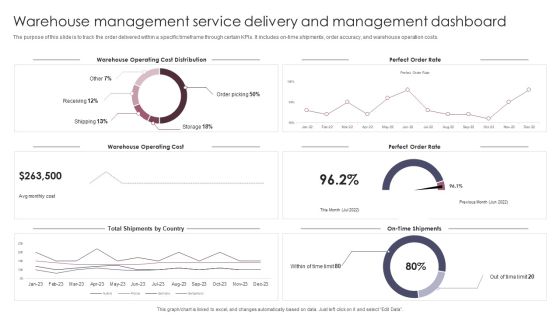
Warehouse Management Service Delivery And Management Dashboard Slides PDF
The purpose of this slide is to track the order delivered within a specific timeframe through certain KPIs. It includes on time shipments, order accuracy, and warehouse operation costs. Showcasing this set of slides titled Warehouse Management Service Delivery And Management Dashboard Slides PDF. The topics addressed in these templates are Warehouse Operating Cost, Warehouse Operating Cost Distribution. All the content presented in this PPT design is completely editable. Download it and make adjustments in color, background, font etc. as per your unique business setting.

Marketing Performance Dashboard With Analytics Campaign Ppt Infographics Background Images PDF
This slide represents dashboard for campaign performance analytics report. It covers total clicks, CTR, impressions , view-through conversions , total conversion, lead generation, activity per click etc to track campaign progress. Showcasing this set of slides titled Marketing Performance Dashboard With Analytics Campaign Ppt Infographics Background Images PDF. The topics addressed in these templates are Total Clicks, Total Impressions, Total Conversions, Activity Per Click. All the content presented in this PPT design is completely editable. Download it and make adjustments in color, background, font etc. as per your unique business setting.

Transforming Business With AI Company Brand Value Over Time Clipart PDF
This graph shows the current situation of our company, where it lies according to other brands. This leads to implementing AI in the organization. Take your projects to the next level with our ultimate collection of Transforming Business With AI Company Brand Value Over Time Clipart PDF. Slidegeeks has designed a range of layouts that are perfect for representing task or activity duration, keeping track of all your deadlines at a glance. Tailor these designs to your exact needs and give them a truly corporate look with your own brand colors they will make your projects stand out from the rest.
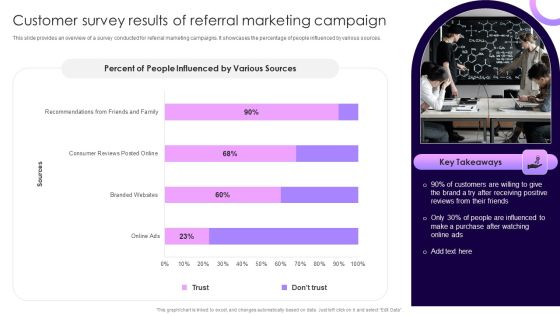
Traditional Marketing Guide To Increase Audience Engagement Customer Survey Results Of Referral Marketing Campaign Summary PDF
This slide provides an overview of a survey conducted for referral marketing campaigns. It showcases the percentage of people influenced by various sources. Take your projects to the next level with our ultimate collection of Traditional Marketing Guide To Increase Audience Engagement Customer Survey Results Of Referral Marketing Campaign Summary PDF. Slidegeeks has designed a range of layouts that are perfect for representing task or activity duration, keeping track of all your deadlines at a glance. Tailor these designs to your exact needs and give them a truly corporate look with your own brand colors they will make your projects stand out from the rest.

Guide To Develop And Estimate Brand Value Brand Awareness Measuring Kpi Dashboard Infographics PDF
Following slide illustrates KPI dashboard that can be used to track the awareness level of a specific brand. KPIs covered in the slide are traffic, attention, authority, inbound channel performance etc.From laying roadmaps to briefing everything in detail, our templates are perfect for you. You can set the stage with your presentation slides. All you have to do is download these easy-to-edit and customizable templates. Guide To Develop And Estimate Brand Value Brand Awareness Measuring Kpi Dashboard Infographics PDF will help you deliver an outstanding performance that everyone would remember and praise you for. Do download this presentation today.
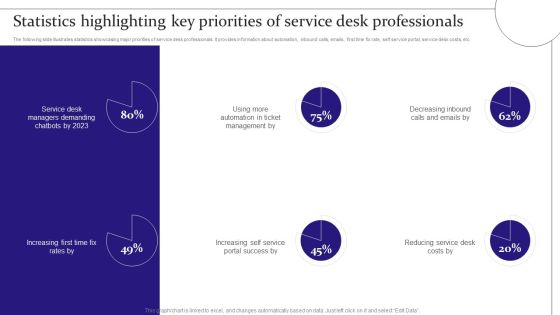
Digitalization Of Service Desk Statistics Highlighting Key Priorities Of Service Desk Professionals Ppt Gallery Grid PDF
The following slide illustrates statistics showcasing major priorities of service desk professionals. It provides information about automation, inbound calls, emails, first time fix rate, self service portal, service desk costs, etc. Take your projects to the next level with our ultimate collection of Digitalization Of Service Desk Statistics Highlighting Key Priorities Of Service Desk Professionals Ppt Gallery Grid PDF. Slidegeeks has designed a range of layouts that are perfect for representing task or activity duration, keeping track of all your deadlines at a glance. Tailor these designs to your exact needs and give them a truly corporate look with your own brand colors they will make your projects stand out from the rest.
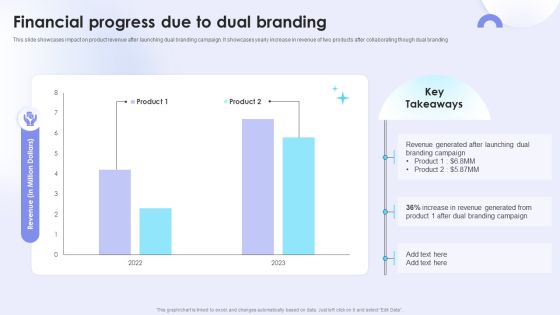
Dual Branding Campaign To Boost Sales Of Product Or Services Financial Progress Due To Dual Branding Pictures PDF
This slide showcases impact on product revenue after launching dual branding campaign. It showcases yearly increase in revenue of two products after collaborating though dual branding Take your projects to the next level with our ultimate collection of DDual Branding Campaign To Boost Sales Of Product Or Services Financial Progress Due To Dual Branding Pictures PDF. Slidegeeks has designed a range of layouts that are perfect for representing task or activity duration, keeping track of all your deadlines at a glance. Tailor these designs to your exact needs and give them a truly corporate look with your own brand colors they will make your projects stand out from the rest.
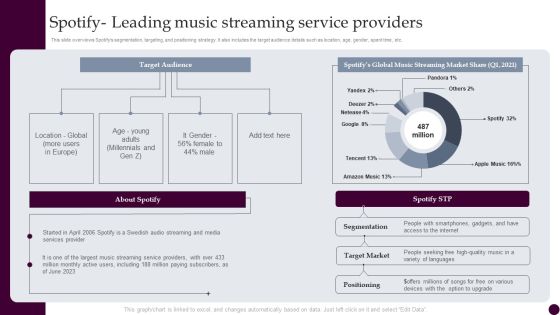
Spotify Leading Music Streaming Service Providers Strategies For Acquiring Consumers Infographics PDF
This slide overviews Spotifys segmentation, targeting, and positioning strategy. It also includes the target audience details such as location, age, gender, spent time, etc. Take your projects to the next level with our ultimate collection of Spotify Leading Music Streaming Service Providers Strategies For Acquiring Consumers Infographics PDF. Slidegeeks has designed a range of layouts that are perfect for representing task or activity duration, keeping track of all your deadlines at a glance. Tailor these designs to your exact needs and give them a truly corporate look with your own brand colors they well make your projects stand out from the rest.

Retail Store Operations Overview Of Retail Stores Ppt Infographic Template File Formats PDF
This slide provides information regarding retail company in terms of headquarters, revenues, total number of employees, number of stores across USA. It also covers details of common operational challenges faced by stores. Take your projects to the next level with our ultimate collection of Retail Store Operations Overview Of Retail Stores Ppt Infographic Template File Formats PDF. Slidegeeks has designed a range of layouts that are perfect for representing task or activity duration, keeping track of all your deadlines at a glance. Tailor these designs to your exact needs and give them a truly corporate look with your own brand colors theyll make your projects stand out from the rest.

Customer Ratings Dashboard With Most Liked Positive And Negative Review Formats PDF
This slide showcases overall consumer reviews for companys product which includes sections such as rating distribution, top adjectives, most liked positive and negative comments to keep track of customer response and make necessary improvements. Showcasing this set of slides titled Customer Ratings Dashboard With Most Liked Positive And Negative Review Formats PDF. The topics addressed in these templates are Smells Great, Sun Protection, Soothing. All the content presented in this PPT design is completely editable. Download it and make adjustments in color, background, font etc. as per your unique business setting.
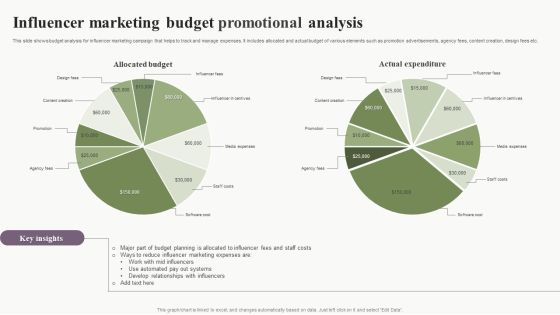
Influencer Marketing Budget Promotional Analysis Download PDF
This slide shows budget analysis for influencer marketing campaign that helps to track and manage expenses. It includes allocated and actual budget of various elements such as promotion advertisements, agency fees, content creation, design fees etc. Pitch your topic with ease and precision using this Influencer Marketing Budget Promotional Analysis Download PDF. This layout presents information on Influencer Marketing, Budget Promotional Analysis. It is also available for immediate download and adjustment. So, changes can be made in the color, design, graphics or any other component to create a unique layout.

Deploying Content Distribution Network System Reputational Damage Faced By Introduction PDF
This slide describes the reputational damage faced by the company because of high load times and poor server experience. Take your projects to the next level with our ultimate collection of Deploying Content Distribution Network System Reputational Damage Faced By Introduction PDF. Slidegeeks has designed a range of layouts that are perfect for representing task or activity duration, keeping track of all your deadlines at a glance. Tailor these designs to your exact needs and give them a truly corporate look with your own brand colors theyll make your projects stand out from the rest
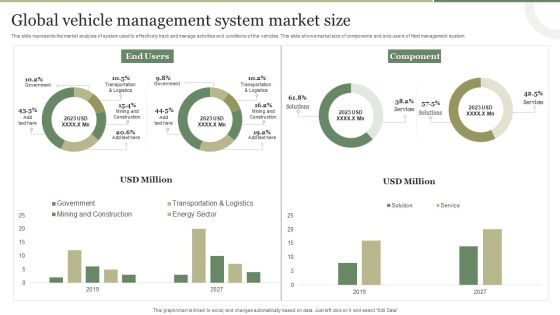
Global Vehicle Management System Market Size Guidelines PDF
This slide represents the market analysis of system used to effectively track and manage activities and conditions of the vehicles. This slide shows market size of components and end-users of fleet management system. Pitch your topic with ease and precision using this Global Vehicle Management System Market Size Guidelines PDF. This layout presents information on Global Vehicle, Management System, Market Size. It is also available for immediate download and adjustment. So, changes can be made in the color, design, graphics or any other component to create a unique layout.

Real Time Incident Management Improving Cybersecurity With Incident Professional PDF
Following slide illustrate KPI dashboard that can be used by organizations to track real time incident data. KPIs covered are number of tickets, average resolution time per customer, incidents registered per month. The Real Time Incident Management Improving Cybersecurity With Incident Professional PDF is a compilation of the most recent design trends as a series of slides. It is suitable for any subject or industry presentation, containing attractive visuals and photo spots for businesses to clearly express their messages. This template contains a variety of slides for the user to input data, such as structures to contrast two elements, bullet points, and slides for written information. Slidegeeks is prepared to create an impression.

Cyber Security Incident Analytics Dashboard With Level Of Security Ppt Ideas Graphics Tutorials PDF
The given slide depicts the cyber threat analytics to track the attacks. It includes the no. of incidents, open and solved tickets, category wise no. of incidents along with malware type etc. Pitch your topic with ease and precision using this Cyber Security Incident Analytics Dashboard With Level Of Security Ppt Ideas Graphics Tutorials PDF. This layout presents information on Power Security Team, Open Incidents, Incidents Solved, Open Tickets. It is also available for immediate download and adjustment. So, changes can be made in the color, design, graphics or any other component to create a unique layout.
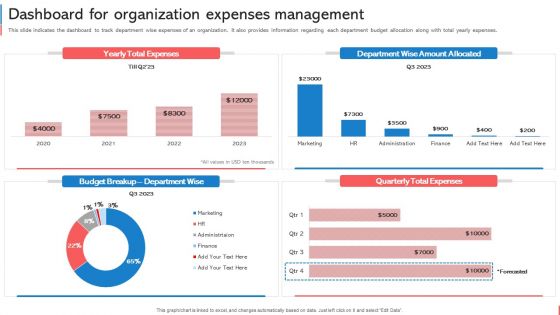
Company Budget Analysis Dashboard For Organization Expenses Management Graphics PDF
This slide indicates the dashboard to track department wise expenses of an organization. It also provides information regarding each department budget allocation along with total yearly expenses. Create an editable Company Budget Analysis Dashboard For Organization Expenses Management Graphics PDF that communicates your idea and engages your audience. Whether youre presenting a business or an educational presentation, pre-designed presentation templates help save time. Company Budget Analysis Dashboard For Organization Expenses Management Graphics PDF is highly customizable and very easy to edit, covering many different styles from creative to business presentations. Slidegeeks has creative team members who have crafted amazing templates. So, go and get them without any delay.

Chief Executive Dashboards With Financial Topics PDF
This slide represents the dashboard for the CEO to track the global financial performance of the organization. It includes key performance indicators such as revenue, quick ratio, short term assets etc. Showcasing this set of slides titled Chief Executive Dashboards With Financial Topics PDF. The topics addressed in these templates are Short Term Assets, Global Financial Performance, Debt Equity. All the content presented in this PPT design is completely editable. Download it and make adjustments in color, background, font etc. as per your unique business setting.

Integrating Digital Marketing Campaign Strategy Dashboard With Lead Breakdown Slides PDF
This slide depicts an integrating digital marketing campaign dashboard used to track lead generation and user traffic generated. It includes lead breakdown per day, google analytics traffic channels and key conversion metrics. Showcasing this set of slides titled Integrating Digital Marketing Campaign Strategy Dashboard With Lead Breakdown Slides PDF. The topics addressed in these templates are Lead Current Month, Website Users, Top Social Media Channels. All the content presented in this PPT design is completely editable. Download it and make adjustments in color, background, font etc. as per your unique business setting.

Advantages Of Agile Methodology Contd Software Development Approaches Inspiration PDF
This slide depicts the advantages of agile methodology that include managing changing priorities, project visibility, IT alignment, delivery speed, team morale, increased productivity, and so on.Take your projects to the next level with our ultimate collection of Advantages Of Agile Methodology Contd Software Development Approaches Inspiration PDF. Slidegeeks has designed a range of layouts that are perfect for representing task or activity duration, keeping track of all your deadlines at a glance. Tailor these designs to your exact needs and give them a truly corporate look with your own brand colors they all make your projects stand out from the rest.
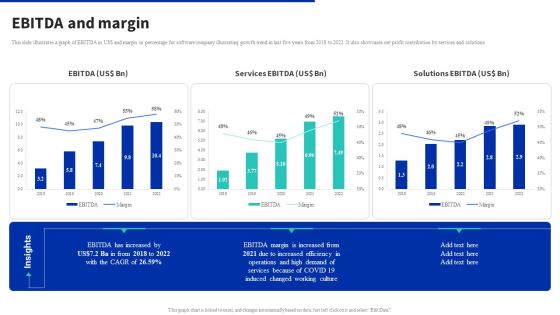
Digital Products Company Outline Ebitda And Margin Inspiration PDF
This slide illustrates a graph of EBITDA in US dollar and margin in percentage for software company illustrating growth trend in last five years from 2018 to 2022. It also showcases net profit contribution by services and solutions. Take your projects to the next level with our ultimate collection of Digital Products Company Outline Ebitda And Margin Inspiration PDF. Slidegeeks has designed a range of layouts that are perfect for representing task or activity duration, keeping track of all your deadlines at a glance. Tailor these designs to your exact needs and give them a truly corporate look with your own brand colors they will make your projects stand out from the rest.
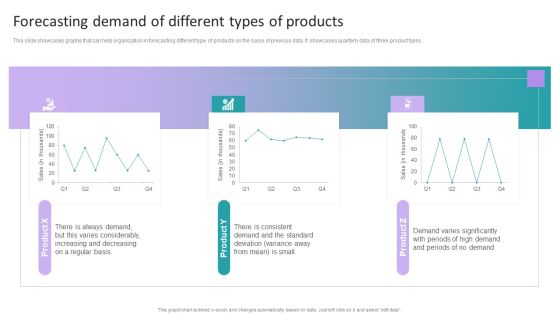
Stock Inventory Acquisition Forecasting Demand Of Different Types Of Products Slides PDF
This slide showcases graphs that can help organization in forecasting different type of products on the basis of previous data. It showcases quarterly data of three product types. Take your projects to the next level with our ultimate collection of Stock Inventory Acquisition Forecasting Demand Of Different Types Of Products Slides PDF. Slidegeeks has designed a range of layouts that are perfect for representing task or activity duration, keeping track of all your deadlines at a glance. Tailor these designs to your exact needs and give them a truly corporate look with your own brand colors theyll make your projects stand out from the rest.

Decentralization App Development Dashboard For Dapp Development Slides PDF
This slide depicts the dashboard for DApp development based on the portfolio performance, recent activities, assets, deposits, and so on. Take your projects to the next level with our ultimate collection of Decentralization App Development Dashboard For Dapp Development Slides PDF. Slidegeeks has designed a range of layouts that are perfect for representing task or activity duration, keeping track of all your deadlines at a glance. Tailor these designs to your exact needs and give them a truly corporate look with your own brand colors they will make your projects stand out from the rest.
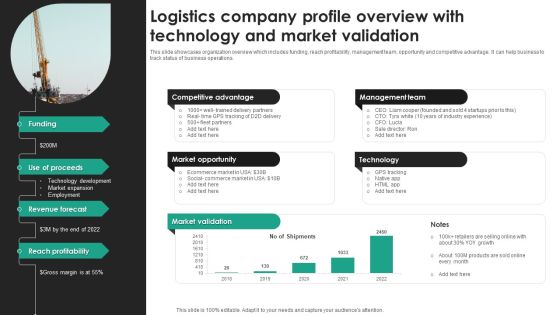
Logistics Company Profile Overview With Technology And Market Validation Demonstration PDF
This slide showcases organization overview which includes funding, reach profitability, management team, opportunity and competitive advantage. It can help business to track status of business operations. Showcasing this set of slides titled Logistics Company Profile Overview With Technology And Market Validation Demonstration PDF. The topics addressed in these templates are Competitive Advantage, Management Team, Market Opportunity, Technology. All the content presented in this PPT design is completely editable. Download it and make adjustments in color, background, font etc. as per your unique business setting.
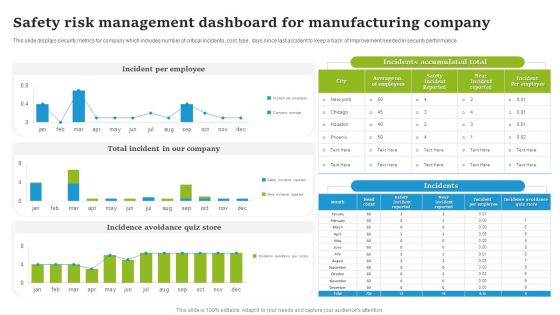
Safety Risk Management Dashboard For Manufacturing Company Introduction PDF
This slide displays security metrics for company which includes number of critical incidents, cost, type, days since last accident to keep a track of Improvement needed in security performance. Showcasing this set of slides titled Safety Risk Management Dashboard For Manufacturing Company Introduction PDF. The topics addressed in these templates are Incident Per Employee, Total Incident Our Company, Incidence Avoidance Quiz Store. All the content presented in this PPT design is completely editable. Download it and make adjustments in color, background, font etc. as per your unique business setting.
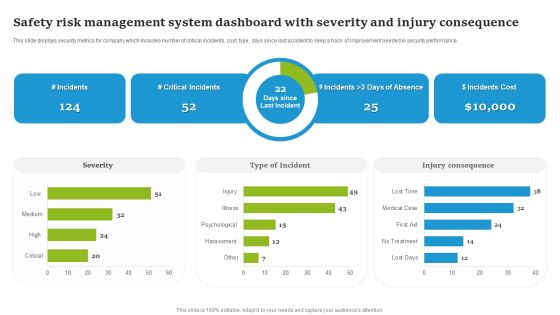
Safety Risk Management System Dashboard With Severity And Injury Consequence Clipart PDF
This slide displays security metrics for company which includes number of critical incidents, cost, type, days since last accident to keep a track of Improvement needed in security performance. Pitch your topic with ease and precision using this Safety Risk Management System Dashboard With Severity And Injury Consequence Clipart PDF. This layout presents information on Severity, Type Of Incident, Injury Consequence . It is also available for immediate download and adjustment. So, changes can be made in the color, design, graphics or any other component to create a unique layout.
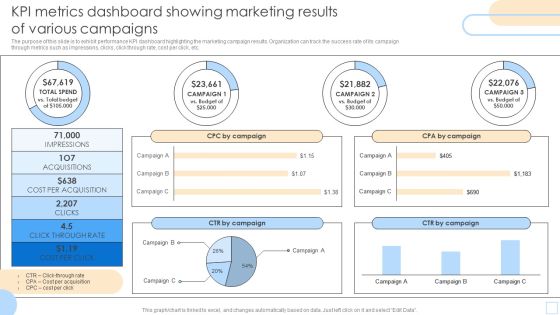
KPI Metrics Dashboard Showing Marketing Results Of Various Campaigns Pictures PDF
The purpose of this slide is to exhibit performance KPI dashboard highlighting the marketing campaign results. Organization can track the success rate of its campaign through metrics such as impressions, clicks, click through rate, cost per click, etc. Pitch your topic with ease and precision using this KPI Metrics Dashboard Showing Marketing Results Of Various Campaigns Pictures PDF. This layout presents information on Impressions, Acquisitions, CPA By Campaign. It is also available for immediate download and adjustment. So, changes can be made in the color, design, graphics or any other component to create a unique layout.

Project Stakeholders Management Strategy And Dashboard Sample PDF
This slide showcases analytics for stakeholders for various business operations such as developing pricing strategy, new user sign up, analytics, product subscription improvement, etc. to track overall status of engagement and responsibility at various levels. Pitch your topic with ease and precision using this Project Stakeholders Management Strategy And Dashboard Sample PDF. This layout presents information on Pricing Strategy, Product Subscription Improvement. It is also available for immediate download and adjustment. So, changes can be made in the color, design, graphics or any other component to create a unique layout.

Online Marketing Techniques For Acquiring Clients Dashboard To Measure Performance Information PDF
This following slide displays the key metrics that can help an organization to measure effectiveness of social media strategies. These can be leads generated, leads by region, web traffic targets etc. Take your projects to the next level with our ultimate collection of Online Marketing Techniques For Acquiring Clients Dashboard To Measure Performance Information PDF. Slidegeeks has designed a range of layouts that are perfect for representing task or activity duration, keeping track of all your deadlines at a glance. Tailor these designs to your exact needs and give them a truly corporate look with your own brand colors they will make your projects stand out from the rest.
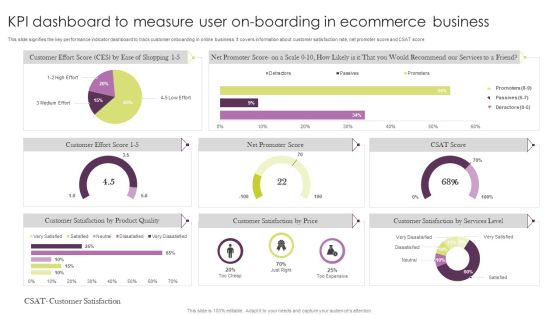
KPI Dashboard To Measure User On Boarding In Ecommerce Business Microsoft PDF
This slide signifies the key performance indicator dashboard to track customer onboarding in online business. It covers information about customer satisfaction rate, net promoter score and CSAT score. Showcasing this set of slides titled KPI Dashboard To Measure User On Boarding In Ecommerce Business Microsoft PDF. The topics addressed in these templates are User Boarding Icon, Develop Ecommerce Business. All the content presented in this PPT design is completely editable. Download it and make adjustments in color, background, font etc. as per your unique business setting.
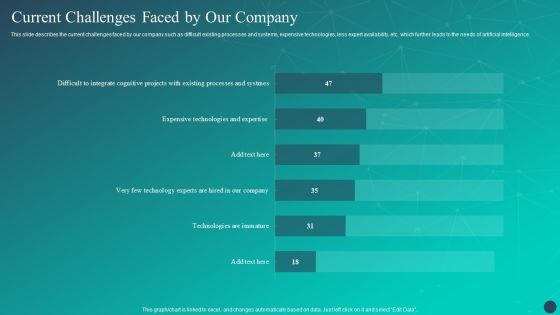
Optimizing AI Strategies To Improve Financial Services Current Challenges Faced By Our Company Introduction PDF
This slide describes the current challenges faced by our company such as difficult existing processes and systems, expensive technologies, less expert availability, etc. which further leads to the needs of artificial intelligence. Take your projects to the next level with our ultimate collection of Optimizing AI Strategies To Improve Financial Services Current Challenges Faced By Our Company Introduction PDF. Slidegeeks has designed a range of layouts that are perfect for representing task or activity duration, keeping track of all your deadlines at a glance. Tailor these designs to your exact needs and give them a truly corporate look with your own brand colors they will make your projects stand out from the rest.

KPI Dashboard To Evaluate Corporate Sales Introduction PDF
This slide contains KPI dashboard which can be used by company to track e-commerce sales. It includes kpis such as total orders, order quantity, sales quantity, sales by location, etc. Pitch your topic with ease and precision using this KPI Dashboard To Evaluate Corporate Sales Introduction PDF. This layout presents information on KPI Dashboard, Evaluate Corporate Sales. It is also available for immediate download and adjustment. So, changes can be made in the color, design, graphics or any other component to create a unique layout.

Client Support KPI Dashboard With Revenue Churn Information PDF
This slides shows dashboard which can be used by company to track revenue generated from customer service delivery. It includes KPIs such as customer churn, retention, MRP growth, etc. Showcasing this set of slides titled Client Support KPI Dashboard With Revenue Churn Information PDF. The topics addressed in these templates are Customer Churn, Loyal Customers, Premium Users. All the content presented in this PPT design is completely editable. Download it and make adjustments in color, background, font etc. as per your unique business setting.
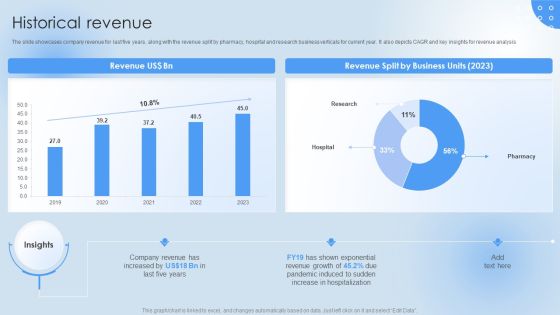
Pharmaceutical Company Financial Summary Historical Revenue Guidelines PDF
The slide showcases company revenue for last five years, along with the revenue split by pharmacy, hospital and research business verticals for current year. It also depicts CAGR and key insights for revenue analysis. Take your projects to the next level with our ultimate collection of Pharmaceutical Company Financial Summary Historical Revenue Guidelines PDF. Slidegeeks has designed a range of layouts that are perfect for representing task or activity duration, keeping track of all your deadlines at a glance. Tailor these designs to your exact needs and give them a truly corporate look with your own brand colors theyll make your projects stand out from the rest.
Pharmaceutical Company Financial Summary Hospital Business Financials Icons PDF
The slide describes financial details for Hospital business vertical. It showcase revenue, gross profit, operating profit, EBIDTA and net profit along with margin. Take your projects to the next level with our ultimate collection of Pharmaceutical Company Financial Summary Hospital Business Financials Icons PDF. Slidegeeks has designed a range of layouts that are perfect for representing task or activity duration, keeping track of all your deadlines at a glance. Tailor these designs to your exact needs and give them a truly corporate look with your own brand colors theyll make your projects stand out from the rest.

 Home
Home