AI PPT Maker
Templates
PPT Bundles
Design Services
Business PPTs
Business Plan
Management
Strategy
Introduction PPT
Roadmap
Self Introduction
Timelines
Process
Marketing
Agenda
Technology
Medical
Startup Business Plan
Cyber Security
Dashboards
SWOT
Proposals
Education
Pitch Deck
Digital Marketing
KPIs
Project Management
Product Management
Artificial Intelligence
Target Market
Communication
Supply Chain
Google Slides
Research Services
 One Pagers
All Categories
-
Home
- Customer Favorites
- Total Cost
Total Cost
Insurance Analytics Enrollment Around The World Dashboard Icons PDF
This slide illustrates total insurance enrollment of all insurance corporations. It includes monthly enrollment charts, enrollments in 2021, enrollment by scheme, enrollment levels, worldwide enrollments, enrollment age wise etc. Showcasing this set of slides titled Insurance Analytics Enrollment Around The World Dashboard Icons PDF. The topics addressed in these templates are Enrollments Levels, Enrollments Worldwide, Enrollments Age Wise. All the content presented in this PPT design is completely editable. Download it and make adjustments in color, background, font etc. as per your unique business setting.
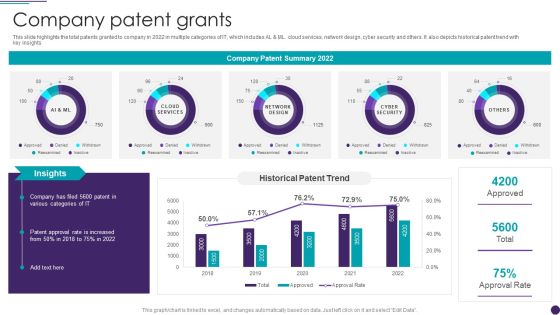
IT Services Business Profile Company Patent Grants Infographics PDF
This slide highlights the total patents granted to company in 2022 in multiple categories of IT, which includes AL and ML. cloud services, network design, cyber security and others. It also depicts historical patent trend with key insights. Deliver an awe inspiring pitch with this creative IT Services Business Profile Company Patent Grants Infographics PDF bundle. Topics like Network Design, Cyber Security, Cloud Services can be discussed with this completely editable template. It is available for immediate download depending on the needs and requirements of the user.

Software Services Business Profile Gross Profit And Margin Ppt PowerPoint Presentation Gallery Templates PDF
This slide illustrates a graph of gross profit in US dollar and gross margin in percentage for software company illustrating growth trend in last five years from 2018 to 2022. It also showcases gross profit contribution by services and solutions. Deliver an awe inspiring pitch with this creative Software Services Business Profile Gross Profit And Margin Ppt PowerPoint Presentation Gallery Templates PDF bundle. Topics like Total Gross Profit, Services Gross Profit, Solutions Gross Profit can be discussed with this completely editable template. It is available for immediate download depending on the needs and requirements of the user.
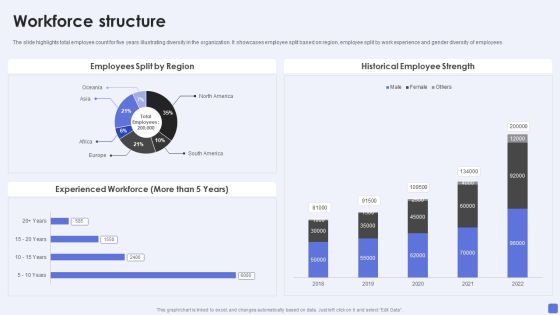
Software Services Business Profile Workforce Structure Ppt PowerPoint Presentation Gallery Good PDF
The slide highlights total employee count for five years illustrating diversity in the organization. It showcases employee split based on region, employee split by work experience and gender diversity of employees. Deliver and pitch your topic in the best possible manner with this Software Services Business Profile Workforce Structure Ppt PowerPoint Presentation Gallery Good PDF. Use them to share invaluable insights on Employees Split Region, Historical Employee Strength, Experienced Workforce, 2018 To 2022 and impress your audience. This template can be altered and modified as per your expectations. So, grab it now.

Business Monthly Sales Opportunity Report Summary With Trend Professional PDF
The Following Slide Highlights the monthly sales Opportunity report with trend . It depicts sales opportunity by sales person , total won opportunity , win ratio , average opportunity and win opportunity trend.Showcasing this set of slides titled Business Monthly Sales Opportunity Report Summary With Trend Professional PDF The topics addressed in these templates are Average Opportunity, Won Opportunity, Sales Opportunity All the content presented in this PPT design is completely editable. Download it and make adjustments in color, background, font etc. as per your unique business setting.

Marketing And Operation Planning Dashboard To Drive Better Performance Graphics PDF
This slide covers sales and operations planning dashboard to improve performance. It involves bookings plan, year on year growth, bookings plan per year and total growth and sales made by sales manager. Showcasing this set of slides titled Marketing And Operation Planning Dashboard To Drive Better Performance Graphics PDF. The topics addressed in these templates are Sales Manager, Growth Made, Bookings Plan By Year. All the content presented in this PPT design is completely editable. Download it and make adjustments in color, background, font etc. as per your unique business setting.
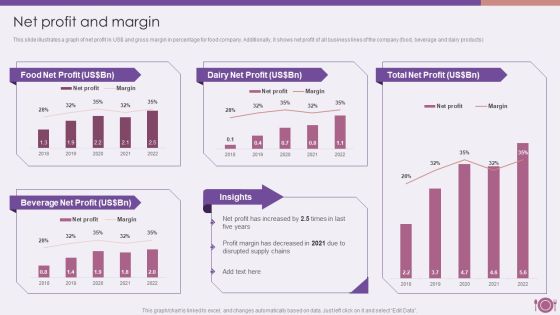
Packaged Food Firm Description Net Profit And Margin Download PDF
This slide illustrates a graph of net profit in USdollar and gross margin in percentage for food company. Additionally, it shows net profit of all business lines of the company food, beverage and dairy products.Deliver and pitch your topic in the best possible manner with this Packaged Food Firm Description Net Profit And Margin Download PDF. Use them to share invaluable insights on Dairy Net, Total Net, Beverage Net Profit and impress your audience. This template can be altered and modified as per your expectations. So, grab it now.
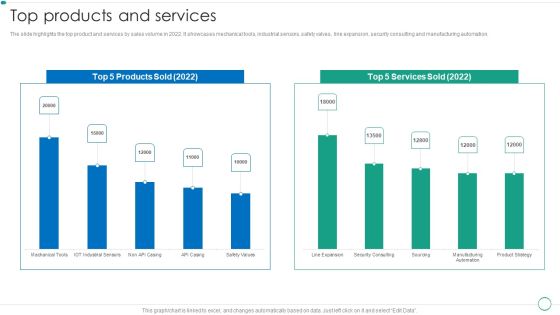
Real Estate Construction And Engineering Company Profile Top Products And Services Microsoft PDF
The slide highlights the top product and services by sales volume in 2022. It showcases mechanical tools, industrial sensors, safety valves, line expansion, security consulting and manufacturing automation.Deliver and pitch your topic in the best possible manner with this Real Estate Construction And Engineering Company Profile Top Products And Services Microsoft PDF. Use them to share invaluable insights on Employee Diversity, Employee Count, Total Employees and impress your audience. This template can be altered and modified as per your expectations. So, grab it now.
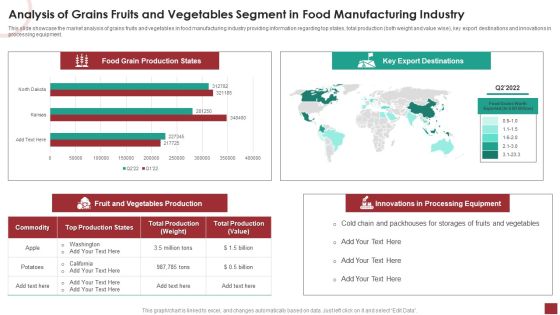
Industry Analysis For Food Manufacturing Market Analysis Of Grains Fruits And Vegetables Segment Guidelines PDF
This slide showcase the market analysis of grains fruits and vegetables in food manufacturing industry providing information regarding top states, total production both weight and value wise, key export destinations and innovations in processing equipment.Deliver and pitch your topic in the best possible manner with this Industry Analysis For Food Manufacturing Market Analysis Of Grains Fruits And Vegetables Segment Guidelines PDF. Use them to share invaluable insights on Production States, Export Destinations, Processing Equipment and impress your audience. This template can be altered and modified as per your expectations. So, grab it now.

AIOPS Implementation Artificial Intelligence For IT Operations Dashboard Brochure PDF
This slide shows the dashboard for AIOps that covers the details of Cloud DevOps team performance, including the total number of currently assigned situations, acknowledged, resolved, and the number of recent comments. Deliver an awe inspiring pitch with this creative AIOPS Implementation Artificial Intelligence For IT Operations Dashboard Brochure PDF bundle. Topics like Current Assigned Situations. Current Acknowledged Situations, Current Resolved Situations can be discussed with this completely editable template. It is available for immediate download depending on the needs and requirements of the user.

Security Officer Service Company Profile Csr Initiatives And Spending Ppt PowerPoint Presentation Gallery Shapes PDF
This slide highlights the CSR spend distribution by inhouse and partner spend. It also highlights the CSR initiatives that are carbon footprint reduction, labor policies, hunger program, community development and healthcare services. Deliver an awe inspiring pitch with this creative Security Officer Service Company Profile Csr Initiatives And Spending Ppt PowerPoint Presentation Gallery Shapes PDF bundle. Topics like CSR Total Spend, Hunger Program, Skills Training, Community Development can be discussed with this completely editable template. It is available for immediate download depending on the needs and requirements of the user.

Cosmetics And Skin Care Company Profile Order Distribution By Product And Gender Designs PDF
This slide focuses on order distribution by products such as makeup, skin care, hair care and body care and fragrances and gender which shows maximum order quantity by females in 2022. Deliver and pitch your topic in the best possible manner with this Cosmetics And Skin Care Company Profile Order Distribution By Product And Gender Designs PDF. Use them to share invaluable insights on Total Orders, Order Distribution, Product Category and impress your audience. This template can be altered and modified as per your expectations. So, grab it now.

Workforce Department Performance Graph Ppt Model Graphics Pictures PDF
This slide shows performance graph of HR department. Information covered in this slide is related to total hirings and turnover in the last four years. Pitch your topic with ease and precision using this Workforce Department Performance Graph Ppt Model Graphics Pictures PDF. This layout presents information on New Hiring, Continuous Increase, Employee Turnover, 2019 To 2022. It is also available for immediate download and adjustment. So, changes can be made in the color, design, graphics or any other component to create a unique layout.

Remuneration Strategy With Employee Performance Dashboard Ppt Styles Themes PDF
The following slide highlights the commission scheme with employee performance dashboard illustrating key headings which includes employee details, overview, performance, pay mix and structure and total payout. Persuade your audience using this Remuneration Strategy With Employee Performance Dashboard Ppt Styles Themes PDF. This PPT design covers one stages, thus making it a great tool to use. It also caters to a variety of topics including Target, Attained, Commission. Download this PPT design now to present a convincing pitch that not only emphasizes the topic but also showcases your presentation skills.

Analysis Of Grains Fruits And Vegetables Segment In Food Manufacturing Industry Formats PDF
This slide showcase the market analysis of grains fruits and vegetables in food manufacturing industry providing information regarding top states, total production both weight and value wise, key export destinations and innovations in processing equipment. Deliver an awe inspiring pitch with this creative Analysis Of Grains Fruits And Vegetables Segment In Food Manufacturing Industry Formats PDF bundle. Topics like Food Grain, Production States, Key Export Destinations, Innovations Processing Equipment can be discussed with this completely editable template. It is available for immediate download depending on the needs and requirements of the user.
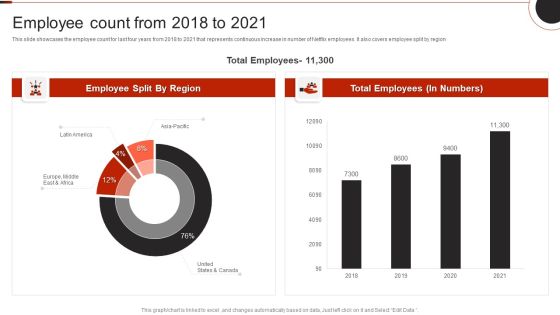
Netflix Company Outline Employee Count From 2018 To 2021 Information PDF
This slide showcases the employee count for last four years from 2018 to 2021 that represents continuous increase in number of Netflix employees. It also covers employee split by region.Deliver and pitch your topic in the best possible manner with this Netflix Company Outline Employee Count From 2018 To 2021 Information PDF. Use them to share invaluable insights on Employee Split, Total Employees, Europe Middle and impress your audience. This template can be altered and modified as per your expectations. So, grab it now.
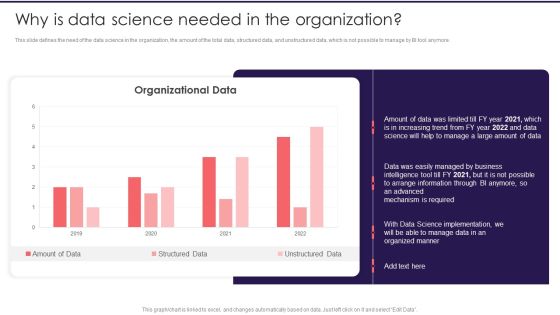
Information Studies Why Is Data Science Needed In The Organization Introduction PDF
This slide defines the need of the data science in the organization, the amount of the total data, structured data, and unstructured data, which is not possible to manage by BI tool anymore. Deliver an awe inspiring pitch with this creative Information Studies Why Is Data Science Needed In The Organization Introduction PDF bundle. Topics like Arrange Information, Required, Data Science Implementation can be discussed with this completely editable template. It is available for immediate download depending on the needs and requirements of the user.

Conducting Monetary Inclusion With Mobile Subscribers Projection And Tele Density Growth Elements PDF
Mentioned slide shows informational stats about mobile subscribers and tele density growth for five years. The graph depicts that total mobile subscription for MFS will get increased by 84percent in 2026. Deliver and pitch your topic in the best possible manner with this Conducting Monetary Inclusion With Mobile Subscribers Projection And Tele Density Growth Elements PDF. Use them to share invaluable insights on Rural Teledensity, Urban Teledensity, Tele Density and impress your audience. This template can be altered and modified as per your expectations. So, grab it now.

Freelance Content Marketing Dashboard With Metrics Demonstration PDF
The following slide highlights the freelance content marketing dashboard with metrics illustrating most visited content, monthly total visit, average content score. It depicts key metrics which includes content reach, unique visits, organic ranking, number of shares, rating, session time and repeat visitors. Showcasing this set of slides titled Freelance Content Marketing Dashboard With Metrics Demonstration PDF. The topics addressed in these templates are Organic Ranking, Manufacturing, Average Content Score. All the content presented in this PPT design is completely editable. Download it and make adjustments in color, background, font etc. as per your unique business setting.

Analysis Of Grains Fruits And Vegetables Segment In Food Manufacturing Industry Icons PDF
This slide showcase the market analysis of grains fruits and vegetables in food manufacturing industry providing information regarding top states, total production both weight and value wise, key export destinations and innovations in processing equipment. Deliver and pitch your topic in the best possible manner with this Analysis Of Grains Fruits And Vegetables Segment In Food Manufacturing Industry Icons PDF. Use them to share invaluable insights on Key Export Destination, Food Grains Worth, Processing Equipment and impress your audience. This template can be altered and modified as per your expectations. So, grab it now.
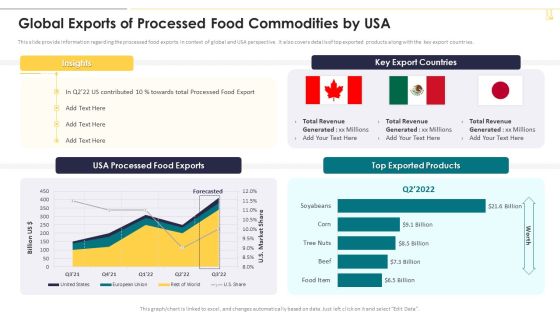
Global Exports Of Processed Food Commodities By Usa Graphics PDF
This slide provide information regarding the processed food exports in context of global and USA perspective. It also covers details of top exported products along with the key export countries. Deliver and pitch your topic in the best possible manner with this Global Exports Of Processed Food Commodities By Usa Graphics PDF. Use them to share invaluable insights on Top Exported Products, Key Export Countries, Total Revenue and impress your audience. This template can be altered and modified as per your expectations. So, grab it now.
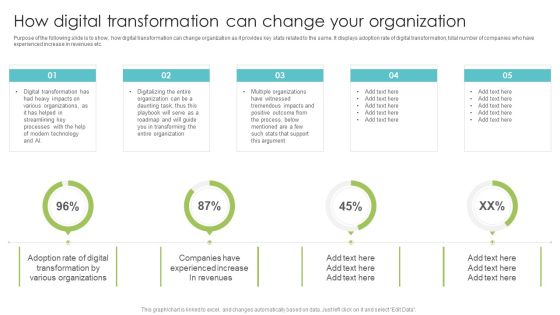
How Digital Transformation Can Change Your Organization Sample PDF
Purpose of the following slide is to show, how digital transformation can change organization as it provides key stats related to the same. It displays adoption rate of digital transformation, total number of companies who have experienced increase in revenues etc. Deliver an awe inspiring pitch with this creative How Digital Transformation Can Change Your Organization Sample PDF bundle. Topics like Revenues, Various Organizations, Modern Technology can be discussed with this completely editable template. It is available for immediate download depending on the needs and requirements of the user.

Business Performance Review Report To Evaluate Performance Of Sales Rep Infographics PDF
The following slide highlights quarterly business review QBR report which can be used by firm to evaluate the efficiency of sales rep. information covered in this slide is related to total sales by employees in different quarters, number of calls made. Pitch your topic with ease and precision using this Business Performance Review Report To Evaluate Performance Of Sales Rep Infographics PDF. This layout presents information on Revenue Sales, Tim Paine, Number Colds Calls. It is also available for immediate download and adjustment. So, changes can be made in the color, design, graphics or any other component to create a unique layout.
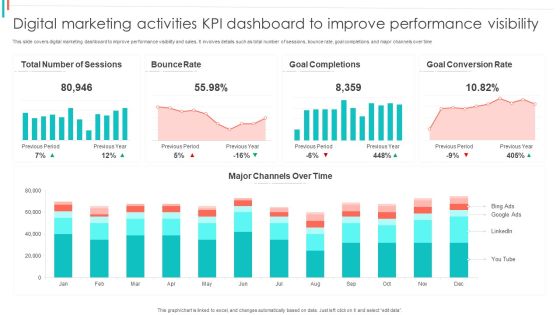
Digital Marketing Activities KPI Dashboard To Improve Performance Visibility Summary PDF
This slide covers digital marketing dashboard to improve performance visibility and sales. It involves details such as total number of sessions, bounce rate, goal completions and major channels over time.Showcasing this set of slides titled Digital Marketing Activities KPI Dashboard To Improve Performance Visibility Summary PDF. The topics addressed in these templates are Bounce Rate, Goal Completions, Goal Conversion. All the content presented in this PPT design is completely editable. Download it and make adjustments in color, background, font etc. as per your unique business setting.

Dashboard Depicting Sales Kpis To Track Current Status Structure PDF
This slide shows the dashboard that depicts sales KPIs to track current status which involves won and lost opportunities, revenues and pipeline by territory, sales by different products, etc. Deliver and pitch your topic in the best possible manner with this Dashboard Depicting Sales Kpis To Track Current Status Structure PDF. Use them to share invaluable insights on Total Opportunities, Revenue By Territory, Sales By Product and impress your audience. This template can be altered and modified as per your expectations. So, grab it now.

Customer Support Services Company Profile Gender Equality Index Ppt File Outline PDF
This slide highlights the gender equality index of call center company which includes total women employed in overall workforce, management positions, board of directors and executive committee. Deliver and pitch your topic in the best possible manner with this Customer Support Services Company Profile Gender Equality Index Ppt File Outline PDF. Use them to share invaluable insights on Women Employed, Overall Workforce, Management Positions, 2018 To 2022 and impress your audience. This template can be altered and modified as per your expectations. So, grab it now.

Disney Plus OTT Platform Company Summary Subscription And Svod Market Share Portrait PDF
The following slide highlights the market share of Disney in USA for subscription video on demand SVOD and total subscriptions for previous quarters. Deliver and pitch your topic in the best possible manner with this Disney Plus OTT Platform Company Summary Subscription And Svod Market Share Portrait PDF. Use them to share invaluable insights on SVOD Signups Market Share, Subscriptions Market Share, 2019 To 2022 and impress your audience. This template can be altered and modified as per your expectations. So, grab it now.
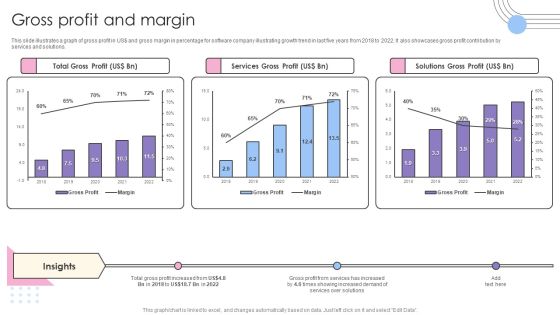
Software Products And Solutions Firm Details Gross Profit And Margin Pictures PDF
This slide illustrates a graph of gross profit in US dollar and gross margin in percentage for software company illustrating growth trend in last five years from 2018 to 2022. It also showcases gross profit contribution by services and solutions. Deliver and pitch your topic in the best possible manner with this Software Products And Solutions Firm Details Gross Profit And Margin Pictures PDF. Use them to share invaluable insights on Total Gross Profit, Services Gross Profit, Solutions Gross Profit and impress your audience. This template can be altered and modified as per your expectations. So, grab it now.
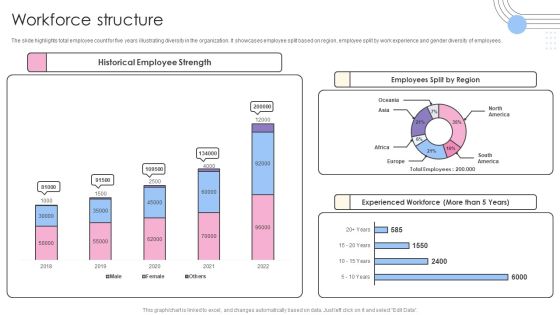
Software Products And Solutions Firm Details Workforce Structure Sample Background PDF
The slide highlights total employee count for five years illustrating diversity in the organization. It showcases employee split based on region, employee split by work experience and gender diversity of employees. Deliver an awe inspiring pitch with this creative Software Products And Solutions Firm Details Workforce Structure Sample Background PDF bundle. Topics like Historical Employee Strength, Employees Split Region, Experienced Workforce can be discussed with this completely editable template. It is available for immediate download depending on the needs and requirements of the user.

Sales Procedure Automation To Enhance Sales Dashboard Depicting Sales Kpis To Track Current Status Introduction PDF
This slide shows the dashboard that depicts sales KPIs to track current status which involves won and lost opportunities, revenues and pipeline by territory, sales by different products, etc.Deliver an awe inspiring pitch with this creative Sales Procedure Automation To Enhance Sales Dashboard Depicting Sales Kpis To Track Current Status Introduction PDF bundle. Topics like Won Opportunities, Total Opportunities, Pipeline Employee can be discussed with this completely editable template. It is available for immediate download depending on the needs and requirements of the user.

Logistics Shipment Company Profile Orders Distribution By Services Category In 2022 Designs PDF
The slide depicts the total orders distribution by services category illustrating percentage orders placed for each service including general freight, rail freight, sea freight, air freight, refrigerated freight and special services. Deliver an awe inspiring pitch with this creative Logistics Shipment Company Profile Orders Distribution By Services Category In 2022 Designs PDF bundle. Topics like Special Services, General Freight, Rail Freight can be discussed with this completely editable template. It is available for immediate download depending on the needs and requirements of the user.
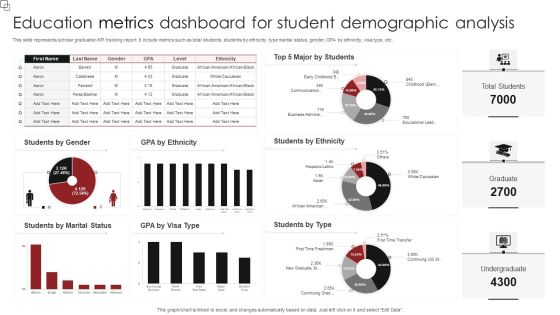
Education Metrics Dashboard For Student Demographic Analysis Diagrams PDF
This slide represents scholar graduation KPI tracking report. It include metrics such as total students, students by ethnicity, type marital status, gender, GPA by ethnicity, visa type, etc. Showcasing this set of slides titled Education Metrics Dashboard For Student Demographic Analysis Diagrams PDF. The topics addressed in these templates are Students Ethnicity, Students Type, Students Marital Status. All the content presented in this PPT design is completely editable. Download it and make adjustments in color, background, font etc. as per your unique business setting.

Quarterly Financial Performance Kpis With Balance Sheet Designs PDF
The given slide highlights the quarterly financial performance of a company. It also includes KPIs such as ROA, working capital ratio, return on equity, debt equity ratio etc. Pitch your topic with ease and precision using this Quarterly Financial Performance Kpis With Balance Sheet Designs PDF. This layout presents information on Total Liabilities, Return On Equity, Working Capital Ratio. It is also available for immediate download and adjustment. So, changes can be made in the color, design, graphics or any other component to create a unique layout.
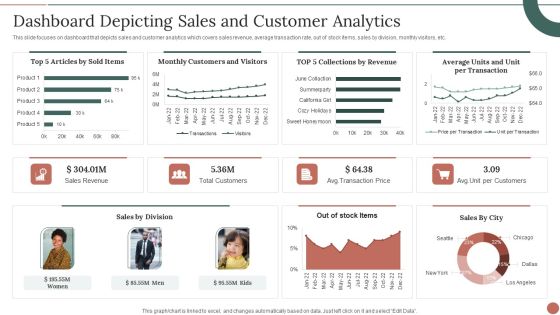
Retail Business Product Planning Procedure Dashboard Depicting Sales And Customer Analytics Themes PDF
This slide focuses on dashboard that depicts sales and customer analytics which covers sales revenue, average transaction rate, out of stock items, sales by division, monthly visitors, etc. Deliver and pitch your topic in the best possible manner with this Retail Business Product Planning Procedure Dashboard Depicting Sales And Customer Analytics Themes PDF. Use them to share invaluable insights on Sales Revenue, Total Customers, Sales By Division and impress your audience. This template can be altered and modified as per your expectations. So, grab it now.

Digitization Of Security Systems KPI Dashboard Ppt Summary Portfolio PDF
The following slide highlights a comprehensive dashboard used to analyze the performance of digitization of security systems. It provides information about total automations performed, records created, time taken by each security analyst, incidents by different groups etc. Showcasing this set of slides titled Digitization Of Security Systems KPI Dashboard Ppt Summary Portfolio PDF. The topics addressed in these templates are Automations Performed, Records Created, Hours Saved. All the content presented in this PPT design is completely editable. Download it and make adjustments in color, background, font etc. as per your unique business setting.

Social Network Promotion Campaign Performance Report Demonstration PDF
The purpose of this slide is to highlight the digital marketing campaigning performance report to track information in real-time like new leads acquired, total leads, and revenue on monthly basis. The leads generated through various platforms are Twitter, Facebook, LinkedIn, etc. Pitch your topic with ease and precision using this Social Network Promotion Campaign Performance Report Demonstration PDF. This layout presents information on Sales Ready Leads, New Leads, New Revenue. It is also available for immediate download and adjustment. So, changes can be made in the color, design, graphics or any other component to create a unique layout.

Company E Marketplace Overview With Net Sales Ppt Show Slides PDF
This slide showcases E-marketplace performance analysis to help company make appropriate strategies to improve overall customer experience. It includes details such as retail products, subscription services, total users, delivery partner, etc. Showcasing this set of slides titled Company E Marketplace Overview With Net Sales Ppt Show Slides PDF. The topics addressed in these templates are Visitors, Leads, Qualified Leads, Customers. All the content presented in this PPT design is completely editable. Download it and make adjustments in color, background, font etc. as per your unique business setting.

Business Software Development Company Profile Gross Profit And Margin Microsoft PDF
This slide illustrates a graph of gross profit in US dollar and gross margin in percentage for software company illustrating growth trend in last five years from 2018 to 2022. It also showcases gross profit contribution by services and solutions. Deliver and pitch your topic in the best possible manner with this Business Software Development Company Profile Gross Profit And Margin Microsoft PDF. Use them to share invaluable insights on Total Gross Profit, Services Gross Profit, Solutions Gross Profit and impress your audience. This template can be altered and modified as per your expectations. So, grab it now.
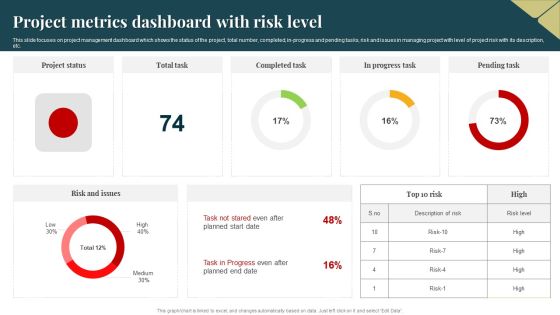
Project Metrics Dashboard With Risk Level Guidelines PDF
This slide focuses on project management dashboard which shows the status of the project, total number, completed, in progress and pending tasks, risk and issues in managing project with level of project risk with its description, etc. Pitch your topic with ease and precision using this Project Metrics Dashboard With Risk Level Guidelines PDF. This layout presents information on Project Metrics Dashboard, Risk Level. It is also available for immediate download and adjustment. So, changes can be made in the color, design, graphics or any other component to create a unique layout.
Infotech Solutions Research And Development Company Summary Company Patent Grants Icons PDF
This slide highlights the total patents granted to company in 2022 in multiple categories of IT, which includes AL and ML. cloud services, network design, cyber security and others. It also depicts historical patent trend with key insights. Deliver an awe inspiring pitch with this creative Infotech Solutions Research And Development Company Summary Company Patent Grants Icons PDF bundle. Topics like Network Design, Cyber Security, Cloud Services can be discussed with this completely editable template. It is available for immediate download depending on the needs and requirements of the user.
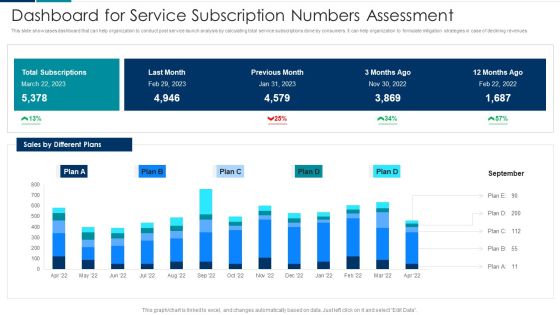
Managing New Service Roll Out And Marketing Procedure Dashboard For Service Subscription Numbers Assessment Clipart PDF
This slide showcases dashboard that can help organization to conduct post service launch analysis by calculating total service subscriptions done by consumers. It can help organization to formulate mitigation strategies in case of declining revenues. Deliver an awe inspiring pitch with this creative Managing New Service Roll Out And Marketing Procedure Dashboard For Service Subscription Numbers Assessment Clipart PDF bundle. Topics like Dashboard For Service, Subscription Numbers Assessment can be discussed with this completely editable template. It is available for immediate download depending on the needs and requirements of the user.

Call Centre Performance Dashboard With Customer Service Metrics Background PDF
This slide showcases dashboard for call centre performance that can help to evaluate the call abandon rate of customers and implement training of staff for improving customer satisfaction KPIs. Its key elements are total calls, avg answer speed and customer effort score. Showcasing this set of slides titled Call Centre Performance Dashboard With Customer Service Metrics Background PDF. The topics addressed in these templates are Call Centre Performance Dashboard, Customer Service Metrics. All the content presented in this PPT design is completely editable. Download it and make adjustments in color, background, font etc. as per your unique business setting.

Customer Service Metrics Dashboard With Average Resolve Time Sample PDF
This slide showcases dashboard for customer service metrics that can help to identify the issue escalations and prioritize them to solve them before expiry. Its key elements are total cases, resolutions, escalations, SLA complaint, avg resolve time and avg CSAT. Showcasing this set of slides titled Customer Service Metrics Dashboard With Average Resolve Time Sample PDF. The topics addressed in these templates are Customer Service, Metrics Dashboard, Average Resolve Time. All the content presented in this PPT design is completely editable. Download it and make adjustments in color, background, font etc. as per your unique business setting.
Technology Disaster Recovery Plan Current Situation Of The Client Company Icons PDF
This slide depicts the current situation of the client company by displaying the total number of breaches due to hacking, the number of errors, the percentage of social attacks, and so on. Deliver and pitch your topic in the best possible manner with this Technology Disaster Recovery Plan Current Situation Of The Client Company Icons PDF. Use them to share invaluable insights on Organized, Social and impress your audience. This template can be altered and modified as per your expectations. So, grab it now.

Dashboard For Insider Threat In Cyber Security Cases Management Background PDF
This slide shows insider threat dashboard for managing multiple cases. It provides information such as active and closed, high and low risk cases, status, user, case time, policy alerts, content update, etc. Showcasing this set of slides titled Dashboard For Insider Threat In Cyber Security Cases Management Background PDF. The topics addressed in these templates are Total Policy Alerts, High, Low, Time Case Opened. All the content presented in this PPT design is completely editable. Download it and make adjustments in color, background, font etc. as per your unique business setting.

Metrics For Purchase And Free Trials Generated Through Campaign Slides PDF
This template covers about paying members, total purchase with free trial pay up rate and free trial pay up rate. Further, it covers about monthly unique visitors. Showcasing this set of slides titled Metrics For Purchase And Free Trials Generated Through Campaign Slides PDF. The topics addressed in these templates are Metrics For Purchase, Generated Through Campaign. All the content presented in this PPT design is completely editable. Download it and make adjustments in color, background, font etc. as per your unique business setting.

Web Analysis Summary KPI Dashboard With Visit Trends Professional PDF
This slide covers website analytics report KPI dashboard to track website performance. It involves details such as total number of visits, visit trends by medium, pagers per visit and new vs returning visitors. Pitch your topic with ease and precision using this Web Analysis Summary KPI Dashboard With Visit Trends Professional PDF. This layout presents information on Web Analysis Summary, KPI Dashboard, Visit Trends. It is also available for immediate download and adjustment. So, changes can be made in the color, design, graphics or any other component to create a unique layout.

Information Science Why Is Data Science Needed In The Organization Ppt PowerPoint Presentation Slide Download PDF
This slide defines the need of the data science in the organization, the amount of the total data, structured data, and unstructured data, which is not possible to manage by BI tool anymore.Deliver an awe inspiring pitch with this creative Information Science Why Is Data Science Needed In The Organization Ppt PowerPoint Presentation Slide Download PDF bundle. Topics like Organized Manner, Advanced Mechanism, Information Through can be discussed with this completely editable template. It is available for immediate download depending on the needs and requirements of the user.

Analysis Of Grains Fruits And Vegetables Segment In Food Manufacturing Industry Mockup PDF
This slide showcase the market analysis of grains fruits and vegetables in food manufacturing industry providing information regarding top states, total production both weight and value wise, key export destinations and innovations in processing equipment.Deliver and pitch your topic in the best possible manner with this Analysis Of Grains Fruits And Vegetables Segment In Food Manufacturing Industry Mockup PDF. Use them to share invaluable insights on Vegetables Production, Innovations Processing, Packhouses Storages and impress your audience. This template can be altered and modified as per your expectations. So, grab it now.
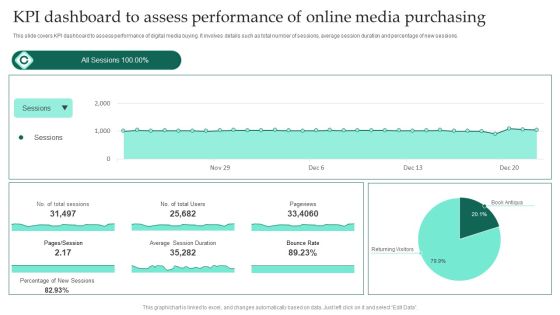
KPI Dashboard To Assess Performance Of Online Media Purchasing Ppt Professional Grid PDF
This slide covers KPI dashboard to assess performance of digital media buying. It involves details such as total number of sessions, average session duration and percentage of new sessions. Showcasing this set of slides titled KPI Dashboard To Assess Performance Of Online Media Purchasing Ppt Professional Grid PDF. The topics addressed in these templates are Average Session Duration, Bounce Rate, Pageviews. All the content presented in this PPT design is completely editable. Download it and make adjustments in color, background, font etc. as per your unique business setting.

IT Application Services Company Outline Company Patent Grants Introduction PDF
This slide highlights the total patents granted to company in 2022 in multiple categories of IT, which includes AL and ML. cloud services, network design, cyber security and others. It also depicts historical patent trend with key insights. Deliver an awe inspiring pitch with this creative IT Application Services Company Outline Company Patent Grants Introduction PDF bundle. Topics like Approval Rate, Company Patent Grants can be discussed with this completely editable template. It is available for immediate download depending on the needs and requirements of the user.
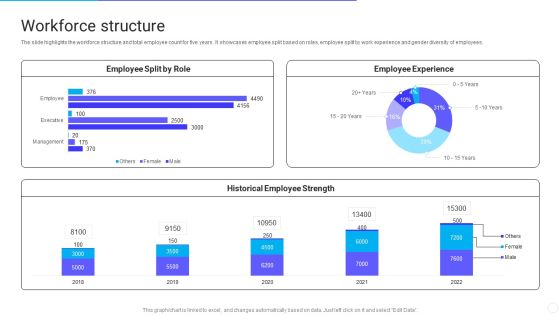
IT Application Services Company Outline Workforce Structure Introduction PDF
The slide highlights the workforce structure and total employee count for five years. It showcases employee split based on roles, employee split by work experience and gender diversity of employees. Deliver and pitch your topic in the best possible manner with this IT Application Services Company Outline Workforce Structure Introduction PDF. Use them to share invaluable insights on Employee Split By Role, Employee Experience, Historical Employee Strength and impress your audience. This template can be altered and modified as per your expectations. So, grab it now.

Retail Outlet Operational Efficiency Analytics Overview Of Retail Stores Rules PDF
This slide provides information regarding retail company in terms of headquarters, revenues, total number of employees, number of stores across USA. It also covers details of common operational challenges faced by stores. Deliver an awe inspiring pitch with this creative Retail Outlet Operational Efficiency Analytics Overview Of Retail Stores Rules PDF bundle. Topics like Retail Stores, Across USA, Common Operational Challenges can be discussed with this completely editable template. It is available for immediate download depending on the needs and requirements of the user.

Company Patent Grants IT Software Development Company Profile Introduction PDF
This slide highlights the total patents granted to company in 2022 in multiple categories of IT, which includes AL and ML. cloud services, network design, cyber security and others. It also depicts historical patent trend with key insights. Deliver and pitch your topic in the best possible manner with this Company Patent Grants IT Software Development Company Profile Introduction PDF. Use them to share invaluable insights on Company Patent Summary, Historical Patent Trend and impress your audience. This template can be altered and modified as per your expectations. So, grab it now.

Customer Client Referral Program Performance Dashboard Ppt File Visual Aids PDF
This slide covers customer referral program performance evaluating dashboard. It involves participation rate by referrals, number of referred customers, conversion rate and total revenue generated. Pitch your topic with ease and precision using this Customer Client Referral Program Performance Dashboard Ppt File Visual Aids PDF. This layout presents information on Participation Rate Referrals, Number Referred Customers, Referral Conversion Rate. It is also available for immediate download and adjustment. So, changes can be made in the color, design, graphics or any other component to create a unique layout.
Youtube Video Marketing Analytics Dashboard Ppt Icon Portrait PDF
This slide covers dashboard illustrating performance of ad campaigns on YouTube. It includes elements such as total gained subscribers, likes, dislikes, daily active users, views, campaign performance, traffic sources by views, etc. Pitch your topic with ease and precision using this Youtube Video Marketing Analytics Dashboard Ppt Icon Portrait PDF. This layout presents information on Average Vies, Per Week, Campaigns, Traffic Sources. It is also available for immediate download and adjustment. So, changes can be made in the color, design, graphics or any other component to create a unique layout.

Digitalization Guide For Business How Digital Transformation Can Change Your Organization Background PDF
Purpose of the following slide is to show, how digital transformation can change organization as it provides key stats related to the same. It displays adoption rate of digital transformation, total number of companies who have experienced increase in revenues etc. Deliver an awe inspiring pitch with this creative Digitalization Guide For Business How Digital Transformation Can Change Your Organization Background PDF bundle. Topics like Adoption Rate, Digital Transformation, Various Organizations can be discussed with this completely editable template. It is available for immediate download depending on the needs and requirements of the user.
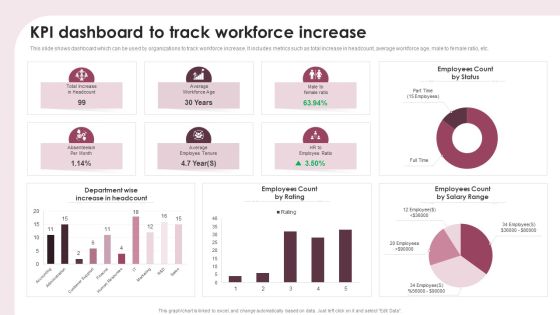
KPI Dashboard To Track Workforce Increase Ppt Show Portfolio PDF
This slide shows dashboard which can be used by organizations to track workforce increase. It includes metrics such as total increase in headcount, average workforce age, male to female ratio, etc. Pitch your topic with ease and precision using this KPI Dashboard To Track Workforce Increase Ppt Show Portfolio PDF. This layout presents information on Department Wise, Increase Headcount, Employees Count Rating. It is also available for immediate download and adjustment. So, changes can be made in the color, design, graphics or any other component to create a unique layout.
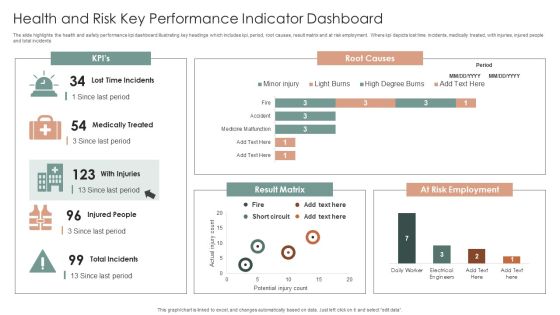
Health And Risk Key Performance Indicator Dashboard Ppt Layouts Graphics Design PDF
The slide highlights the health and safety performance kpi dashboard illustrating key headings which includes kpi, period, root causes, result matrix and at risk employment. Where kpi depicts lost time incidents, medically treated, with injuries, injured people and total incidents. Showcasing this set of slides titled Health And Risk Key Performance Indicator Dashboard Ppt Layouts Graphics Design PDF. The topics addressed in these templates are Root Causes, Result Matrix, At Risk Employment. All the content presented in this PPT design is completely editable. Download it and make adjustments in color, background, font etc. as per your unique business setting.

Health And Risk KPI Dashboard Ppt Pictures Designs Download PDF
The slide highlights the health and safety key performance indicator dashboard illustrating key headings which includes key objectives, inspections, total reports vs over due reports, injuries by body part and accident trends. Pitch your topic with ease and precision using this Health And Risk KPI Dashboard Ppt Pictures Designs Download PDF. This layout presents information on Key Objectives, Inspections, Accidents Trends. It is also available for immediate download and adjustment. So, changes can be made in the color, design, graphics or any other component to create a unique layout.
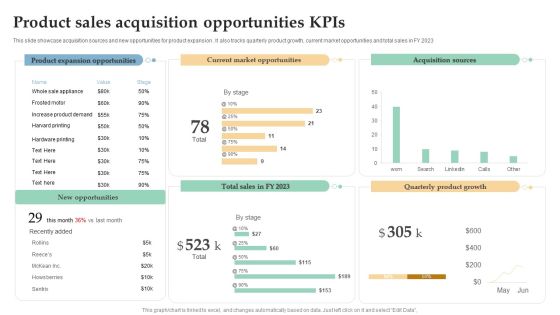
Product Sales Acquisition Opportunities Kpis Ppt Pictures Slide PDF
This slide showcase acquisition sources and new opportunities for product expansion . It also tracks quarterly product growth, current market opportunities and total sales in FY 2023. Pitch your topic with ease and precision using this Product Sales Acquisition Opportunities Kpis Ppt Pictures Slide PDF. This layout presents information on Product Expansion Opportunities, Current Market Opportunities, Acquisition Sources. It is also available for immediate download and adjustment. So, changes can be made in the color, design, graphics or any other component to create a unique layout.
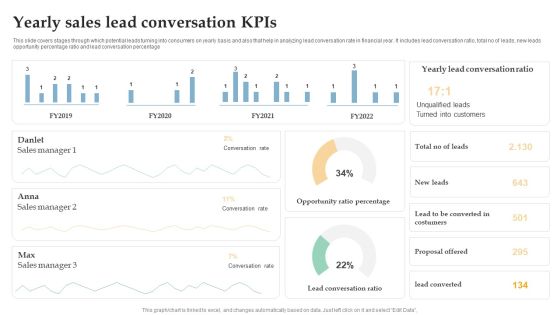
Yearly Sales Lead Conversation Kpis Ppt Inspiration Brochure PDF
This slide covers stages through which potential leads turning into consumers on yearly basis and also that help in analyzing lead conversation rate in financial year. It includes lead conversation ratio, total no of leads, new leads opportunity percentage ratio and lead conversation percentage. Pitch your topic with ease and precision using this Yearly Sales Lead Conversation Kpis Ppt Inspiration Brochure PDF. This layout presents information on Sales Manager, Conversation Rate, Opportunity Ratio Percentage. It is also available for immediate download and adjustment. So, changes can be made in the color, design, graphics or any other component to create a unique layout.
Consumer Journey Mapping Techniques Referral Program Performance Tracking Dashboard Formats PDF
This slide covers the KPI dashboard for analyzing referral campaign results. It includes metrics such as total revenue generated, monthly recurring revenue, new customers, clicks, cancelled customers, paying customers, etc. Showcasing this set of slides titled Consumer Journey Mapping Techniques Referral Program Performance Tracking Dashboard Formats PDF. The topics addressed in these templates are Revenue, New Customers, Paying Customers. All the content presented in this PPT design is completely editable. Download it and make adjustments in color, background, font etc. as per your unique business setting.

Competitors Global Market Share And Earnings Comparative Analysis Report Slides PDF
This slide covers comparison matrix of company and competitors market share and revenue. It also includes pie chart depicting the total global revenue market share. Showcasing this set of slides titled Competitors Global Market Share And Earnings Comparative Analysis Report Slides PDF. The topics addressed in these templates are Revenue, Global Market Share, Earnings Comparative Analysis Report. All the content presented in this PPT design is completely editable. Download it and make adjustments in color, background, font etc. as per your unique business setting.
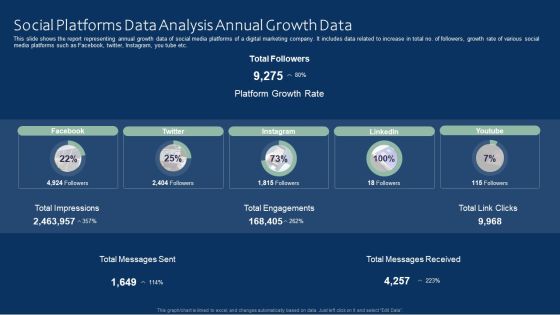
Social Platforms Data Analysis Annual Growth Data Ideas PDF
This slide shows the report representing annual growth data of social media platforms of a digital marketing company. It includes data related to increase in total no. of followers, growth rate of various social media platforms such as Facebook, twitter, Instagram, you tube etc. Pitch your topic with ease and precision using this Social Platforms Data Analysis Annual Growth Data Ideas PDF. This layout presents information on Social Platforms Data Analysis, Annual Growth Data. It is also available for immediate download and adjustment. So, changes can be made in the color, design, graphics or any other component to create a unique layout.

Departmental Tracking Goals Progress Dashboard Diagrams PDF
This slide depicts a progress chart for maintaining transparency and alignment in tracking cross-functional goals. It also includes organizational objective details such as total on track objectives, recently updated, overall progress, etc. Showcasing this set of slides titled Departmental Tracking Goals Progress Dashboard Diagrams PDF. The topics addressed in these templates are Departmental Tracking Goals, Progress Dashboard . All the content presented in this PPT design is completely editable. Download it and make adjustments in color, background, font etc. as per your unique business setting.
Tracking Goals Alignment KPI Dashboard Guidelines PDF
This slide showcases a tracking dashboard for determining the alignment and progress percentage of the assigned objectives. It also includes the objective evaluation KPIs such as active objectives, overall progress, total employees, objective as per employees, aligned, organizational and departmental objectives. Pitch your topic with ease and precision using this Tracking Goals Alignment KPI Dashboard Guidelines PDF. This layout presents information on Employee, Organizational Objectives, Departmental Objectives. It is also available for immediate download and adjustment. So, changes can be made in the color, design, graphics or any other component to create a unique layout.
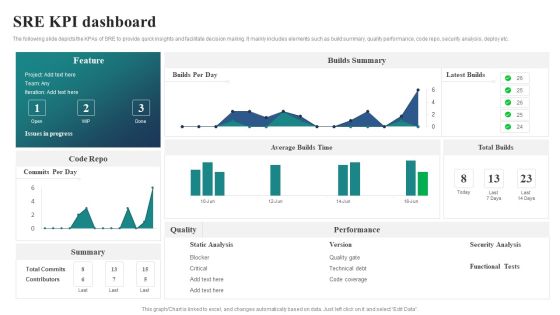
SRE KPI Dashboard Ppt PowerPoint Presentation File Slide Portrait PDF
The following slide depicts the KPAs of SRE to provide quick insights and facilitate decision making. It mainly includes elements such as build summary, quality performance, code repo, security analysis, deploy etc. Showcasing this set of slides titled SRE KPI Dashboard Ppt PowerPoint Presentation File Slide Portrait PDF. The topics addressed in these templates are Builds Summary, Latest Builds, Total Builds. All the content presented in this PPT design is completely editable. Download it and make adjustments in color, background, font etc. as per your unique business setting.
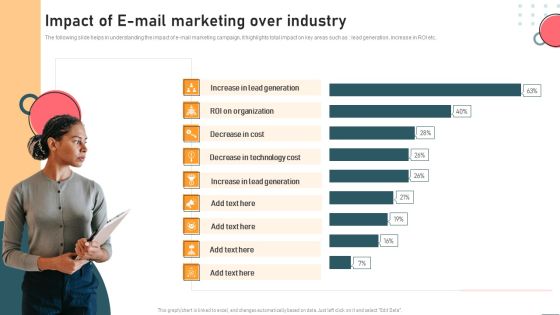
Impact Of E Mail Marketing Over Industry Information PDF
The following slide helps in understanding the impact of e mail marketing campaign, it highlights total impact on key areas such as lead generation, increase in ROI etc. From laying roadmaps to briefing everything in detail, our templates are perfect for you. You can set the stage with your presentation slides. All you have to do is download these easy to edit and customizable templates. Impact Of E Mail Marketing Over Industry Information PDF will help you deliver an outstanding performance that everyone would remember and praise you for. Do download this presentation today.

Inbound Leads Generation And Conversion Analytics Ppt Summary Show PDF
This slide covers record of prospects visits and leads generated using different sources. It includes sources such as organic search, referrals, social media, email marketing, paid search, direct traffic, etc. along with total visits, conversion rates, contacts generated, customers count, conversion rates and graph depicting monthly visits using these sources. Showcasing this set of slides titled Inbound Leads Generation And Conversion Analytics Ppt Summary Show PDF. The topics addressed in these templates are Organic Search, Referrals, Social Media. All the content presented in this PPT design is completely editable. Download it and make adjustments in color, background, font etc. as per your unique business setting.

Financial Services Organization Monthly Sales Forecast Dashboard Ppt Summary Slideshow PDF
This slide shows the dashboard representing data related to monthly sales forecast of the organization offering financial services to its clients. It includes information related to forecasted data, sales forecast, total sales, forecast projection etc. Showcasing this set of slides titled Financial Services Organization Monthly Sales Forecast Dashboard Ppt Summary Slideshow PDF. The topics addressed in these templates are Forecasts Sales, Time Series View, Forecast Projection. All the content presented in this PPT design is completely editable. Download it and make adjustments in color, background, font etc. as per your unique business setting.
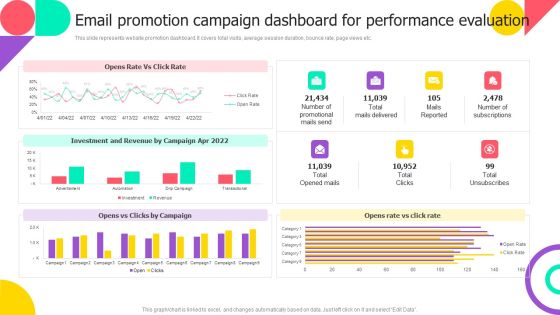
Email Promotion Campaign Dashboard For Performance Evaluation Pictures PDF
This slide represents website promotion dashboard. It covers total visits, average session duration, bounce rate, page views etc. Want to ace your presentation in front of a live audience Our Email Promotion Campaign Dashboard For Performance Evaluation Pictures PDF can help you do that by engaging all the users towards you. Slidegeeks experts have put their efforts and expertise into creating these impeccable powerpoint presentations so that you can communicate your ideas clearly. Moreover, all the templates are customizable, and easy to edit and downloadable. Use these for both personal and commercial use.

Application Of Artificial Intelligence AI Driven Dashboard With Website Kpis Formats PDF
This slide shows AI driven dashboard with website KPIs. It provides information such as total visits, traffic sources, geography, bounce rate, monthly visits, average visit time, etc. Showcasing this set of slides titled Application Of Artificial Intelligence AI Driven Dashboard With Website Kpis Formats PDF. The topics addressed in these templates are Bounce Rate, Monthly Visits, Traffic Sources. All the content presented in this PPT design is completely editable. Download it and make adjustments in color, background, font etc. as per your unique business setting.

Continuous Integration Dashboard For Automated Testing Framework Ppt Layouts Layout Ideas PDF
This slide shows continuous integration dashboard for test automation framework which can be referred by authors to review their testing performance. It contains information about weekly change volume by author, monthly change volume by author, repository, etc. Pitch your topic with ease and precision using this Continuous Integration Dashboard For Automated Testing Framework Ppt Layouts Layout Ideas PDF. This layout presents information on Total Changes Volume, Monthly Change Volume, Weekly Change Volume. It is also available for immediate download and adjustment. So, changes can be made in the color, design, graphics or any other component to create a unique layout.
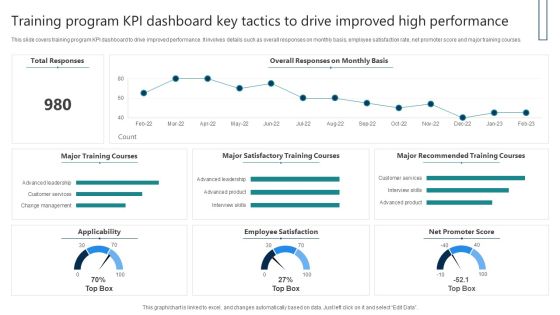
Training Program KPI Dashboard Key Tactics To Drive Improved High Performance Download PDF
This slide covers training program KPI dashboard to drive improved performance. It involves details such as overall responses on monthly basis, employee satisfaction rate, net promoter score and major training courses. Showcasing this set of slides titled Training Program KPI Dashboard Key Tactics To Drive Improved High Performance Download PDF. The topics addressed in these templates are Total Responses, Major Training Courses, Employee Satisfaction. All the content presented in this PPT design is completely editable. Download it and make adjustments in color, background, font etc. as per your unique business setting.

Sales Performance Monitoring Dashboard With Customer Details Ppt Infographics Themes PDF
This slide illustrates sales performance tracking dashboard with critical information. It provides information about customer details, invoice, earnings, leads, pending delivery, revenue, etc. Pitch your topic with ease and precision using this Sales Performance Monitoring Dashboard With Customer Details Ppt Infographics Themes PDF. This layout presents information on Todays Revenue, Today Delivered, Pending Delivery, Total Leads. It is also available for immediate download and adjustment. So, changes can be made in the color, design, graphics or any other component to create a unique layout.
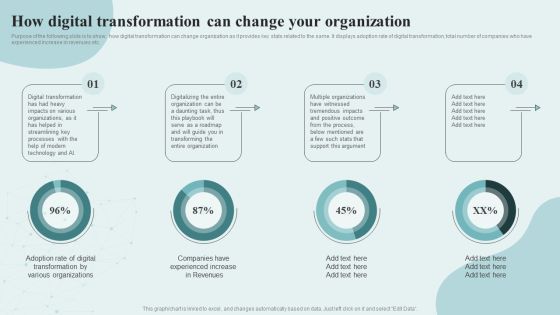
Digital Competency Evaluation And Modification How Digital Transformation Can Change Your Formats PDF
Purpose of the following slide is to show, how digital transformation can change organization as it provides key stats related to the same. It displays adoption rate of digital transformation, total number of companies who have experienced increase in revenues etc. There are so many reasons you need a Digital Competency Evaluation And Modification How Digital Transformation Can Change Your Formats PDF. The first reason is you cant spend time making everything from scratch, Thus, Slidegeeks has made presentation templates for you too. You can easily download these templates from our website easily.
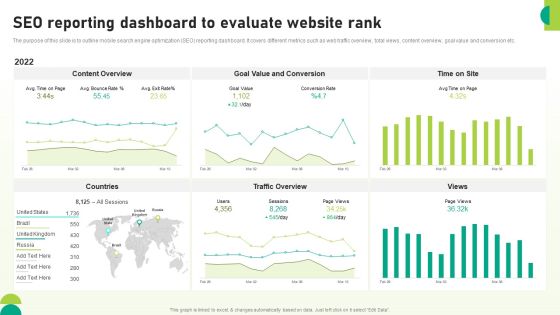
Utilizing SEO To Boost Customer SEO Reporting Dashboard To Evaluate Website Rank Background PDF
The purpose of this slide is to outline mobile search engine optimization SEO reporting dashboard. It covers different metrics such as web traffic overview, total views, content overview, goal value and conversion etc. Take your projects to the next level with our ultimate collection of Utilizing SEO To Boost Customer SEO Reporting Dashboard To Evaluate Website Rank Background PDF. Slidegeeks has designed a range of layouts that are perfect for representing task or activity duration, keeping track of all your deadlines at a glance. Tailor these designs to your exact needs and give them a truly corporate look with your own brand colors theyll make your projects stand out from the rest.

International Design And Architecture Firm Competitive Analysis Slides PDF
This slide highlights the architecture company competitive analysis on the basis of total experience, projects completed, registered architect and professional engineer, company offices, and free cash flow. This International Design And Architecture Firm Competitive Analysis Slides PDF is perfect for any presentation, be it in front of clients or colleagues. It is a versatile and stylish solution for organizing your meetings. The International Design And Architecture Firm Competitive Analysis Slides PDF features a modern design for your presentation meetings. The adjustable and customizable slides provide unlimited possibilities for acing up your presentation. Slidegeeks has done all the homework before launching the product for you. So, dont wait, grab the presentation templates today.

Global Food Industry Revenue Generation Year Over Year Growth Launching New Beverage Product Themes PDF
The following slide outlines the total market revenue and growth of food beverage industry. The revenue of the food industry is covered from 2015-2022. Slidegeeks has constructed Global Food Industry Revenue Generation Year Over Year Growth Launching New Beverage Product Themes PDF after conducting extensive research and examination. These presentation templates are constantly being generated and modified based on user preferences and critiques from editors. Here, you will find the most attractive templates for a range of purposes while taking into account ratings and remarks from users regarding the content. This is an excellent jumping-off point to explore our content and will give new users an insight into our top-notch PowerPoint Templates.
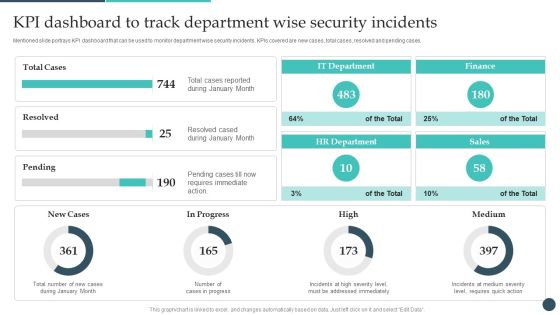
Safety Breach Response Playbook KPI Dashboard To Track Department Wise Rules PDF
Mentioned slide portrays KPI dashboard that can be used to monitor department wise security incidents. KPIs covered are new cases, total cases, resolved and pending cases. Present like a pro with Safety Breach Response Playbook KPI Dashboard To Track Department Wise Rules PDF Create beautiful presentations together with your team, using our easy-to-use presentation slides. Share your ideas in real-time and make changes on the fly by downloading our templates. So whether youre in the office, on the go, or in a remote location, you can stay in sync with your team and present your ideas with confidence. With Slidegeeks presentation got a whole lot easier. Grab these presentations today.

Brand Equity Valuation Of Top 10 IT Companies Ppt Portfolio Rules PDF
This slide showcase top 10 information technology companies brand value comparison chart understanding their position in market. It includes elements such as companies name, brand value, and key insights. Pitch your topic with ease and precision using this Brand Equity Valuation Of Top 10 IT Companies Ppt Portfolio Rules PDF. This layout presents information on Highest Market Value, Total Value, Brand Valuation. It is also available for immediate download and adjustment. So, changes can be made in the color, design, graphics or any other component to create a unique layout.

Insurance Policy Usage Stacked Percentage Graph Template PDF
This slide illustrates use of insurance policy types percentage chart in USA to determine total number of insurances taken. It includes cities and insurance policy percentage. Pitch your topic with ease and precision using this Insurance Policy Usage Stacked Percentage Graph Template PDF. This layout presents information on Motor Vehicle Policies, More Population, Migration Of People. It is also available for immediate download and adjustment. So, changes can be made in the color, design, graphics or any other component to create a unique layout.

Company Age Wise Employee Count Column Chart With Key Insights Microsoft PDF
This slide illustrates employee count by age to find the recruitment rate for company. It includes aspects such as the number of employees and age.Pitch your topic with ease and precision using this Company Age Wise Employee Count Column Chart With Key Insights Microsoft PDF. This layout presents information on Employees Working, Total Workforce, Require Replacement. It is also available for immediate download and adjustment. So, changes can be made in the color, design, graphics or any other component to create a unique layout.
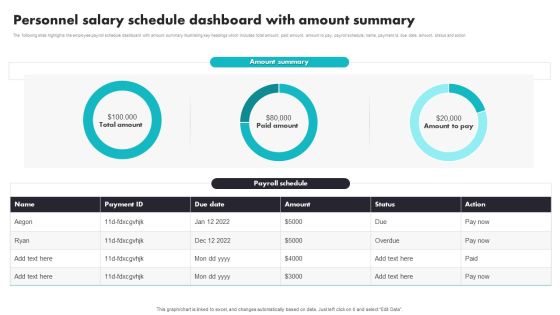
Personnel Salary Schedule Dashboard With Amount Summary Background PDF
The following slide highlights the employee payroll schedule dashboard with amount summary illustrating key headings which includes total amount, paid amount, amount to pay, payroll schedule, name, payment id, due date, amount, status and action. Showcasing this set of slides titled Personnel Salary Schedule Dashboard With Amount Summary Background PDF. The topics addressed in these templates are Personnel Salary Schedule, Dashboard With Amount Summary. All the content presented in this PPT design is completely editable. Download it and make adjustments in color, background, font etc. as per your unique business setting.
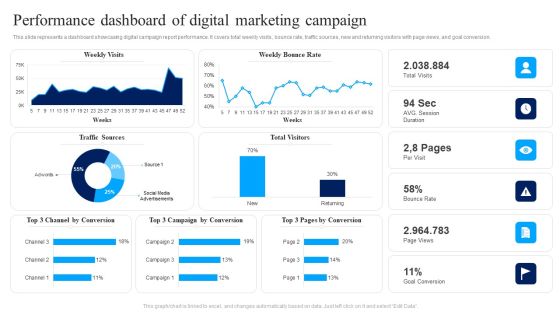
Performance Dashboard Of Digital Marketing Campaign Ppt Show Slide PDF
This slide represents a dashboard showcasing digital campaign report performance. It covers total weekly visits, bounce rate, traffic sources, new and returning visitors with page views, and goal conversion. Pitch your topic with ease and precision using this Performance Dashboard Of Digital Marketing Campaign Ppt Show Slide PDF. This layout presents information on Weekly Visits, Weekly Bounce Rate, Bounce Rate. It is also available for immediate download and adjustment. So, changes can be made in the color, design, graphics or any other component to create a unique layout.
Effect Of Pandemic On Education By Global School Closures Icons PDF
The slide illustrates the impact of COVID-19 on schools worldwide to estimate the educational loss to learners. The data included is the number of learners impacted by COVID from march 25 to april 30, 2020. Pitch your topic with ease and precision using this Effect Of Pandemic On Education By Global School Closures Icons PDF. This layout presents information on Total Estimated, Localized Level Educational, Institutions Closure. It is also available for immediate download and adjustment. So, changes can be made in the color, design, graphics or any other component to create a unique layout.

Data Breach Threats Stats On Social Media Platforms And Incident Sources Introduction PDF
This slide covers trends on social media data breach incidents reported. It also includes various sources of data theft such as malicious outsider, accidental loss, malicious insider, hacker, etc. Pitch your topic with ease and precision using this Data Breach Threats Stats On Social Media Platforms And Incident Sources Introduction PDF. This layout presents information on Number Breach, Total Incidents, Malicious Insider. It is also available for immediate download and adjustment. So, changes can be made in the color, design, graphics or any other component to create a unique layout.

Deployment Of Workplace Safety Management Program Increasing Number Of Workplace Injuries Background PDF
The following slide showcases total number and rate of workplace injuries in last 5 years which have increased due to lack of safety measures and safety training provided to employees in the organization. Take your projects to the next level with our ultimate collection of Deployment Of Workplace Safety Management Program Increasing Number Of Workplace Injuries Background PDF. Slidegeeks has designed a range of layouts that are perfect for representing task or activity duration, keeping track of all your deadlines at a glance. Tailor these designs to your exact needs and give them a truly corporate look with your own brand colors they will make your projects stand out from the rest.

Retail Store Operations Overview Of Retail Stores Ppt Infographic Template File Formats PDF
This slide provides information regarding retail company in terms of headquarters, revenues, total number of employees, number of stores across USA. It also covers details of common operational challenges faced by stores. Take your projects to the next level with our ultimate collection of Retail Store Operations Overview Of Retail Stores Ppt Infographic Template File Formats PDF. Slidegeeks has designed a range of layouts that are perfect for representing task or activity duration, keeping track of all your deadlines at a glance. Tailor these designs to your exact needs and give them a truly corporate look with your own brand colors theyll make your projects stand out from the rest.

Strategies For Effective Product Metric Dashboard To Measure Product Performance Download PDF
This slide represents KPI dashboard for measuring product performance. It covers total activities, new customers, events, net promoter score etc. Welcome to our selection of the Strategies For Effective Product Metric Dashboard To Measure Product Performance Download PDF. These are designed to help you showcase your creativity and bring your sphere to life. Planning and Innovation are essential for any business that is just starting out. This collection contains the designs that you need for your everyday presentations. All of our PowerPoints are 100 percent editable, so you can customize them to suit your needs. This multi-purpose template can be used in various situations. Grab these presentation templates today.
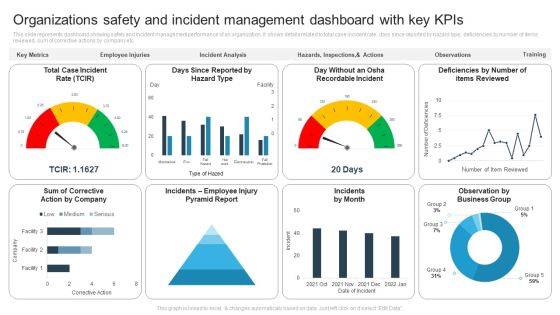
Organizations Safety And Incident Management Dashboard With Key Kpis Themes PDF
This slide represents dashboard showing safety and incident management performance of an organization. It shows details related to total case incident rate, days since reported by hazard type, deficiencies by number of items reviewed, sum of corrective actions by company etc. Showcasing this set of slides titled Organizations Safety And Incident Management Dashboard With Key Kpis Themes PDF. The topics addressed in these templates are Incidents By Month, Observation By Business Group. All the content presented in this PPT design is completely editable. Download it and make adjustments in color, background, font etc. as per your unique business setting.
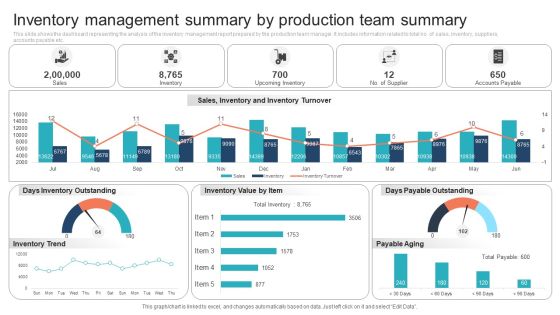
Inventory Management Summary By Production Team Summary Designs PDF
This slide shows the dashboard representing the analysis of the inventory management report prepared by the production team manager. It includes information related to total no. of sales, inventory, suppliers, accounts payable etc. Pitch your topic with ease and precision using this Inventory Management Summary By Production Team Summary Designs PDF. This layout presents information on Days Inventory Outstanding, Inventory Value By Item. It is also available for immediate download and adjustment. So, changes can be made in the color, design, graphics or any other component to create a unique layout.
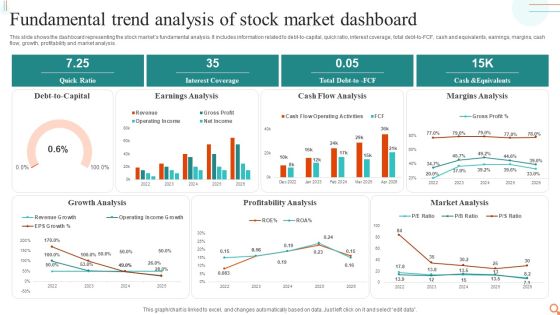
Fundamental Trend Analysis Of Stock Market Dashboard Professional PDF
This slide shows the dashboard representing the stock markets fundamental analysis. It includes information related to debt-to-capital, quick ratio, interest coverage, total debt-to-FCF, cash and equivalents, earnings, margins, cash flow, growth, profitability and market analysis.Showcasing this set of slides titled Fundamental Trend Analysis Of Stock Market Dashboard Professional PDF. The topics addressed in these templates are Earnings Analysis, Cash Flow Analysis, Margins Analysis. All the content presented in this PPT design is completely editable. Download it and make adjustments in color, background, font etc. as per your unique business setting.
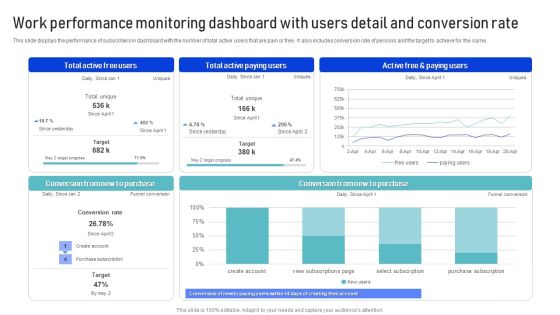
Work Performance Monitoring Dashboard With Users Detail And Conversion Rate Template PDF
This slide displays the performance of subscribers in dashboard with the number of total active users that are pain or free. It also includes conversion rate of persons and the target to achieve for the same. Showcasing this set of slides titled Work Performance Monitoring Dashboard With Users Detail And Conversion Rate Template PDF. The topics addressed in these templates are Purchase, Conversion Rate, Target. All the content presented in this PPT design is completely editable. Download it and make adjustments in color, background, font etc. as per your unique business setting.
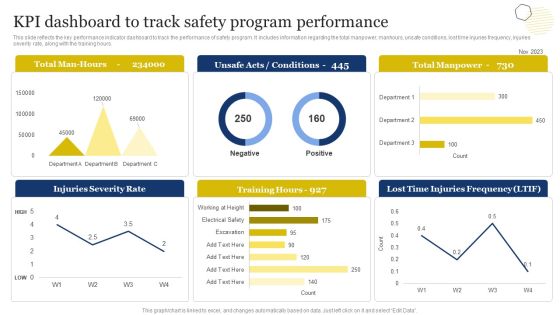
Improvement Of Safety Performance At Construction Site Kpi Dashboard To Track Safety Program Microsoft PDF
This slide reflects the key performance indicator dashboard to track the performance of safety program. It includes information regarding the total manpower, manhours, unsafe conditions, lost time injuries frequency, injuries severity rate, along with the training hours. Make sure to capture your audiences attention in your business displays with our gratis customizable Improvement Of Safety Performance At Construction Site Kpi Dashboard To Track Safety Program Microsoft PDF. These are great for business strategies, office conferences, capital raising or task suggestions. If you desire to acquire more customers for your tech business and ensure they stay satisfied, create your own sales presentation with these plain slides.
Robotic Process Automation Dashboard With Monthly Test Execution KPI Icons PDF
This slide covers RPA metrics for analyzing test execution on automated platforms. It also includes test execution metrics such as total test executed, test status, tests executed daily for different operation systems, etc. Pitch your topic with ease and precision using this Robotic Process Automation Dashboard With Monthly Test Execution KPI Icons PDF. This layout presents information on Robotic Process Automation Dashboard, Monthly Test Execution Kpi. It is also available for immediate download and adjustment. So, changes can be made in the color, design, graphics or any other component to create a unique layout.
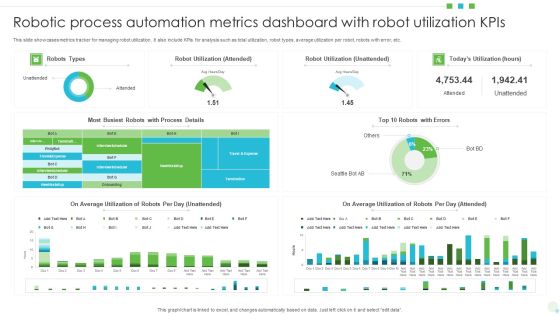
Robotic Process Automation Metrics Dashboard With Robot Utilization Kpis Background PDF
This slide showcases metrics tracker for managing robot utilization. It also include KPIs for analysis such as total utilization, robot types, average utilization per robot, robots with error, etc. Pitch your topic with ease and precision using this Robotic Process Automation Metrics Dashboard With Robot Utilization Kpis Background PDF. This layout presents information on Average Utilization, Robot Utilization, Automation Metrics Dashboard. It is also available for immediate download and adjustment. So, changes can be made in the color, design, graphics or any other component to create a unique layout.
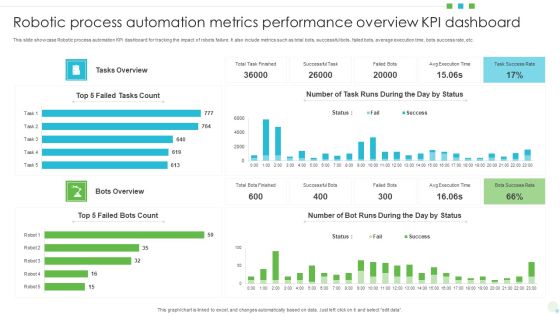
Robotic Process Automation Metrics Performance Overview KPI Dashboard Download PDF
This slide showcase Robotic process automation KPI dashboard for tracking the impact of robots failure. It also include metrics such as total bots, successful bots, failed bots, average execution time, bots success rate, etc. Showcasing this set of slides titled Robotic Process Automation Metrics Performance Overview KPI Dashboard Download PDF. The topics addressed in these templates are Robotic Process Automation, Metrics Performance Overview, Kpi Dashboard. All the content presented in this PPT design is completely editable. Download it and make adjustments in color, background, font etc. as per your unique business setting.
Robotic Process Automation Metrics Tracker With Work Item Statistics Information PDF
This slide covers the RPA dashboard for analysing process data status. It also includes process details such as run success rate, inputs, processing, fail, output, robotic run minutes, total value generated, work items processed. Pitch your topic with ease and precision using this Robotic Process Automation Metrics Tracker With Work Item Statistics Information PDF. This layout presents information on Robotic Process Automation, Metrics Tracker, Work Item Statistics. It is also available for immediate download and adjustment. So, changes can be made in the color, design, graphics or any other component to create a unique layout.

IT Operations Analysis With Tickets Management Dashboard Formats PDF
This slide represents the dashboard showing analysis report of tickets management by the IT support service team. It shows details related to no. of support requests, average hours spent to resolve issues, support status, total resolved and unresolved tickets by month etc.Showcasing this set of slides titled IT Operations Analysis With Tickets Management Dashboard Formats PDF. The topics addressed in these templates are Support Requests, Unresolved Ticket, Support Status. All the content presented in this PPT design is completely editable. Download it and make adjustments in color, background, font etc. as per your unique business setting.

Agile Sprint Management Report Dashboard Pictures PDF
This slide illustrates facts and figures related to sprint summary on agile project management. It includes total worked hours, story points, tasks, sprint velocity, scope charges, tasks by types, etc. Pitch your topic with ease and precision using this Agile Sprint Management Report Dashboard Pictures PDF. This layout presents information on Tasks By Status, Sprint Velocity, Scope Changes. It is also available for immediate download and adjustment. So, changes can be made in the color, design, graphics or any other component to create a unique layout.

Business Restructuring Process Dashboard To Determine Sales Profit And Conversions Inspiration PDF
This slide focuses on dashboard to determine sales profits and conversions that also includes revenues, profits, number of orders placed, total customers, procured items that will help company to measure the overall business performance. There are so many reasons you need a Business Restructuring Process Dashboard To Determine Sales Profit And Conversions Inspiration PDF. The first reason is you cant spend time making everything from scratch, Thus, Slidegeeks has made presentation templates for you too. You can easily download these templates from our website easily.
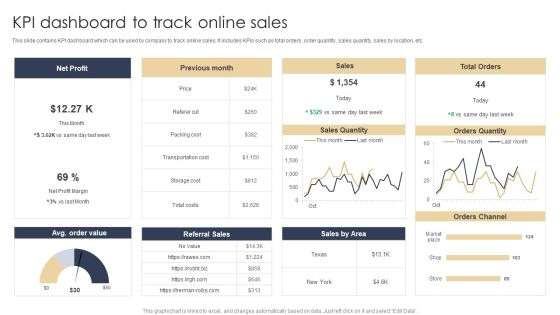
KPI Dashboard To Track Online Sales Structure PDF
This slide contains KPI dashboard which can be used by company to track online sales. It includes KPIs such as total orders, order quantity, sales quantity, sales by location, etc. Pitch your topic with ease and precision using this KPI Dashboard To Track Online Sales Structure PDF. This layout presents information on Net Profit, Sales, Orders Quantity. It is also available for immediate download and adjustment. So, changes can be made in the color, design, graphics or any other component to create a unique layout.

Customer Support Center Call Center Action Plan Dashboard Highlighting Agent Diagrams PDF
This slide showcases dashboard for call center action plan which includes total calls, average answer speed, abandon rate, average calls per minute with agent performance and overall customer satisfaction score. Want to ace your presentation in front of a live audience Our Customer Support Center Call Center Action Plan Dashboard Highlighting Agent Diagrams PDF can help you do that by engaging all the users towards you.. Slidegeeks experts have put their efforts and expertise into creating these impeccable powerpoint presentations so that you can communicate your ideas clearly. Moreover, all the templates are customizable, and easy-to-edit and downloadable. Use these for both personal and commercial use.

Tactical Brand Extension Launching Kpi Dashboard To Monitor Sales And Orders Formats PDF
Following slide displays sales and orders performance monitoring dashboard. Key performance indicators covered in the slide are return reasons, perfect order rate, total orders, top seller by orders. From laying roadmaps to briefing everything in detail, our templates are perfect for you. You can set the stage with your presentation slides. All you have to do is download these easy-to-edit and customizable templates. Tactical Brand Extension Launching Kpi Dashboard To Monitor Sales And Orders Formats PDF will help you deliver an outstanding performance that everyone would remember and praise you for. Do download this presentation today.

Retail Stock Performance Management Dashboard Designs PDF
This slide shows retail inventory performance management dashboard for giving detailed information of different types of retail garment products. It include metric such as purchase order details, total products sold and products returned etc. Showcasing this set of slides titled Retail Stock Performance Management Dashboard Designs PDF. The topics addressed in these templates are Retail Stock Performance, Management Dashboard. All the content presented in this PPT design is completely editable. Download it and make adjustments in color, background, font etc. as per your unique business setting.

Effective Online And Offline Promotional Global Food Industry Revenue Generation By Various Themes PDF
The following slide outlines the total industry revenue by multiple food categories such as bread and cereal, confectionery and snacks, meat and vegetables. It also provides information about the projected revenue of food categories from 2023-2025. Find a pre-designed and impeccable Effective Online And Offline Promotional Global Food Industry Revenue Generation By Various Themes PDF. The templates can ace your presentation without additional effort. You can download these easy-to-edit presentation templates to make your presentation stand out from others. So, what are you waiting for Download the template from Slidegeeks today and give a unique touch to your presentation.

B2b Selling Tactics Dashboard To Maintain Productivity Introduction PDF
The following slide represents B2B selling tactics dashboard which allows executives and managers to effectively control sales and monitor them in one central place. It consists of total sales, payments, trends etc.Pitch your topic with ease and precision using this B2b Selling Tactics Dashboard To Maintain Productivity Introduction PDF. This layout presents information on Operational Effects, Stores Sales Trend, Conversion Rate. It is also available for immediate download and adjustment. So, changes can be made in the color, design, graphics or any other component to create a unique layout.
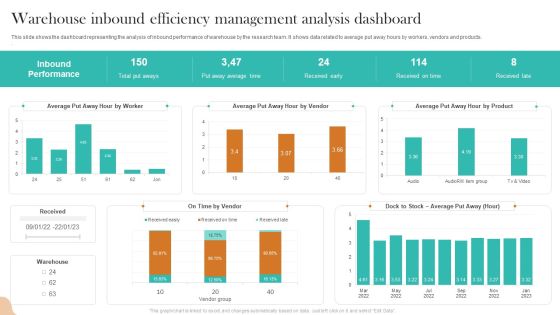
Warehouse Inbound Efficiency Management Analysis Dashboard Topics PDF
This slide shows the dashboard representing the analysis of inbound performance of warehouse by the research team. It shows data related to average put away hours by workers, vendors and products. Showcasing this set of slides titled Warehouse Inbound Efficiency Management Analysis Dashboard Topics PDF. The topics addressed in these templates are Inbound Performance, Total Put Aways, Received Early. All the content presented in this PPT design is completely editable. Download it and make adjustments in color, background, font etc. as per your unique business setting.
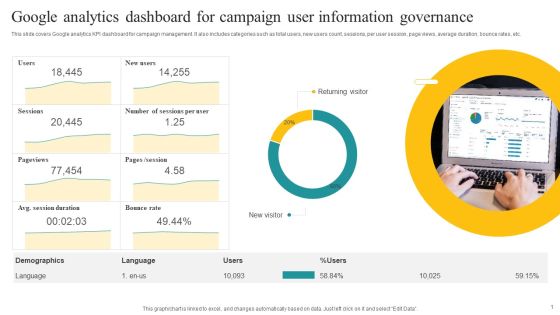
Google Analytics Dashboard For Campaign User Information Governance Demonstration PDF
This slide covers Google analytics KPI dashboard for campaign management. It also includes categories such as total users, new users count, sessions, per user session, page views, average duration, bounce rates, etc. Showcasing this set of slides titled Google Analytics Dashboard For Campaign User Information Governance Demonstration PDF. The topics addressed in these templates are Returning Visitor, New Visitor, Demographics. All the content presented in this PPT design is completely editable. Download it and make adjustments in color, background, font etc. as per your unique business setting.

Competitive Analysis Global Food Products Company Profile Sample PDF
This slide highlights the agriculture companies competitive analysis based on total experience, retail clients, fertilizers production, crops production, warehousing centers and revenueThe Competitive Analysis Global Food Products Company Profile Sample PDF is a compilation of the most recent design trends as a series of slides. It is suitable for any subject or industry presentation, containing attractive visuals and photo spots for businesses to clearly express their messages. This template contains a variety of slides for the user to input data, such as structures to contrast two elements, bullet points, and slides for written information. Slidegeeks is prepared to create an impression.

Major Statistics Standard Of ISO 9001 Survey Introduction PDF
The purpose of this slide is to highlight critical statistics of ISO 9001. Statistics covered in the slide are total ISO 9001 certificates issues worldwide, annual growth of certificates and the various countries where certificates are mostly issued. Showcasing this set of slides titled Major Statistics Standard Of ISO 9001 Survey Introduction PDF. The topics addressed in these templates are Certificates Worldwide, Annual Growth, Top Countries. All the content presented in this PPT design is completely editable. Download it and make adjustments in color, background, font etc. as per your unique business setting.

Financial Asset Management System Dashboard Showing Debt And Equity Ratio Graphics PDF
This slide shows the dashboard of financial asset management representing total accounts receivable and payable, equity and debt ratio, profit and loss summary, net working capital etc. Showcasing this set of slides titled Financial Asset Management System Dashboard Showing Debt And Equity Ratio Graphics PDF. The topics addressed in these templates are Financial Asset, Management System, Debt And Equity Ratio. All the content presented in this PPT design is completely editable. Download it and make adjustments in color, background, font etc. as per your unique business setting.
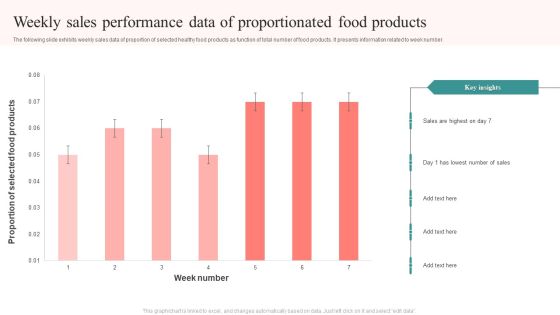
Weekly Sales Performance Data Of Proportionated Food Products Structure PDF
The following slide exhibits weekly sales data of proportion of selected healthy food products as function of total number of food products. It presents information related to week number. Showcasing this set of slides titled Weekly Sales Performance Data Of Proportionated Food Products Structure PDF. The topics addressed in these templates are Proportion Selected, Food Products, Week Number, Sales Highest. All the content presented in this PPT design is completely editable. Download it and make adjustments in color, background, font etc. as per your unique business setting.
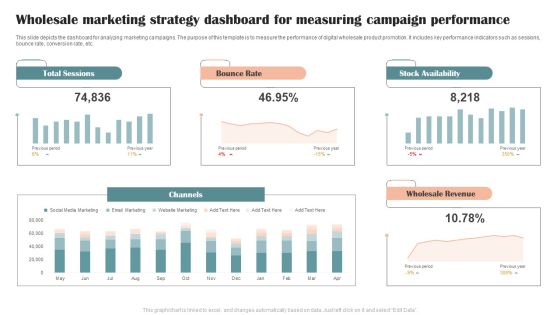
Wholesale Marketing Strategy Dashboard For Measuring Campaign Performance Graphics PDF
This slide depicts the dashboard for analyzing marketing campaigns. The purpose of this template is to measure the performance of digital wholesale product promotion. It includes key performance indicators such as sessions, bounce rate, conversion rate, etc. Showcasing this set of slides titled Wholesale Marketing Strategy Dashboard For Measuring Campaign Performance Graphics PDF. The topics addressed in these templates are Total Sessions, Bounce Rate, Stock Availability. All the content presented in this PPT design is completely editable. Download it and make adjustments in color, background, font etc. as per your unique business setting.

Optimizing Marketing Analytics To Enhance Organizational Growth Social Media Analytics KPI Dashboard Graphics PDF
This slide covers a dashboard for tracking social media KPIs such as face engagements, total likes, followers, audience growth, YouTube subscribers, views, Instagram reach and , likes, LinkedIn impressions, etc. From laying roadmaps to briefing everything in detail, our templates are perfect for you. You can set the stage with your presentation slides. All you have to do is download these easy to edit and customizable templates. Optimizing Marketing Analytics To Enhance Organizational Growth Social Media Analytics KPI Dashboard Graphics PDF will help you deliver an outstanding performance that everyone would remember and praise you for. Do download this presentation today.
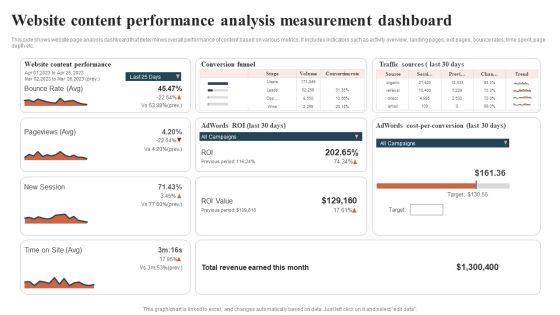
Website Content Performance Analysis Measurement Dashboard Guidelines PDF
This side shows website page analysis dashboard that determines overall performance of content based on various metrics. It includes indicators such as activity overview, landing pages, exit pages, bounce rates, time spent, page depth etc. Showcasing this set of slides titled Website Content Performance Analysis Measurement Dashboard Guidelines PDF. The topics addressed in these templates are Conversion Funnel, Traffic Sources, Total Revenue. All the content presented in this PPT design is completely editable. Download it and make adjustments in color, background, font etc. as per your unique business setting.

B2b Ecommerce Dashboard To Track Website Performance Comprehensive Guide For Developing Sample PDF
This slide represents metric dashboard to track and analyze b2b ecommerce website performance. It covers total user visits, sales, average return per user etc.Find a pre-designed and impeccable B2b Ecommerce Dashboard To Track Website Performance Comprehensive Guide For Developing Sample PDF. The templates can ace your presentation without additional effort. You can download these easy-to-edit presentation templates to make your presentation stand out from others. So, what are you waiting for Download the template from Slidegeeks today and give a unique touch to your presentation.
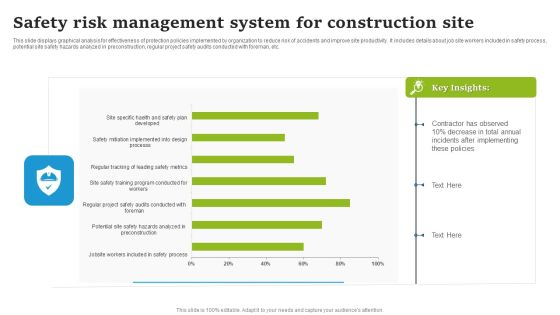
Safety Risk Management System For Construction Site Elements PDF
This slide displays graphical analysis for effectiveness of protection policies implemented by organization to reduce risk of accidents and improve site productivity. It includes details about job site workers included in safety process, potential site safety hazards analyzed in preconstruction, regular project safety audits conducted with foreman, etc. Showcasing this set of slides titled Safety Risk Management System For Construction Site Elements PDF. The topics addressed in these templates are Contractor Has Observed, Total Annual, Incidents After Implementing. All the content presented in this PPT design is completely editable. Download it and make adjustments in color, background, font etc. as per your unique business setting.
