Total Cost
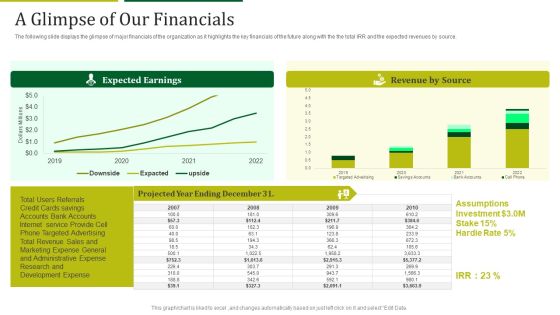
Mint Investor Capital Raising A Glimpse Of Our Financials Ppt Summary Objects PDF
The following slide displays the glimpse of major financials of the organization as it highlights the key financials of the future along with the the total IRR and the expected revenues by source. Deliver an awe inspiring pitch with this creative mint investor capital raising a glimpse of our financials ppt summary objects pdf bundle. Topics like expected earnings, revenue by source, credit cards savings can be discussed with this completely editable template. It is available for immediate download depending on the needs and requirements of the user.

Data Mining Implementation Why Is Data Mining Needed In The Organization Graphics PDF
This slide defines the need of the data science in the organization, the amount of the total data, structured data, and unstructured data, which is not possible to manage by BI tool anymore.Deliver and pitch your topic in the best possible manner with this data mining implementation why is data mining needed in the organization graphics pdf Use them to share invaluable insights on organizational data, unstructured data, data was easily managed and impress your audience. This template can be altered and modified as per your expectations. So, grab it now.
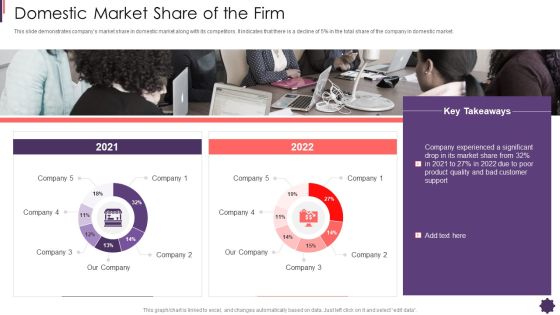
Domestic Market Share Of The Firm Brand Techniques Structure Mockup PDF
This slide demonstrates companys market share in domestic market along with its competitors. It indicates that there is a decline of 5 percentage in the total share of the company in domestic market. Deliver an awe inspiring pitch with this creative domestic market share of the firm brand techniques structure mockup pdf bundle. Topics like domestic market share of the firm can be discussed with this completely editable template. It is available for immediate download depending on the needs and requirements of the user.

Dashboard Of Project Risk Evaluation With Risk Rating Pictures PDF
The slide highlights the dashboard of project risk assessment with risk rating illustrating total risks, open risk, improving, closed risk, mitigated risk, residual risk, risk rating, inherent risk, control risk and impact probability matrixPitch your topic with ease and precision using this dashboard of project risk evaluation with risk rating pictures pdf This layout presents information on dashboard of project risk evaluation with risk rating It is also available for immediate download and adjustment. So, changes can be made in the color, design, graphics or any other component to create a unique layout.

Incident Management Dashboard With Workplace Injury Rate Clipart PDF
This slide visually shows the incident trends at workplace in terms of accident frequency and severity rate. It also provides information regarding total number, categorization and types of incidents. Showcasing this set of slides titled incident management dashboard with workplace injury rate clipart pdf. The topics addressed in these templates are incident management dashboard with workplace injury rate. All the content presented in this PPT design is completely editable. Download it and make adjustments in color, background, font etc. as per your unique business setting.

Analyzing The Impact Of Russia Ukraine Conflict On Agriculture Sector Ukraines Share Of Global Wheat Graphics PDF
This slide covers graphical representation of Ukraines wheat exports by country. It also includes key insights such as total produce and global export, supply countries like Egypt, Indonesia, Bangladesh, turkey, Yemen, Philippines, Morocco, etc.Deliver an awe inspiring pitch with this creative analyzing the impact of russia ukraine conflict on agriculture sector ukraines share of global wheat graphics pdf bundle. Topics like ukraines share of global wheat exports by destination can be discussed with this completely editable template. It is available for immediate download depending on the needs and requirements of the user.

PMI Agile Certification Program IT Figures Showcasing Details About PMI Credential Holders Clipart PDF
Mentioned slide displays information on the total PMI credential holders over past 12 months. Here the graph indicates that professionals opted for PMP certification in 2019 and surpassed the mark of 1,000,000 active certificate holders.Deliver an awe inspiring pitch with this creative pmi agile certification program it figures showcasing details about pmi credential holders clipart pdf bundle. Topics like figures showcasing details about pmi credential holders in past 12 months can be discussed with this completely editable template. It is available for immediate download depending on the needs and requirements of the user.
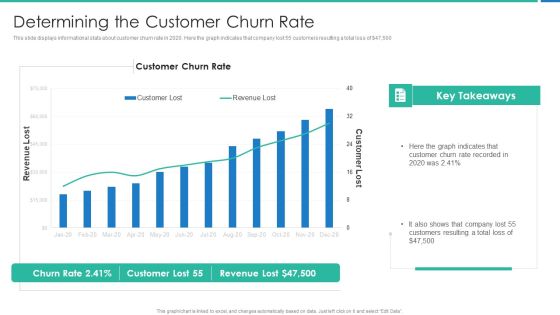
Strong Business Partnership To Ensure Company Success Determining The Customer Churn Rate Elements PDF
This slide displays informational stats about customer churn rate in 2020. Here the graph indicates that company lost 55 customers resulting a total loss of dollar 47,500 Deliver and pitch your topic in the best possible manner with this strong business partnership to ensure company success determining the customer churn rate elements pdf Use them to share invaluable insights on determining the customer churn rate and impress your audience. This template can be altered and modified as per your expectations. So, grab it now.
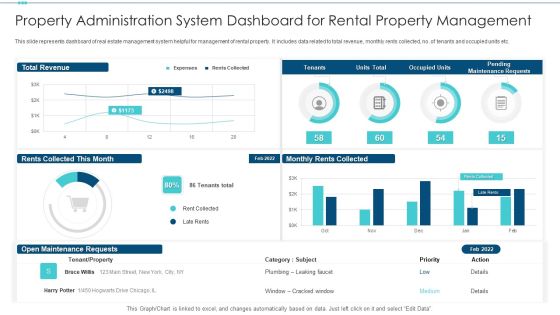
Property Administration System Dashboard For Rental Property Management Inspiration PDF
This slide represents dashboard of real estate management system helpful for management of rental property. It includes data related to total revenue, monthly rents collected, no .of tenants and occupied units etc. Showcasing this set of slides titled property administration system dashboard for rental property management inspiration pdf. The topics addressed in these templates are property administration system dashboard for rental property management. All the content presented in this PPT design is completely editable. Download it and make adjustments in color, background, font etc. as per your unique business setting.
Tracking Essential Retail Store Activities Dashboard Incorporation Of Experience Information PDF
This slide provides details regarding the dashboard for tracking retail store activities in terms of customer retention, rate of return, volume sales, etc. Deliver and pitch your topic in the best possible manner with this tracking essential retail store activities dashboard incorporation of experience information pdf. Use them to share invaluable insights on total volume sales, rate of return, customer retention, number of new and returning customers and impress your audience. This template can be altered and modified as per your expectations. So, grab it now.
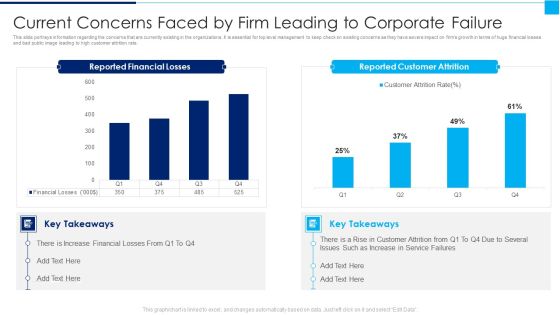
Ways To Enhance Organizations Profitability Current Concerns Faced By Firm Leading To Corporate Failure Infographics PDF
This slide portrays information regarding the concerns that are currently existing in the organizations. It is essential for top level management to keep check on existing concerns as they have severe impact on firms growth in terms of huge financial losses and bad public image leading to high customer attrition rate. Deliver an awe inspiring pitch with this creative ways to enhance organizations profitability current concerns faced by firm leading to corporate failure infographics pdf bundle. Topics like total employees, employees that require training, training skill set can be discussed with this completely editable template. It is available for immediate download depending on the needs and requirements of the user.

Electronic Playbook How Digital Transformation Can Change Your Organization Mockup PDF
Purpose of the following slide is to show, how digital transformation can change organization as it provides key stats related to the same. It displays adoption rate of digital transformation, total number of companies who have experienced increase in revenues etc. Deliver and pitch your topic in the best possible manner with this electronic playbook how digital transformation can change your organization mockup pdf Use them to share invaluable insights on various organizations, companies have experienced, adoption rate of digital and impress your audience. This template can be altered and modified as per your expectations. So, grab it now.

Russia Ukraine How Much Ukraine Government Received Crypto Donations To Fight Invasion Mockup PDF
The purpose of this slide is to outline the total crypto donation received by the Ukraine government in the month of Feb and Mar. It provides information about Bitcoin, Stable coins, Ether, and other cryptocurrency. Deliver and pitch your topic in the best possible manner with this russia ukraine how much ukraine government received crypto donations to fight invasion mockup pdf. Use them to share invaluable insights on bitcoin, stablecoins, ether and impress your audience. This template can be altered and modified as per your expectations. So, grab it now.

Providing Electronic Financial Services To Existing Consumers Mobile Subscribers Projection Demonstration PDF
Mentioned slide shows informational stats about mobile subscribers and tele density growth for five years. The graph depicts that Total mobile subscription for MFS will get increased by 84 percentage in 2026. Deliver an awe inspiring pitch with this creative Providing Electronic Financial Services To Existing Consumers Mobile Subscribers Projection Demonstration PDF bundle. Topics like Mobile Subscribers Projection And Tele Density Growth can be discussed with this completely editable template. It is available for immediate download depending on the needs and requirements of the user.

Introducing A New Product To The Market Domestic Market Share Of The Firm Download PDF
This slide demonstrates companys market share in domestic market along with its competitors. It indicates that there is a decline of 5persent in the total share of the company in domestic market.Deliver an awe inspiring pitch with this creative Introducing A New Product To The Market Domestic Market Share Of The Firm Download PDF bundle. Topics like Domestic Market Share Of The Firm can be discussed with this completely editable template. It is available for immediate download depending on the needs and requirements of the user.
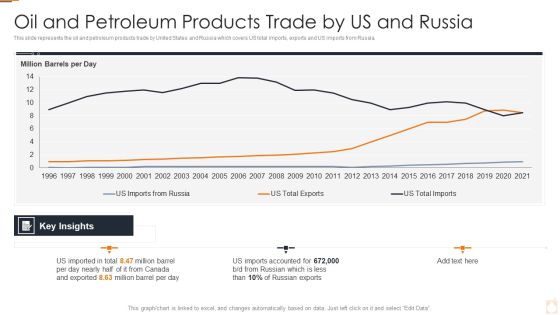
Ukraine Russia Conflict Effect On Petroleum Industry Oil And Petroleum Products Trade Formats PDF
This slide represents the oil and petroleum products trade by United States and Russia which covers US total imports, exports and US imports from Russia.Deliver and pitch your topic in the best possible manner with this Ukraine Russia Conflict Effect On Petroleum Industry Oil And Petroleum Products Trade Formats PDF Use them to share invaluable insights on Oil And Petroleum Products Trade By US And Russia and impress your audience. This template can be altered and modified as per your expectations. So, grab it now.
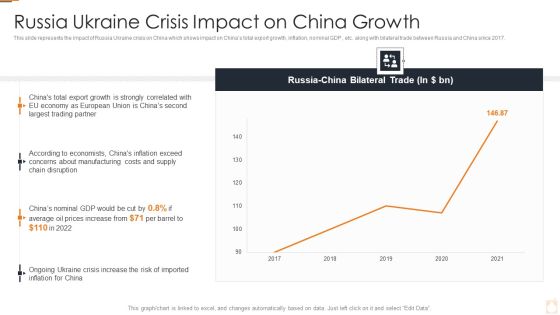
Ukraine Russia Conflict Effect On Petroleum Industry Russia Ukraine Crisis Impact Background PDF
This slide represents the impact of Russia Ukraine crisis on China which shows impact on Chinas total export growth, inflation, nominal GDP , etc. along with bilateral trade between Russia and China since 2017.Deliver an awe inspiring pitch with this creative Ukraine Russia Conflict Effect On Petroleum Industry Russia Ukraine Crisis Impact Background PDF bundle. Topics like Russia Ukraine Crisis Impact On China Growth can be discussed with this completely editable template. It is available for immediate download depending on the needs and requirements of the user.
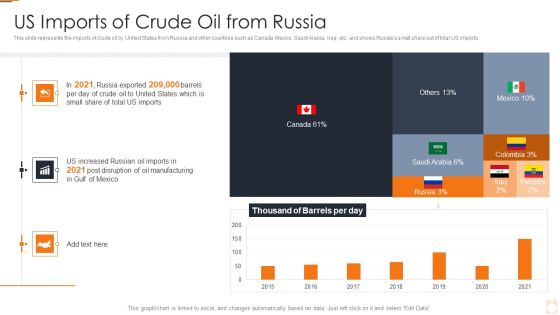
Ukraine Russia Conflict Effect On Petroleum Industry US Imports Of Crude Oil From Russia Designs PDF
This slide represents the imports of crude oil by United States from Russia and other countries such as Canada, Mexico, Saudi Arabia, Iraq, etc. and shows Russias small share out of total US imports.Deliver and pitch your topic in the best possible manner with this Ukraine Russia Conflict Effect On Petroleum Industry US Imports Of Crude Oil From Russia Designs PDF. Use them to share invaluable insights on Us Imports Of Crude Oil From Russia and impress your audience. This template can be altered and modified as per your expectations. So, grab it now.

Revenue Performance And Risk Metrics Dashboard Demonstration PDF
This slide illustrates graphical representation of risk key performance indicators. It includes revenue performance of business units with their risk expenditure and people KRIs like employee job satisfaction, customer satisfaction etc. Showcasing this set of slides titled Revenue Performance And Risk Metrics Dashboard Demonstration PDF. The topics addressed in these templates are Total Risk Expenditure, Risk Management, Revenue Performance . All the content presented in this PPT design is completely editable. Download it and make adjustments in color, background, font etc. as per your unique business setting.

Marketing Kpi Dashboard Showing Campaign Outcomes Pictures PDF
The purpose of this slide is to outline KPI dashboard of various results generated from marketing campaign. The results highlighted in the slide are total visits, average session duration, bounce rate, traffic sources, top channels by conversion etc. Pitch your topic with ease and precision using this Marketing Kpi Dashboard Showing Campaign Outcomes Pictures PDF. This layout presents information on Marketing Kpi Dashboard Showing Campaign Outcomes. It is also available for immediate download and adjustment. So, changes can be made in the color, design, graphics or any other component to create a unique layout.
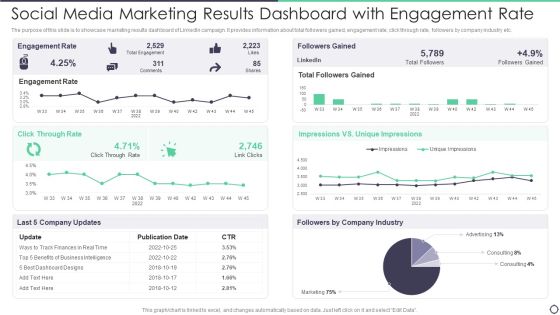
Social Media Marketing Results Dashboard With Engagement Rate Brochure PDF
The purpose of this slide is to showcase marketing results dashboard of LinkedIn campaign. It provides information about total followers gained, engagement rate, click through rate, followers by company industry etc. Pitch your topic with ease and precision using this Social Media Marketing Results Dashboard With Engagement Rate Brochure PDF. This layout presents information on Social Media Marketing Results Dashboard With Engagement Rate. It is also available for immediate download and adjustment. So, changes can be made in the color, design, graphics or any other component to create a unique layout.

Deploying Quality Assurance QA Transformation QA Transformation Dashboard With Test Download PDF
This slide shows the QA transformation dashboard with test cases and other variables such as total test cases passed, test cases failed, test cases in progress, project name, project stage, test type, test status etc. Deliver and pitch your topic in the best possible manner with this Deploying Quality Assurance QA Transformation QA Transformation Dashboard With Test Download PDF Use them to share invaluable insights on Qa Transformation Dashboard With Test Cases And Other Variablesc and impress your audience. This template can be altered and modified as per your expectations. So, grab it now.
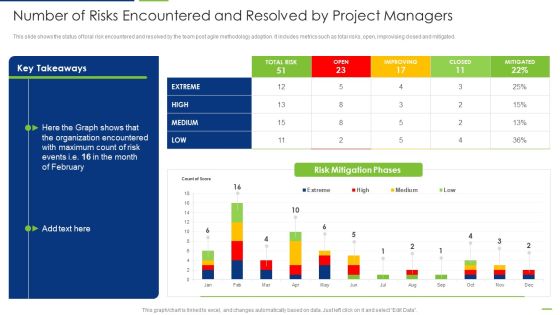
Professional Scrum Master Number Of Risks Encountered And Resolved By Project Managers Infographics PDF
This slide shows the status of toral risk encountered and resolved by the team post agile methodology adoption. It includes metrics such as total risks, open, improvising closed and mitigated. Deliver an awe inspiring pitch with this creative Professional Scrum Master Number Of Risks Encountered And Resolved By Project Managers Infographics PDF bundle. Topics like Risk Mitigation Phases, Organization Encountered, High, Low, Medium can be discussed with this completely editable template. It is available for immediate download depending on the needs and requirements of the user.

Analytics Dashboard To Evaluate Digital Marketing Performance Mockup PDF
The purpose of this slide is to exhibits a dashboard which can be used to examine the marketing performance. The metrics covered in the dashboard are bounce rate, page views, new sessions, total time spent on site, email marketing performance etc. Showcasing this set of slides titled Analytics Dashboard To Evaluate Digital Marketing Performance Mockup PDF. The topics addressed in these templates are Conversion Funnel, Target, Marketing Performance. All the content presented in this PPT design is completely editable. Download it and make adjustments in color, background, font etc. as per your unique business setting.

B2b Marketing Analytics Dashboard With Engagement Rate Microsoft PDF
The purpose of this slide is to display analytics dashboard which can be used by company to highlight marketing campaign performance. Information covered in this template is related to shares and likes by social media platforms, total engagement rate etc. Showcasing this set of slides titled B2b Marketing Analytics Dashboard With Engagement Rate Microsoft PDF. The topics addressed in these templates are B2b Marketing Analytics Dashboard With Engagement Rate. All the content presented in this PPT design is completely editable. Download it and make adjustments in color, background, font etc. as per your unique business setting.

Agile Certified Professional Figures Showcasing Details About PMI Credential Holders Professional PDF
Mentioned slide displays information on the total PMI credential holders over past 12 months. Here the graph indicates that professionals opted for PMP certification in 2021 and surpassed the mark of 1,000,000 active certificate holders. Deliver an awe inspiring pitch with this creative Agile Certified Professional Figures Showcasing Details About PMI Credential Holders Professional PDF bundle. Topics like Certificate Holders, PMP Certification can be discussed with this completely editable template. It is available for immediate download depending on the needs and requirements of the user.
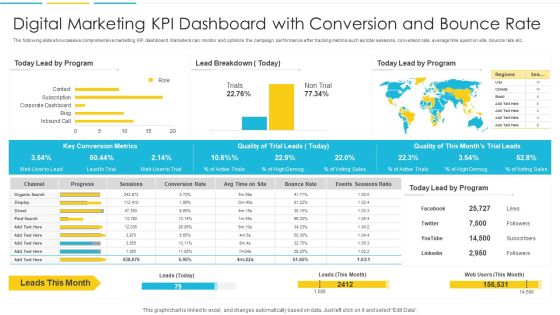
Digital Marketing KPI Dashboard With Conversion And Bounce Rate Introduction PDF
The following slide showcases a comprehensive marketing KPI dashboard. Marketers can monitor and optimize the campaign performance after tracking metrics such as total sessions, conversion rate, average time spent on site, bounce rate etc. Pitch your topic with ease and precision using this Digital Marketing KPI Dashboard With Conversion And Bounce Rate Introduction PDF. This layout presents information on Organic, Progress, Conversion Rate. It is also available for immediate download and adjustment. So, changes can be made in the color, design, graphics or any other component to create a unique layout

Digital Marketing KPI Dashboard With Goal Conversion Rate Ideas PDF
The following slide showcases a marketing KPI dashboard. The various metrics highlighted in the slide are total sessions, bounce rate, goal completions, goal conversion rate, top channels which generated revenue. Pitch your topic with ease and precision using this Digital Marketing KPI Dashboard With Goal Conversion Rate Ideas PDF. This layout presents information on Rate, Goal, Conversions. It is also available for immediate download and adjustment. So, changes can be made in the color, design, graphics or any other component to create a unique layout.

Email Marketing KPI Dashboard With Bounce Rate Demonstration PDF
The following slide showcases KPI dashboard which allows marketers to track the email marketing campaign performance. Information covered in this slide is related to total subscribers, types of email sent, open, clicks, bounces and unsubscribed etc. Showcasing this set of slides titled Email Marketing KPI Dashboard With Bounce Rate Demonstration PDF. The topics addressed in these templates are Organic, Paid, Information. All the content presented in this PPT design is completely editable. Download it and make adjustments in color, background, font etc. as per your unique business setting
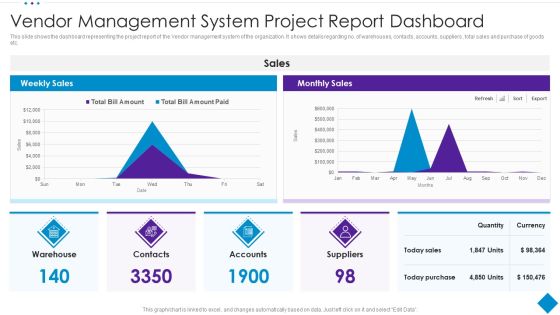
Vendor Management System Project Report Dashboard Template PDF
This slide shows the dashboard representing the project report of the Vendor management system of the organization. It shows details regarding no. of warehouses, contacts, accounts, suppliers , total sales and purchase of goods etc. Showcasing this set of slides titled Vendor Management System Project Report Dashboard Template PDF. The topics addressed in these templates are Purchase, Sales, Suppliers. All the content presented in this PPT design is completely editable. Download it and make adjustments in color, background, font etc. as per your unique business setting.

Team Mentoring Dashboard With Client And Training Details Sample PDF
This slide covers all the information related to the clients to whom coaching has been provided and in certain number of hours how many sessions they attended. It also includes the total earnings , coaching hours and the name of top clients.Pitch your topic with ease and precision using this Team Mentoring Dashboard With Client And Training Details Sample PDF This layout presents information on Team Mentoring Dashboard With Client And Training Details It is also available for immediate download and adjustment. So, changes can be made in the color, design, graphics or any other component to create a unique layout.

Transportation And Logistics Services Company Profile Orders Distribution By Services Category Topics PDF
The slide depicts the total orders distribution by services category illustrating percentage orders placed for each service including general freight, rail freight, sea freight, air freight, refrigerated freight and special services. Deliver and pitch your topic in the best possible manner with this Transportation And Logistics Services Company Profile Orders Distribution By Services Category Topics PDF. Use them to share invaluable insights on Road Transport, Special Services, General Freight, Refrigerated Freight, Rail Freight and impress your audience. This template can be altered and modified as per your expectations. So, grab it now.

KPI Dashboard Highlighting Customer Recommendation Program Results Rules PDF
The following slide showcases a comprehensive dashboard which can be used to track customer referral program results. It provides information about total participants enrolled, invites, clicks, converts, tweets, facebook shares etc. Pitch your topic with ease and precision using this KPI Dashboard Highlighting Customer Recommendation Program Results Rules PDF. This layout presents information on Participants, Invites, Converts. It is also available for immediate download and adjustment. So, changes can be made in the color, design, graphics or any other component to create a unique layout.

Corporate Loan Performance Analysis Dashboard Slides PDF
This slide displays the dashboard for corporate loan performance management. It include KPIs such as total loans vs approved, loan default count trend, loan default by branch, loan approval amount by product, etc. Showcasing this set of slides titled Corporate Loan Performance Analysis Dashboard Slides PDF. The topics addressed in these templates are Loan Default Count Trend, Loan Approval Count By Branch, Loan Approval Amount By Product. All the content presented in this PPT design is completely editable. Download it and make adjustments in color, background, font etc. as per your unique business setting.
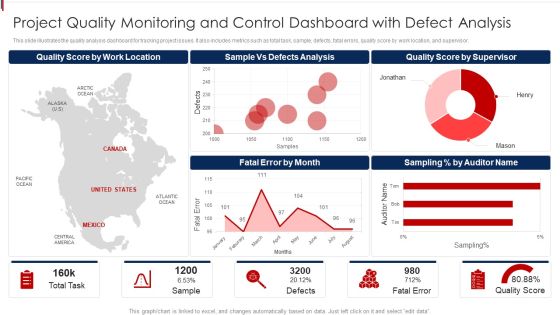
Project Quality Monitoring And Control Dashboard With Defect Analysis Demonstration PDF
This slide illustrates the quality analysis dashboard for tracking project issues. It also includes metrics such as total task, sample, defects, fatal errors, quality score by work location, and supervisor. Pitch your topic with ease and precision using this Project Quality Monitoring And Control Dashboard With Defect Analysis Demonstration PDF. This layout presents information on Location, Analysis, Supervisor. It is also available for immediate download and adjustment. So, changes can be made in the color, design, graphics or any other component to create a unique layout.

Health And Safety Performance Measurements Dashboard For Manufacturing Company Guidelines PDF
This slide covers the information related to the incidents that has happened during a year on a monthly basis due to not following safety measures. It also includes total number of incidents in a company, near incidents reported , etc. Showcasing this set of slides titled Health And Safety Performance Measurements Dashboard For Manufacturing Company Guidelines PDF The topics addressed in these templates are Incident Ackumulated , Incidents After Safety, Incidence Avoidance All the content presented in this PPT design is completely editable. Download it and make adjustments in color, background, font etc. as per your unique business setting.

Health And Safety Performance Measurements Dashboard With Employee Stats Template PDF
This slide comprises of many types of activities that have taken place in an organization in terms of the safety and it also shows how the employees performance are going on in terms of safety . It includes training hours, total man-hour , severity of the accidents , etc.Pitch your topic with ease and precision using this Health And Safety Performance Measurements Dashboard With Employee Stats Template PDF This layout presents information on Safety Observation, Injuries Frequency, Unsafe Conditions It is also available for immediate download and adjustment. So, changes can be made in the color, design, graphics or any other component to create a unique layout.
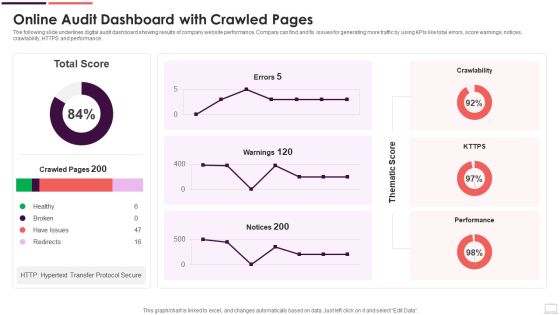
Online Audit Dashboard With Crawled Pages Background PDF
The following slide underlines digital audit dashboard showing results of company website performance. Company can find and fix issues for generating more traffic by using KPIs like total errors, score warnings, notices, crawlability, HTTPS and performance. Showcasing this set of slides titled Online Audit Dashboard With Crawled Pages Background PDF. The topics addressed in these templates are Redirects, Have Issues, Healthy. All the content presented in this PPT design is completely editable. Download it and make adjustments in color, background, font etc. as per your unique business setting.
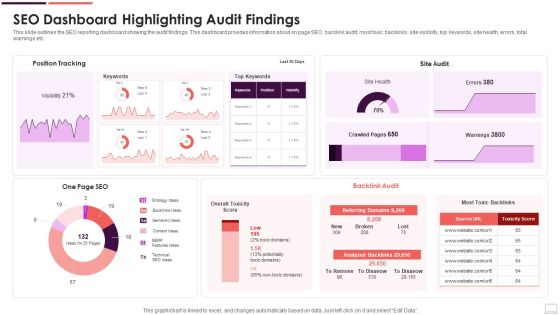
SEO Dashboard Highlighting Audit Findings Mockup PDF
This slide outlines the SEO reporting dashboard showing the audit findings. This dashboard provides information about on page SEO, backlink audit, most toxic backlinks, site visibility, top keywords, site health, errors, total warnings etc. Pitch your topic with ease and precision using this SEO Dashboard Highlighting Audit Findings Mockup PDF. This layout presents information on Strategy Ideas, Backlinks Ideas, Semantic Ideas. It is also available for immediate download and adjustment. So, changes can be made in the color, design, graphics or any other component to create a unique layout.
Internet Marketing Playbook Dashboard For Tracking Lead Generation From Marketing Efforts Portrait PDF
Following slide displays KPI dashboard that company is currently using for measuring lead generation through marketing. It also provides information about the traffic generation through different sources. Deliver and pitch your topic in the best possible manner with this Internet Marketing Playbook Dashboard For Tracking Lead Generation From Marketing Efforts Portrait PDF. Use them to share invaluable insights on Traffic Per Source, Leader Per Source, Total Leader Year and impress your audience. This template can be altered and modified as per your expectations. So, grab it now.

Canned Food Company Profile Operating Profit And Margin Background PDF
This slide illustrates a graph of operating profit in USdollar and gross margin in percentage for food company. Additionally, it shows operating profit of all business lines of the company food, beverage and dairy products Deliver an awe inspiring pitch with this creative Canned Food Company Profile Operating Profit And Margin Background PDF bundle. Topics like Dairy Operating, Beverage Operating , Total Operating can be discussed with this completely editable template. It is available for immediate download depending on the needs and requirements of the user.

Maintenance KPI Dashboard Of Service Companies Ppt Outline Graphics Design PDF
This slide focuses on maintenance dashboard which includes total assets, evolution, relevant assets, reports status, alert faults, asset status with good, satisfied, unsatisfied, inaccurate , overdue, completed and in-progress. Pitch your topic with ease and precision using this Maintenance KPI Dashboard Of Service Companies Ppt Outline Graphics Design PDF. This layout presents information on Assent Status Current, Reports Status 2023, Asset Status Evolution. It is also available for immediate download and adjustment. So, changes can be made in the color, design, graphics or any other component to create a unique layout.

Solid Waste Management Process KPI Dashboard Pictures PDF
Following slide highlights KPI dashboard for solid waste management which shows metrics like total material recycled by various categories, CO2 emissions by year, savings returned etc. Management can track such metrics to ensure waste management program is on track or not.Showcasing this set of slides titled Solid Waste Management Process KPI Dashboard Pictures PDF The topics addressed in these templates are Recycled Category, Sent Recycling, Tones Recycle All the content presented in this PPT design is completely editable. Download it and make adjustments in color, background, font etc. as per your unique business setting.
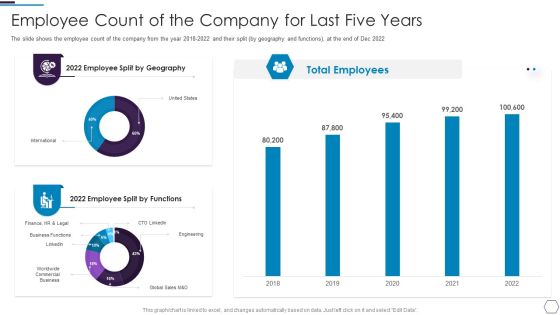
Information Technology Firm Report Example Employee Count Of The Company For Last Five Years Topics PDF
The slide shows the employee count of the company from the year 2018 to 2022 and their split by geography and functions, at the end of Dec 2022 Deliver an awe inspiring pitch with this creative Information Technology Firm Report Example Employee Count Of The Company For Last Five Years Topics PDF bundle. Topics like Employee Geography, Total Employees, Employee Functions can be discussed with this completely editable template. It is available for immediate download depending on the needs and requirements of the user.

Risk Based Procedures To IT Security KPI Dashboard To Track Security Risk Events Designs PDF
This slide displays KPI dashboard that company will use to track multiple risk events. Metrics covered in the dashboard are residual risks by period and risk category by total risk rating. Deliver and pitch your topic in the best possible manner with this Risk Based Procedures To IT Security KPI Dashboard To Track Security Risk Events Designs PDF. Use them to share invaluable insights on Governance Risk, People Risk, Financial Risk and impress your audience. This template can be altered and modified as per your expectations. So, grab it now.
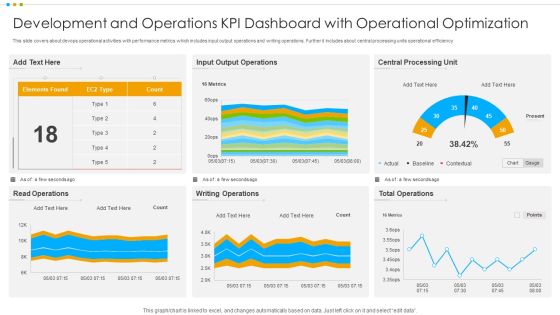
Development And Operations KPI Dashboard With Operational Optimization Pictures PDF
This slide covers about devops operational activities with performance metrics which includes input output operations and writing operations. Further it includes about central processing units operational efficiency.Pitch your topic with ease and precision using this Development And Operations KPI Dashboard With Operational Optimization Pictures PDF This layout presents information on Output Operations, Central Processing, Total Operations It is also available for immediate download and adjustment. So, changes can be made in the color, design, graphics or any other component to create a unique layout.
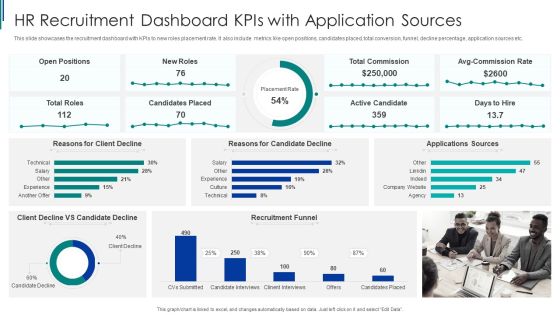
HR Recruitment Dashboard Kpis With Application Sources Ppt Pictures Styles PDF
This slide showcases the recruitment dashboard with KPIs to new roles placement rate. It also include metrics like open positions, candidates placed, total conversion, funnel, decline percentage, application sources etc. Pitch your topic with ease and precision using this HR Recruitment Dashboard Kpis With Application Sources Ppt Pictures Styles PDF. This layout presents information on Recruitment Funnel, HR Recruitment, Dashboard Kpis. It is also available for immediate download and adjustment. So, changes can be made in the color, design, graphics or any other component to create a unique layout.

New Product Sales Strategy And Marketing Dashboard To Track Sales Opportunities Rules PDF
Mentioned slide shows dashboard that can be used by an organization to track win and lost sales opportunities. It includes metrics namely won opportunities, lost opportunities, pipeline by territory, total opportunities. Deliver and pitch your topic in the best possible manner with this New Product Sales Strategy And Marketing Dashboard To Track Sales Opportunities Rules PDF. Use them to share invaluable insights on Won Opportunities, Lost Opportunities, Revenue and impress your audience. This template can be altered and modified as per your expectations. So, grab it now.

Business Overview Of A Technology Firm Employee Count Of The Company For Last Five Years Rules PDF
The slide shows the employee count of the company from the year 2017-2021 and their split by geography and functions, at the end of Dec 2022. Deliver and pitch your topic in the best possible manner with this Business Overview Of A Technology Firm Employee Count Of The Company For Last Five Years Rules PDF. Use them to share invaluable insights on Split By Geography, Total Employees, Employee Count and impress your audience. This template can be altered and modified as per your expectations. So, grab it now.

Steps Of Employee Hiring Process For HR Management Dashboard To Track Recruitment Process Activities Guidelines PDF
This slide focuses on dashboard to track recruitment process activities such as monthly hires, total hirings by department and source, average time to recruit, candidate feedback, offer acceptance rate, etc.Deliver and pitch your topic in the best possible manner with this Steps Of Employee Hiring Process For HR Management Dashboard To Track Recruitment Process Activities Guidelines PDF Use them to share invaluable insights on Interview Activity, Offer Acceptance, Candidate and impress your audience. This template can be altered and modified as per your expectations. So, grab it now.
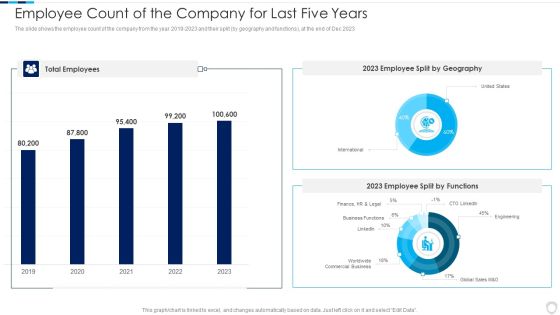
Financial Report Of An IT Firm Employee Count Of The Company For Last Five Years Topics PDF
The slide shows the employee count of the company from the year 2019 to 2023 and their split by geography and functions, at the end of Dec 2023.Deliver an awe inspiring pitch with this creative Financial Report Of An IT Firm Employee Count Of The Company For Last Five Years Topics PDF bundle. Topics like Total Employees, Split Geography, Split Functions can be discussed with this completely editable template. It is available for immediate download depending on the needs and requirements of the user.
IT Security Risk Management Approach Introduction Kpi Dashboard To Track Security Risk Events Icons PDF
This slide displays KPI dashboard that company will use to track multiple risk events. Metrics covered in the dashboard are residual risks by period and risk category by total risk rating. Deliver and pitch your topic in the best possible manner with this IT Security Risk Management Approach Introduction Kpi Dashboard To Track Security Risk Events Icons PDF. Use them to share invaluable insights on System Technology Risk, Governance Risk, Security Risk Events and impress your audience. This template can be altered and modified as per your expectations. So, grab it now.

Yearly Product Performance Assessment Repor Analyzing The Our Competitors Portrait PDF
The following slide displays the competitive analysis of the market as it highlights the various competitors of the market and sales figures, the provided also displays market share of the market of multiple competitors.Deliver and pitch your topic in the best possible manner with this Yearly Product Performance Assessment Repor Analyzing The Our Competitors Portrait PDF Use them to share invaluable insights on Total Addressable, Serviceable Addressable, Obtainable Market and impress your audience. This template can be altered and modified as per your expectations. So, grab it now.
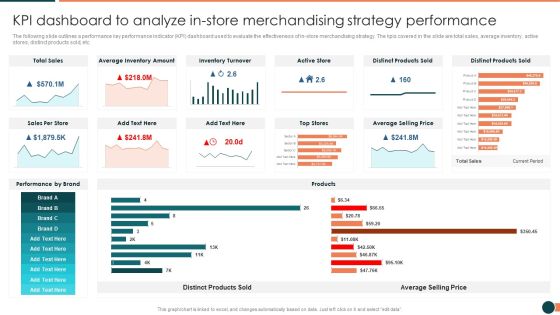
Developing Retail Marketing Strategies To Increase Revenue KPI Dashboard To Analyze Instore Information PDF
The following slide outlines a performance key performance indicator KPI dashboard used to evaluate the effectiveness of in store merchandising strategy. The kpis covered in the slide are total sales, average inventory, active stores, distinct products sold, etc.Deliver an awe inspiring pitch with this creative Developing Retail Marketing Strategies To Increase Revenue KPI Dashboard To Analyze Instore Information PDF bundle. Topics like Inventory Turnover, Distinct Products, Average Inventory can be discussed with this completely editable template. It is available for immediate download depending on the needs and requirements of the user.
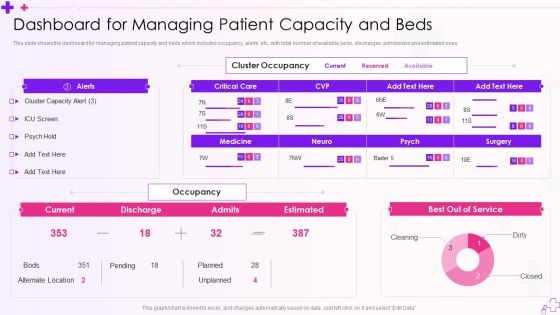
Integration Of Healthcare Center Administration System Dashboard For Managing Patient Capacity And Beds Template PDF
This slide shows the dashboard for managing patient capacity and beds which includes occupancy, alerts, etc, with total number of available beds, discharges, admissions and estimated ones.Deliver and pitch your topic in the best possible manner with this Integration Of Healthcare Center Administration System Dashboard For Managing Patient Capacity And Beds Template PDF Use them to share invaluable insights on Cluster Occupancy, Cluster Capacity, Alternate Location and impress your audience. This template can be altered and modified as per your expectations. So, grab it now.
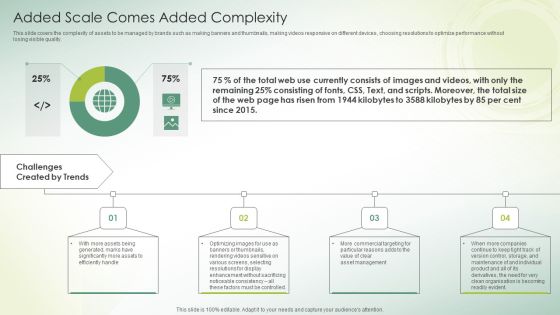
Organization DAM Services Added Scale Comes Added Complexity Ppt Show Topics PDF
This slide covers the complexity of assets to be managed by brands such as making banners and thumbnails, making videos responsive on different devices, choosing resolutions to optimize performance without losing visible quality. Deliver an awe inspiring pitch with this creative Organization DAM Services Added Scale Comes Added Complexity Ppt Show Topics PDF bundle. Topics like Challenges Created Trends, Total Web, Currently Consists can be discussed with this completely editable template. It is available for immediate download depending on the needs and requirements of the user.

Project Health Monitoring Dashboard For Quality Administration Plan Clipart PDF
This slide illustrates quality management dashboard that can help organization to plan and identify the defects and fatal errors of project. Its key elements are total tasks, sample, quality score, defect analysis, quality score and sampling percentage. Pitch your topic with ease and precision using this Project Health Monitoring Dashboard For Quality Administration Plan Clipart PDF. This layout presents information on Quality Score, Quality Administration Plan, Defects Analysis. It is also available for immediate download and adjustment. So, changes can be made in the color, design, graphics or any other component to create a unique layout.

Action Plan To Optimize Hiring Process Dashboard To Analyze Application Sources And Days To Hire Themes PDF
This slide showcases dashboard that can help organization to evaluate average days taken to hire a candidate and major sources of application. It also showcases various other components which are open positions, candidates place, avg commission rate, reasons for candidate and client decline.Deliver and pitch your topic in the best possible manner with this Action Plan To Optimize Hiring Process Dashboard To Analyze Application Sources And Days To Hire Themes PDF Use them to share invaluable insights on Open Positions, Recruitment Funnel, Total Commission and impress your audience. This template can be altered and modified as per your expectations. So, grab it now.

Insurance Analytics Corporation Clients Claims Dashboard Summary PDF
This slide illustrates clients claim status statistics of a insurance corporation. It includes total claims, monthly claims, claims amount by type, percentage of claims, denied and received claims line graph. Showcasing this set of slides titled Insurance Analytics Corporation Clients Claims Dashboard Summary PDF. The topics addressed in these templates are Insurance Analytics Corporation, Clients Claims Dashboard. All the content presented in this PPT design is completely editable. Download it and make adjustments in color, background, font etc. as per your unique business setting.

Insurance Analytics Corporation Sales Insights Dashboard Structure PDF
This slide illustrates facts and figures in relation to sales and overall policy status. It includes total policies and premiums in current and previous year, quarterly premium revenue and monthly policy status. Pitch your topic with ease and precision using this Insurance Analytics Corporation Sales Insights Dashboard Structure PDF. This layout presents information on Quarterly Premium Revenue, Sales Insights Dashboard, Insurance Analytics Corporation. It is also available for immediate download and adjustment. So, changes can be made in the color, design, graphics or any other component to create a unique layout.

 Home
Home