Total Cost
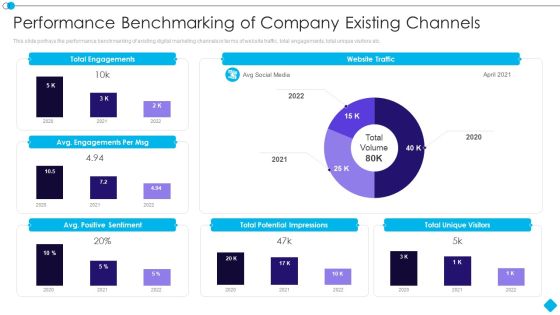
Linkedin Promotion Services Performance Benchmarking Of Company Existing Channels Clipart PDF
This slide portrays the performance benchmarking of existing digital marketing channels in terms of website traffic, total engagements, total unique visitors etc. Deliver an awe inspiring pitch with this creative linkedin promotion services performance benchmarking of company existing channels clipart pdf bundle. Topics like total engagements, avg engagements per msg, total potential impressions, total unique visitors, avg positive sentiment can be discussed with this completely editable template. It is available for immediate download depending on the needs and requirements of the user.

Linkedin Marketing For New Ventures Performance Benchmarking Of Company Slides PDF
This slide portrays the performance benchmarking of existing digital marketing channels in terms of website traffic, total engagements, total unique visitors etc.Deliver and pitch your topic in the best possible manner with this Linkedin Marketing For New Ventures Performance Benchmarking Of Company Slides PDF Use them to share invaluable insights on Total Engagements, Total Potential Impressions, Total Unique Visitors and impress your audience. This template can be altered and modified as per your expectations. So, grab it now.
Property Flipping Expenses And Profit Tracking Dashboard Ppt Good PDF
This slide covers dashboard to estimate multiple expenses incurred and profits earned by property flipping. It includes elements such repair costs, after repair value, rehab profits, purchase price, total amount of investment Made, etc. Showcasing this set of slides titled Property Flipping Expenses And Profit Tracking Dashboard Ppt Good PDF. The topics addressed in these templates are Repair Costs, Loan Amount, Down Payment. All the content presented in this PPT design is completely editable. Download it and make adjustments in color, background, font etc. as per your unique business setting.

Companys Performance Comparison Before And After Strategy Ppt PowerPoint Presentation File Ideas PDF
This slide shows the comparison of companys performance before and after the product marketing strategy implementation. It shows the comparison based on parameters such as number of product sold, total sale, lead conversion rate, customer retention rate, per customer acquisition cost etc. Boost your pitch with our creative Companys Performance Comparison Before And After Strategy Ppt PowerPoint Presentation File Ideas PDF. Deliver an awe inspiring pitch that will mesmerize everyone. Using these presentation templates you will surely catch everyones attention. You can browse the ppts collection on our website. We have researchers who are experts at creating the right content for the templates. So you do not have to invest time in any additional work. Just grab the template now and use them.

Approach Optimization For Brand Promotion Strategy Companys Performance Comparison Before Mockup PDF
This slide shows the comparison of companys performance before and after the product marketing strategy implementation. It shows the comparison based on parameters such as number of product sold, total sale, lead conversion rate, customer retention rate, per customer acquisition cost etc.Boost your pitch with our creative Approach Optimization For Brand Promotion Strategy Companys Performance Comparison Before Mockup PDF. Deliver an awe-inspiring pitch that will mesmerize everyone. Using these presentation templates you will surely catch everyones attention. You can browse the ppts collection on our website. We have researchers who are experts at creating the right content for the templates. So you do not have to invest time in any additional work. Just grab the template now and use them.

Efficient Product Marketing Techniques Companys Performance Comparison Before And After Strategy Formats PDF
This slide shows the comparison of companys performance before and after the product marketing strategy implementation. It shows the comparison based on parameters such as number of product sold, total sale, lead conversion rate, customer retention rate, per customer acquisition cost etc. Boost your pitch with our creative Efficient Product Marketing Techniques Companys Performance Comparison Before And After Strategy Formats PDF. Deliver an awe inspiring pitch that will mesmerize everyone. Using these presentation templates you will surely catch everyones attention. You can browse the ppts collection on our website. We have researchers who are experts at creating the right content for the templates. So you don not have to invest time in any additional work. Just grab the template now and use them.

Competitive Analysis Of Various Companies Based On Product Features Clipart PDF
This slide shows the comparison of companys performance before and after the product marketing strategy implementation. It shows the comparison based on parameters such as number of product sold, total sale, lead conversion rate, customer retention rate, per customer acquisition cost etc.Slidegeeks is one of the best resources for PowerPoint templates. You can download easily and regulate Competitive Analysis Of Various Companies Based On Product Features Clipart PDF for your personal presentations from our wonderful collection. A few clicks is all it takes to discover and get the most relevant and appropriate templates. Use our Templates to add a unique zing and appeal to your presentation and meetings. All the slides are easy to edit and you can use them even for advertisement purposes.
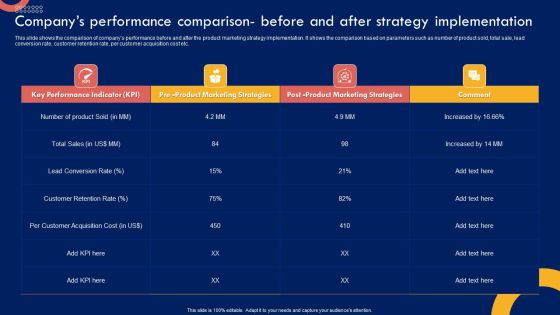
Product Marketing Leadership Companys Performance Comparison Before And After Graphics PDF
This slide shows the comparison of companys performance before and after the product marketing strategy implementation. It shows the comparison based on parameters such as number of product sold, total sale, lead conversion rate, customer retention rate, per customer acquisition cost etc. Slidegeeks is one of the best resources for PowerPoint templates. You can download easily and regulate Product Marketing Leadership Companys Performance Comparison Before And After Graphics PDF for your personal presentations from our wonderful collection. A few clicks is all it takes to discover and get the most relevant and appropriate templates. Use our Templates to add a unique zing and appeal to your presentation and meetings. All the slides are easy to edit and you can use them even for advertisement purposes.

Companys Performance Comparison Before And After Strategy Implementation Professional PDF
This slide shows the comparison of companys performance before and after the product marketing strategy implementation. It shows the comparison based on parameters such as number of product sold, total sale, lead conversion rate, customer retention rate, per customer acquisition cost etc. If you are looking for a format to display your unique thoughts, then the professionally designed Companys Performance Comparison Before And After Strategy Implementation Professional PDF is the one for you. You can use it as a Google Slides template or a PowerPoint template. Incorporate impressive visuals, symbols, images, and other charts. Modify or reorganize the text boxes as you desire. Experiment with shade schemes and font pairings. Alter, share or cooperate with other people on your work. Download Companys Performance Comparison Before And After Strategy Implementation Professional PDF and find out how to give a successful presentation. Present a perfect display to your team and make your presentation unforgettable.

Brand Awareness Plan Companys Performance Comparison Before And After Introduction PDF
This slide shows the comparison of companys performance before and after the product marketing strategy implementation. It shows the comparison based on parameters such as number of product sold, total sale, lead conversion rate, customer retention rate, per customer acquisition cost etc. Welcome to our selection of the Brand Awareness Plan Companys Performance Comparison Before And After Introduction PDF. These are designed to help you showcase your creativity and bring your sphere to life. Planning and Innovation are essential for any business that is just starting out. This collection contains the designs that you need for your everyday presentations. All of our PowerPoints are 100 percent editable, so you can customize them to suit your needs. This multi-purpose template can be used in various situations. Grab these presentation templates today.

Companys Financial Comparison Before And After Implementation Of Promotional Strategies Introduction PDF
This slide shows the comparison of companys performance before and after the product marketing strategy implementation. It shows the comparison based on parameters such as product demand, number of product sold, total sale, lead conversion rate, customer retention rate, per customer acquisition cost etc. If you are looking for a format to display your unique thoughts, then the professionally designed Companys Financial Comparison Before And After Implementation Of Promotional Strategies Introduction PDF is the one for you. You can use it as a Google Slides template or a PowerPoint template. Incorporate impressive visuals, symbols, images, and other charts. Modify or reorganize the text boxes as you desire. Experiment with shade schemes and font pairings. Alter, share or cooperate with other people on your work. Download Companys Financial Comparison Before And After Implementation Of Promotional Strategies Introduction PDF and find out how to give a successful presentation. Present a perfect display to your team and make your presentation unforgettable.

Companys Performance Comparison Before And After Strategy Implementation Slides PDF
This slide shows the comparison of companys performance before and after the product marketing strategy implementation. It shows the comparison based on parameters such as number of product sold, total sale, lead conversion rate, customer retention rate, per customer acquisition cost etc.Create an editable Companys Performance Comparison Before And After Strategy Implementation Slides PDF that communicates your idea and engages your audience. Whether you are presenting a business or an educational presentation, pre-designed presentation templates help save time. Companys Performance Comparison Before And After Strategy Implementation Slides PDF is highly customizable and very easy to edit, covering many different styles from creative to business presentations. Slidegeeks has creative team members who have crafted amazing templates. So, go and get them without any delay.
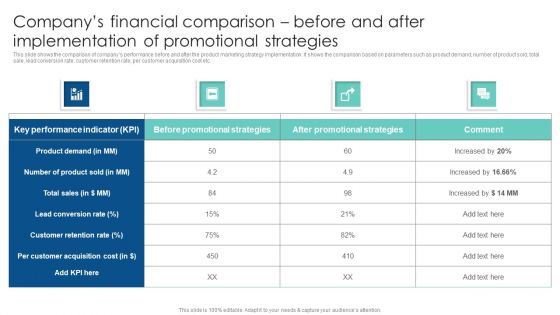
Companys Financial Comparison Before And After Implementation Customer Acquisition Through Advertising Elements PDF
This slide shows the comparison of companys performance before and after the product marketing strategy implementation. It shows the comparison based on parameters such as product demand, number of product sold, total sale, lead conversion rate, customer retention rate, per customer acquisition cost etc. Here you can discover an assortment of the finest PowerPoint and Google Slides templates. With these templates, you can create presentations for a variety of purposes while simultaneously providing your audience with an eye-catching visual experience. Download Companys Financial Comparison Before And After Implementation Customer Acquisition Through Advertising Elements PDF to deliver an impeccable presentation. These templates will make your job of preparing presentations much quicker, yet still, maintain a high level of quality. Slidegeeks has experienced researchers who prepare these templates and write high-quality content for you. Later on, you can personalize the content by editing the Companys Financial Comparison Before And After Implementation Customer Acquisition Through Advertising Elements PDF.
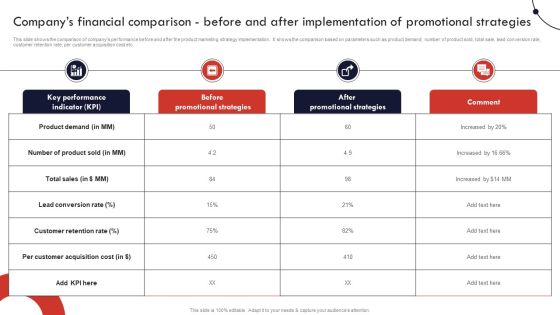
Product And Services Promotion Companys Financial Comparison Before And After Guidelines PDF
This slide shows the comparison of companys performance before and after the product marketing strategy implementation. It shows the comparison based on parameters such as product demand, number of product sold, total sale, lead conversion rate, customer retention rate, per customer acquisition cost etc. Are you in need of a template that can accommodate all of your creative concepts This one is crafted professionally and can be altered to fit any style. Use it with Google Slides or PowerPoint. Include striking photographs, symbols, depictions, and other visuals. Fill, move around, or remove text boxes as desired. Test out color palettes and font mixtures. Edit and save your work, or work with colleagues. Download Product And Services Promotion Companys Financial Comparison Before And After Guidelines PDF and observe how to make your presentation outstanding. Give an impeccable presentation to your group and make your presentation unforgettable.
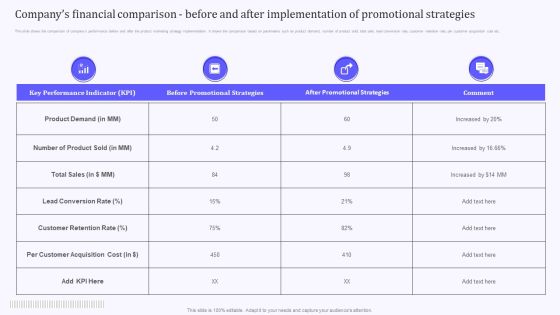
Product Marketing And Awareness Programs Companys Financial Comparison Before And After Rules PDF
This slide shows the comparison of companys performance before and after the product marketing strategy implementation. It shows the comparison based on parameters such as product demand, number of product sold, total sale, lead conversion rate, customer retention rate, per customer acquisition cost etc. Do you have an important presentation coming up Are you looking for something that will make your presentation stand out from the rest Look no further than Product Marketing And Awareness Programs Companys Financial Comparison Before And After Rules PDF. With our professional designs, you can trust that your presentation will pop and make delivering it a smooth process. And with Slidegeeks, you can trust that your presentation will be unique and memorable. So why wait Grab Product Marketing And Awareness Programs Companys Financial Comparison Before And After Rules PDF today and make your presentation stand out from the rest.

Companys Financial Comparison Before And After Implementation Stages To Develop Demand Generation Tactics Template PDF
This slide shows the comparison of companys performance before and after the product marketing strategy implementation. It shows the comparison based on parameters such as product demand, number of product sold, total sale, lead conversion rate, customer retention rate, per customer acquisition cost etc. Create an editable ZZZZZZZZZZZZZZZ that communicates your idea and engages your audience. Whether you are presenting a business or an educational presentation, pre-designed presentation templates help save time. Companys Financial Comparison Before And After Implementation Stages To Develop Demand Generation Tactics Template PDF is highly customizable and very easy to edit, covering many different styles from creative to business presentations. Slidegeeks has creative team members who have crafted amazing templates. So, go and get them without any delay.

Companys Financial Comparison Before And After Implementation Of Promotional Strategies Infographics PDF
This slide shows the comparison of companys performance before and after the product marketing strategy implementation. It shows the comparison based on parameters such as product demand, number of product sold, total sale, lead conversion rate, customer retention rate, per customer acquisition cost etc. If you are looking for a format to display your unique thoughts, then the professionally designed Companys Financial Comparison Before And After Implementation Of Promotional Strategies Infographics PDF is the one for you. You can use it as a Google Slides template or a PowerPoint template. Incorporate impressive visuals, symbols, images, and other charts. Modify or reorganize the text boxes as you desire. Experiment with shade schemes and font pairings. Alter, share or cooperate with other people on your work. Download Companys Financial Comparison Before And After Implementation Of Promotional Strategies Infographics PDF and find out how to give a successful presentation. Present a perfect display to your team and make your presentation unforgettable.
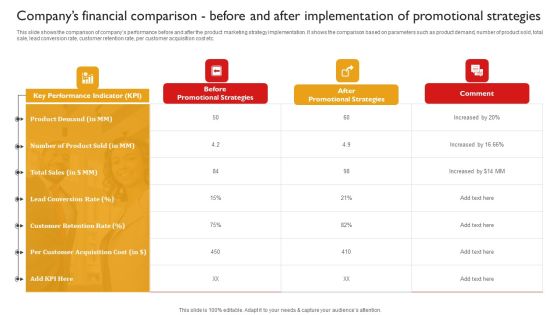
Techniques To Enhance Brand Awareness Companys Financial Comparison Before After Implementation Themes PDF
This slide shows the comparison of companys performance before and after the product marketing strategy implementation. It shows the comparison based on parameters such as product demand, number of product sold, total sale, lead conversion rate, customer retention rate, per customer acquisition cost etc. PDF With our easy to use and customizable templates, you can focus on delivering your ideas rather than worrying about formatting. With a variety of designs to choose from, you are sure to find one that suits your needs. And with animations and unique photos, illustrations, and fonts, you can make your presentation pop. So whether you are giving a sales pitch or presenting to the board, make sure to check out Slidegeeks first.
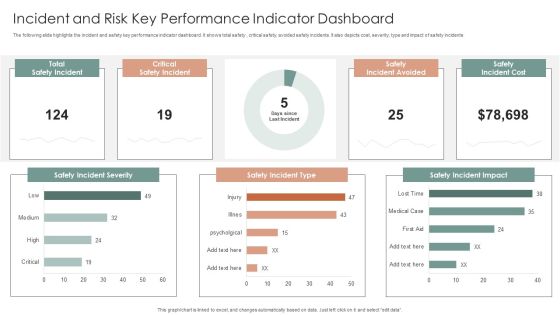
Incident And Risk Key Performance Indicator Dashboard Ppt Gallery Mockup PDF
The following slide highlights the incident and safety key performance indicator dashboard. It shows total safety, critical safety, avoided safety incidents. It also depicts cost, severity, type and impact of safety incidents. Showcasing this set of slides titled Incident And Risk Key Performance Indicator Dashboard Ppt Gallery Mockup PDF. The topics addressed in these templates are Safety Incident Severity, Safety Incident Type, Safety Incident Impact. All the content presented in this PPT design is completely editable. Download it and make adjustments in color, background, font etc. as per your unique business setting.

Strategies Envr Onmental Operational Challenges Company Details With Its Key Statistics Inspiration PDF
This slide shows the company details, founded year, headquarter, CEO, total employees, purpose etc. It also includes the company financials such as total profit and total revenue with key statistics. Presenting strategies envr onmental operational challenges company details with its key statistics inspiration pdf to provide visual cues and insights. Share and navigate important information on ten stages that need your due attention. This template can be used to pitch topics like business overview, total employees, total revenue, total profit, headquarter. In addtion, this PPT design contains high resolution images, graphics, etc, that are easily editable and available for immediate download.
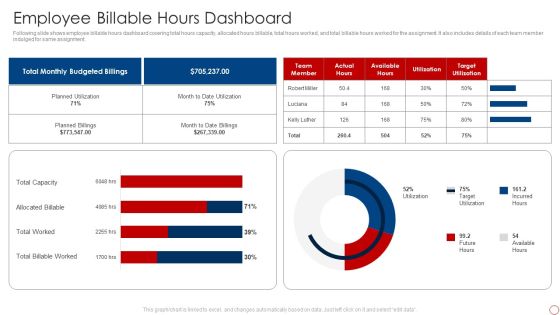
Kpis For Evaluating Business Sustainability Employee Billable Hours Dashboard Professional PDF
Following slide shows employee billable hours dashboard covering total hours capacity, allocated hours billable, total hours worked, and total billable hours worked for the assignment. It also includes details of each team member indulged for same assignment. Deliver and pitch your topic in the best possible manner with this Kpis For Evaluating Business Sustainability Employee Billable Hours Dashboard Professional PDF. Use them to share invaluable insights on Total Billable Worked, Total Worked, Allocated Billable, Total Capacity and impress your audience. This template can be altered and modified as per your expectations. So, grab it now.
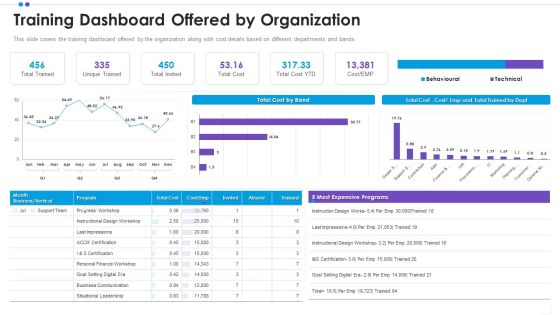
Employee Professional Development Training Dashboard Offered By Organization Template PDF
This slide covers the training dashboard offered by the organization along with cost details based on different departments and bands.Deliver and pitch your topic in the best possible manner with this employee professional development training dashboard offered by organization template pdf Use them to share invaluable insights on unique trained, total invited, total trained and impress your audience. This template can be altered and modified as per your expectations. So, grab it now.

Financial Ppt PowerPoint Presentation Inspiration
This is a financial ppt powerpoint presentation inspiration. This is a six stage process. The stages in this process are total assets, total tax paid, loan, revenue, deposits, net income.
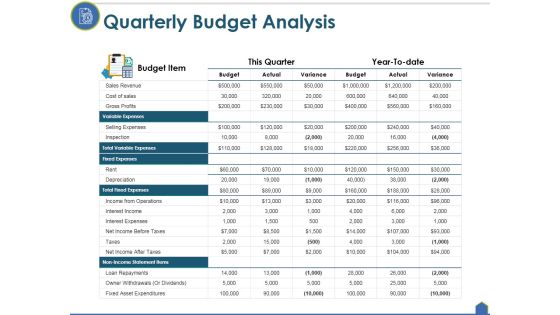
Quarterly Budget Analysis Ppt PowerPoint Presentation Outline Good
This is a quarterly budget analysis ppt powerpoint presentation outline good. This is a two stage process. The stages in this process are variable expenses, total variable expenses, fixed expenses, total fixed expenses, non income statement items.

Financial Ppt PowerPoint Presentation Inspiration Templates
This is a financial ppt powerpoint presentation inspiration templates. This is a six stage process. The stages in this process are total assets, revenue, total tax paid, deposits, loan, net income.

Budgeting Ppt PowerPoint Presentation Model Slideshow
This is a budgeting ppt powerpoint presentation model slideshow. This is a three stage process. The stages in this process are advertising, web marketing, public relations, total advertising, total web marketing.

Project Management Budget Design Template 2 Ppt PowerPoint Presentation Infographics Designs Download
This is a project management budget design template 2 ppt powerpoint presentation infographics designs download. This is a stage process. The stages in this process are internal funding, income, total external income, total income, itemized income.

Balance Sheet Kpis Tabular Form Ppt PowerPoint Presentation Outline Background Image
This is a balance sheet kpis tabular form ppt powerpoint presentation outline background image. This is a four stage process. The stages in this process are current assets, current liabilities, total assets, total liabilities.
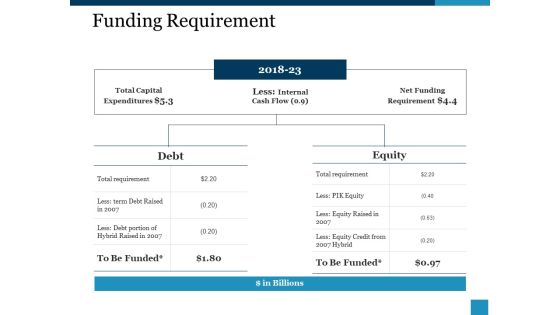
Funding Requirement Ppt PowerPoint Presentation Inspiration Template
This is a funding requirement ppt powerpoint presentation inspiration template. This is a two stage process. The stages in this process are debt, equity, total capital, net funding requirement, total requirement.
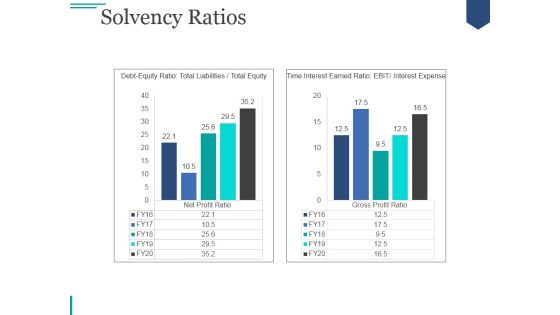
Solvency Ratios Ppt PowerPoint Presentation Example 2015
This is a solvency ratios ppt powerpoint presentation example 2015. This is a two stage process. The stages in this process are debt equity ratio, total liabilities, total equity.

Balance Sheet Kpis Template 2 Ppt PowerPoint Presentation Ideas Graphics
This is a balance sheet kpis template 2 ppt powerpoint presentation ideas graphics. This is a four stage process. The stages in this process are current assets, current liabilities, total assets, total liabilities.

Financial Ppt PowerPoint Presentation File Format Ideas
This is a financial ppt powerpoint presentation file format ideas. This is a six stage process. The stages in this process are total assets, total tax paid, loan, revenue, deposits, net income.
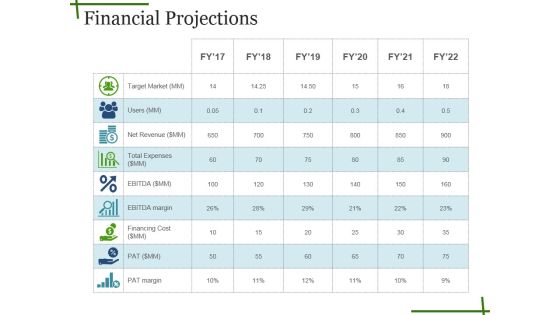
Financial Projections Ppt PowerPoint Presentation Show Format
This is a financial projections ppt powerpoint presentation show format. This is a six stage process. The stages in this process are total assets, total tax paid, loan, revenue, deposits.

Funding Updates Equity Ppt PowerPoint Presentation Outline Show
This is a funding updates equity ppt powerpoint presentation outline show. This is a two stage process. The stages in this process are total shares, shareholding pattern, percentage, shareholder name, total.

Funding Updates Equity Ppt PowerPoint Presentation Pictures Inspiration
This is a funding updates equity ppt powerpoint presentation pictures inspiration. This is a eleven stage process. The stages in this process are shareholder name, shareholder pattern, total share, total, name.

Sales Dashboard Template 2 Ppt PowerPoint Presentation Introduction
This is a sales dashboard template 2 ppt powerpoint presentation introduction. This is a four stage process. The stages in this process are total sales by month, lead sources revenue share, win loss ratio, opportunities total sales by probability.

Book Value Per Share Pat Ppt PowerPoint Presentation Ideas Influencers
This is a book value per share pat ppt powerpoint presentation ideas influencers. This is a one stage process. The stages in this process are book value per share, total equity, total outstanding shares.

Balance Sheet Kpis Template 2 Ppt PowerPoint Presentation Infographic Template Background Images
This is a balance sheet kpis template 2 ppt powerpoint presentation infographic template background images. This is a four stage process. The stages in this process are total fixed assets, current assets, total assets, inventories, current investments.

Shareholding Pattern Ppt PowerPoint Presentation Styles Gallery
This is a shareholding pattern ppt powerpoint presentation styles gallery. This is a two stage process. The stages in this process are before funding, total, after funding, total shares, finance.

Sales Revenue Product Ppt PowerPoint Presentation Infographic Template Backgrounds
This is a sales revenue product ppt powerpoint presentation infographic template backgrounds. This is a three stage process. The stages in this process are product wise revenue, profit percent of total revenue, total income product.
Solvency Ratios Template Ppt PowerPoint Presentation Inspiration Icons
This is a solvency ratios template ppt powerpoint presentation inspiration icons. This is a two stage process. The stages in this process are debt equity ratio, total liabilities total equity, time interest earned ratio, ebit interest expense.

Solvency Ratios Ppt PowerPoint Presentation Inspiration Guidelines
This is a solvency ratios ppt powerpoint presentation inspiration guidelines. This is a two stage process. The stages in this process are debt equity ratio, total liabilities total equity, time interest earned ratio, ebit interest expense.

Solvency Ratios Ppt PowerPoint Presentation Professional
This is a solvency ratios ppt powerpoint presentation professional. This is a two stage process. The stages in this process are debt equity ratio, time interest earned ratio, total liabilities, total equity, interest expense.
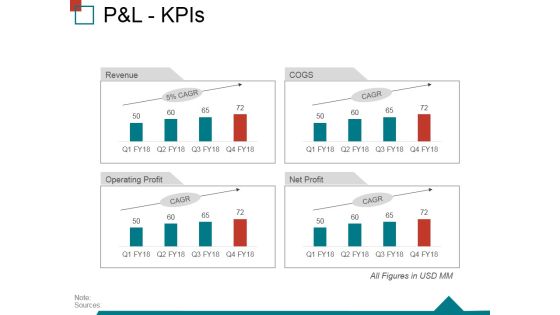
Pandl Kpis Ppt PowerPoint Presentation Outline Visuals
This is a pandl kpis ppt powerpoint presentation outline visuals. This is a four stage process. The stages in this process are other income, total income, expenses, total material consumed, other expenses.

Pandl Kpis Ppt PowerPoint Presentation Professional Show
This is a pandl kpis ppt powerpoint presentation professional show. This is a four stage process. The stages in this process are other income, total income, expenses, total material consumed, employee benefit expense.
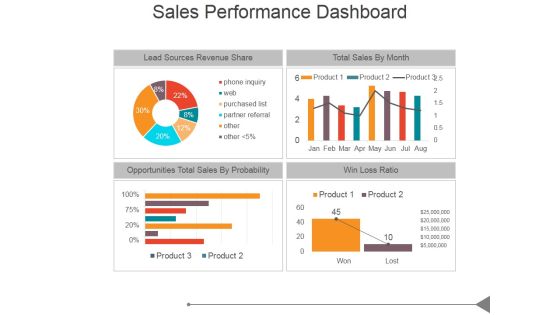
Sales Performance Dashboard Ppt PowerPoint Presentation Good
This is a sales performance dashboard ppt powerpoint presentation good. This is a four stage process. The stages in this process are lead sources revenue share, total sales by month, opportunities total sales by probability, win loss ratio.
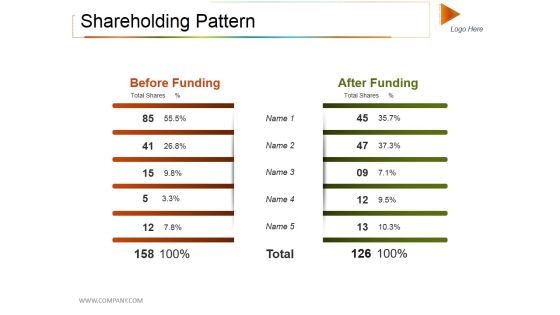
Shareholding Pattern Ppt PowerPoint Presentation Summary Outfit
This is a shareholding pattern ppt powerpoint presentation summary outfit. This is a two stage process. The stages in this process are before funding, after funding, total, total shares.
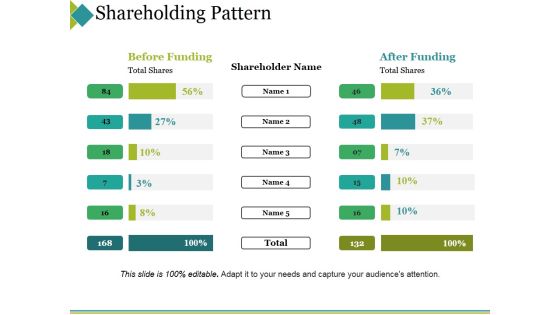
Shareholding Pattern Ppt PowerPoint Presentation Pictures Aids
This is a shareholding pattern ppt powerpoint presentation pictures aids. This is a two stage process. The stages in this process are before funding, after funding, shareholder name, total shares, total.
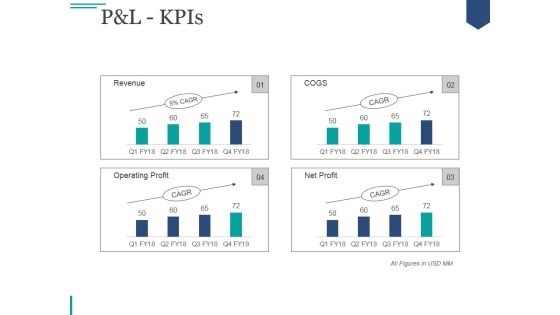
Pandl Kpis Ppt PowerPoint Presentation Deck
This is a pandl kpis ppt powerpoint presentation deck. This is a four stage process. The stages in this process are net sales, other income, total income, expenses, total material consumed.
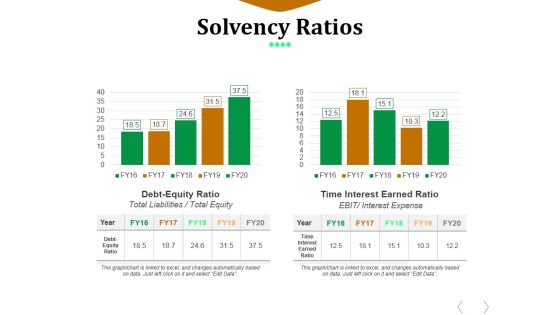
Solvency Ratios Template 1 Ppt PowerPoint Presentation File Gallery
This is a solvency ratios template 1 ppt powerpoint presentation file gallery. This is a two stage process. The stages in this process are debt equity, time interest earned ratio, total liabilities, total equity, ebit, interest expense.
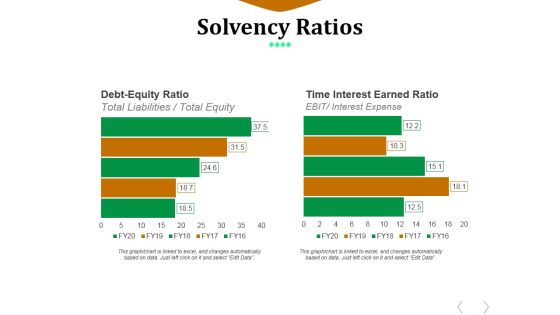
Solvency Ratios Template 2 Ppt PowerPoint Presentation File Example File
This is a solvency ratios template 2 ppt powerpoint presentation file example file. This is a two stage process. The stages in this process are debt equity ratio, time interest earned ratio, total liabilities, total equity, ebit, interest expense.

Pandl Kpis Ppt PowerPoint Presentation Gallery Slides
This is a pandl kpis ppt powerpoint presentation gallery slides. This is a four stage process. The stages in this process are net sales, other income, total income, expenses, total material consumed.
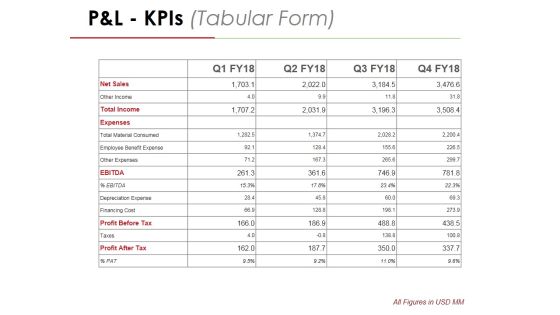
P And L Kpis Template 2 Ppt PowerPoint Presentation Professional Graphics
This is a p and l kpis template 2 ppt powerpoint presentation professional graphics. This is a four stage process. The stages in this process are net sales, other income, total income, expenses, total material consumed.

Solvency Ratios Template 1 Ppt PowerPoint Presentation Portfolio Display
This is a solvency ratios template 1 ppt powerpoint presentation portfolio display. This is a two stage process. The stages in this process are debt equity ratio, total liabilities, total equity, time interest earned ratio, ebit, interest expense.

Solvency Ratios Template 2 Ppt PowerPoint Presentation Pictures Ideas
This is a solvency ratios template 2 ppt powerpoint presentation pictures ideas. This is a two stage process. The stages in this process are debt equity ratio, total liabilities, total equity, time interest earned ratio, ebit, interest expense.

Pandl Kpis Ppt PowerPoint Presentation Infographic Template Layout
This is a pandl kpis ppt powerpoint presentation infographic template layout. This is a four stage process. The stages in this process are net sales, other income, total income, expenses, total material consumed.

Income Statement Kpis Ppt PowerPoint Presentation Styles Clipart Images
This is a income statement kpis ppt powerpoint presentation styles clipart images. This is a four stage process. The stages in this process are net sales, other income, total income, expenses, total material consumed.

Solvency Ratios Template 1 Ppt PowerPoint Presentation Visual Aids Infographic Template
This is a solvency ratios template 1 ppt powerpoint presentation visual aids infographic template. This is a five stage process. The stages in this process are debt equity ratio, time interest earned ratio, interest expense, total liabilities, total equity.
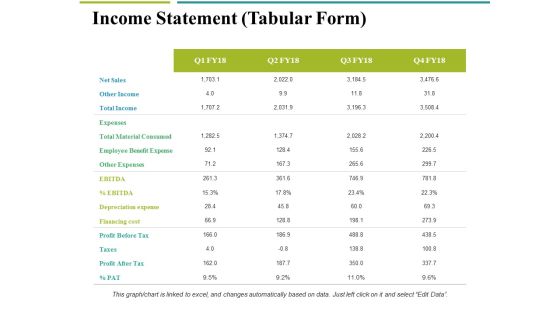
Income Statement Tabular Form Ppt PowerPoint Presentation Inspiration Examples
This is a income statement tabular form ppt powerpoint presentation inspiration examples. This is a four stage process. The stages in this process are net sales, other income, total income, expenses, total material consumed.
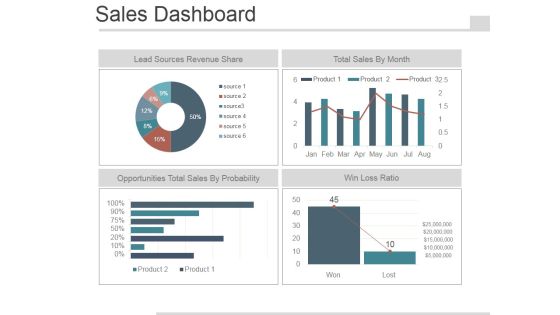
Sales Dashboard Slide Template 2 Ppt PowerPoint Presentation Images
This is a sales dashboard slide template 2 ppt powerpoint presentation images. This is a four stage process. The stages in this process are lead sources revenue share, total sales by month, opportunities total sales by probability, win loss ratio.

 Home
Home