AI PPT Maker
Templates
PPT Bundles
Design Services
Business PPTs
Business Plan
Management
Strategy
Introduction PPT
Roadmap
Self Introduction
Timelines
Process
Marketing
Agenda
Technology
Medical
Startup Business Plan
Cyber Security
Dashboards
SWOT
Proposals
Education
Pitch Deck
Digital Marketing
KPIs
Project Management
Product Management
Artificial Intelligence
Target Market
Communication
Supply Chain
Google Slides
Research Services
 One Pagers
All Categories
-
Home
- Customer Favorites
- Top 10 List
Top 10 List
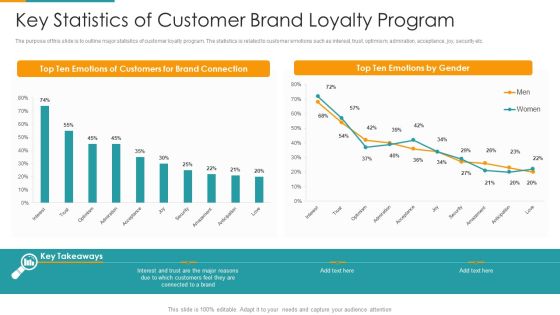
Key Statistics Of Customer Brand Loyalty Program Ppt PowerPoint Presentation File Background Image PDF
The purpose of this slide is to outline major statistics of customer loyalty program. The statistics is related to customer emotions such as interest, trust, optimism, admiration, acceptance, joy, security etc. Showcasing this set of slides titled key statistics of customer brand loyalty program ppt powerpoint presentation file background image pdf. The topics addressed in these templates are top ten emotions, customers for brand connection, top ten emotions by gender. All the content presented in this PPT design is completely editable. Download it and make adjustments in color, background, font etc. as per your unique business setting.

Business Assessment Outline Business Management Dashboards Region Ppt Icon Aids PDF
Deliver and pitch your topic in the best possible manner with this business assessment outline business management dashboards region ppt icon aids pdf. Use them to share invaluable insights on top ten products by profit margin, revenue and sales last 12 months, customers by region, new customers signups, sales by product category and impress your audience. This template can be altered and modified as per your expectations. So, grab it now.

Business Operations Assessment Business Management Dashboards Product Ppt Ideas PDF
Deliver and pitch your topic in the best possible manner with this business operations assessment business management dashboards product ppt ideas pdf. Use them to share invaluable insights on top ten products by profit margin, revenue and sales last 12 months, customers by region, new customers signups, sales by product category and impress your audience. This template can be altered and modified as per your expectations. So, grab it now.
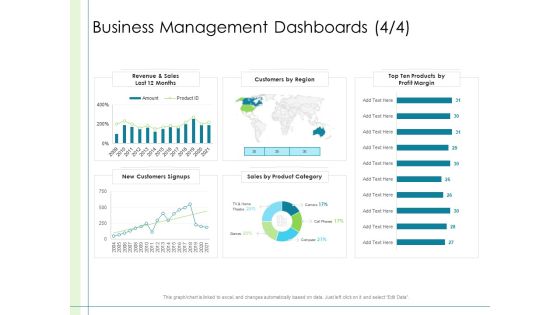
In Depth Business Assessment Business Management Dashboards Sales Ppt PowerPoint Presentation Ideas Background PDF
Deliver an awe-inspiring pitch with this creative in depth business assessment business management dashboards sales ppt powerpoint presentation ideas background pdf bundle. Topics like revenue and sales last 12 months, customers by region, top ten products by profit margin, sales by product category, new customers signups can be discussed with this completely editable template. It is available for immediate download depending on the needs and requirements of the user.

Administrative Regulation Business Management Dashboards Sales Ppt PowerPoint Presentation Inspiration Layouts PDF
Deliver an awe-inspiring pitch with this creative administrative regulation business management dashboards sales ppt powerpoint presentation inspiration layouts pdf bundle. Topics like top ten products by profit margin, revenue and sales last 12 months, customers by regione, customers signups, sales by product category can be discussed with this completely editable template. It is available for immediate download depending on the needs and requirements of the user.
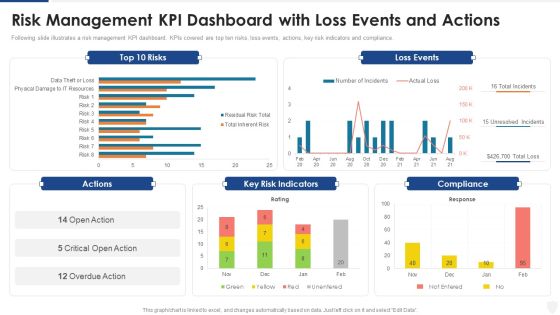
Risk Management KPI Dashboard With Loss Events And Actions Ppt Backgrounds PDF
Following slide illustrates a risk management KPI dashboard. KPIs covered are top ten risks, loss events, actions, key risk indicators and compliance. Deliver and pitch your topic in the best possible manner with this risk management kpi dashboard with loss events and actions ppt backgrounds pdf. Use them to share invaluable insights on risk management kpi dashboard with loss events and actions and impress your audience. This template can be altered and modified as per your expectations. So, grab it now.
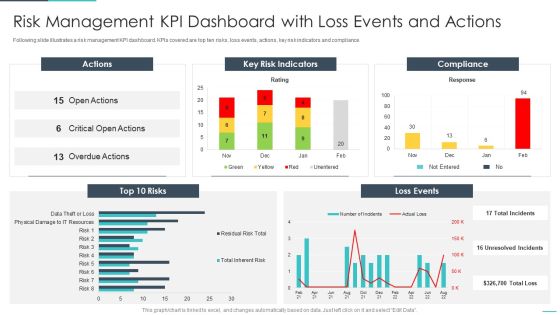
Handling Cyber Threats Digital Era Risk Management KPI Dashboard With Loss Ppt Slides PDF
Following slide illustrates a risk management KPI dashboard. KPIs covered are top ten risks, loss events, actions, key risk indicators and compliance. Deliver an awe inspiring pitch with this creative handling cyber threats digital era risk management kpi dashboard with loss ppt slides pdf bundle. Topics like gement kpi dashboard with loss events and actions can be discussed with this completely editable template. It is available for immediate download depending on the needs and requirements of the user.

Risk Based Procedures To IT Security Risk Management KPI Dashboard With Loss Events And Actions Mockup PDF
Following slide illustrates a risk management KPI dashboard. KPIs covered are top ten risks, loss events, actions, key risk indicators and compliance. Deliver an awe inspiring pitch with this creative Risk Based Procedures To IT Security Risk Management KPI Dashboard With Loss Events And Actions Mockup PDF bundle. Topics like Key Risk, Indicators Compliance, Loss Events can be discussed with this completely editable template. It is available for immediate download depending on the needs and requirements of the user.
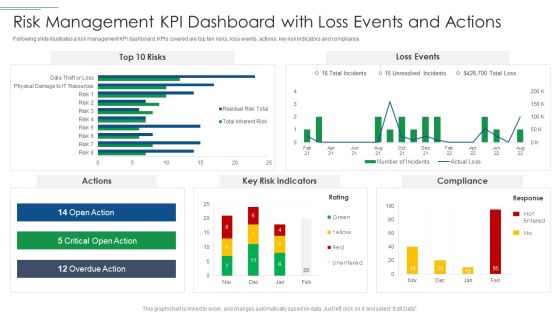
IT Security Risk Management Approach Introduction Risk Management KPI Dashboard With Loss Events Brochure PDF
Following slide illustrates a risk management KPI dashboard. KPIs covered are top ten risks, loss events, actions, key risk indicators and compliance. Deliver an awe inspiring pitch with this creative IT Security Risk Management Approach Introduction Risk Management KPI Dashboard With Loss Events Brochure PDF bundle. Topics like Key Risk Indicators, Risk Management can be discussed with this completely editable template. It is available for immediate download depending on the needs and requirements of the user.

Toolkit For Data Science And Analytics Transition Work Streams Organizational Structure For Data Analytics Rules PDF
This slide shows the organization structure model including the analytics leadership, analytical tool for to obtain the business results. Slidegeeks has constructed Toolkit For Data Science And Analytics Transition Work Streams Organizational Structure For Data Analytics Rules PDF after conducting extensive research and examination. These presentation templates are constantly being generated and modified based on user preferences and critiques from editors. Here, you will find the most attractive templates for a range of purposes while taking into account ratings and remarks from users regarding the content. This is an excellent jumping off point to explore our content and will give new users an insight into our top notch PowerPoint Templates.
Key Agriculture Commodities Exported From Ukraine Icons PDF
This slide covers top ten export commodities of Ukraine. It also includes the quantity sold for items such as corn, wheat, animal, vegetable oils, soybean oil, cereals, rye, barley, oats, sunflower seeds, rapeseed, and colza seeds.Deliver and pitch your topic in the best possible manner with this key agriculture commodities exported from ukraine icons pdf Use them to share invaluable insights on exporters of grains, exports respectively, ores and concentrates and impress your audience. This template can be altered and modified as per your expectations. So, grab it now.
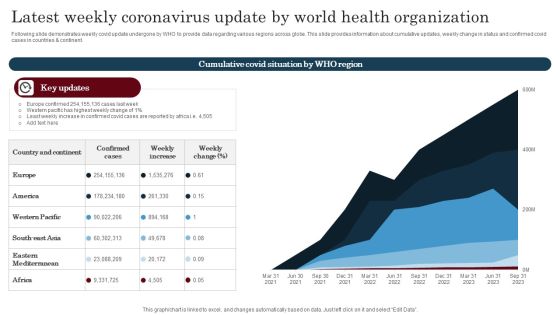
Latest Weekly Coronavirus Update By World Health Organization Diagrams PDF
Following slide highlights the top ten counties coronavirus data which helps community to evaluate current status and follow protocols. This slide includes country specific information such as total cases, death toll, recovered and active cases, etc. Showcasing this set of slides titled Latest Weekly Coronavirus Update By World Health Organization Diagrams PDF. The topics addressed in these templates are atest Weekly Coronavirus, Update, World Health Organization. All the content presented in this PPT design is completely editable. Download it and make adjustments in color, background, font etc. as per your unique business setting.

Consumer Partition Dashboard For Email Campaigns Infographics PDF
The following slide depicts a dashboard which can be used by marketers for sending targeted mails to customers and enhance customer retention. The key performing indicators are number of customers, average value or orders, number of orders, top ten percent customers etc. Showcasing this set of slides titled Consumer Partition Dashboard For Email Campaigns Infographics PDF. The topics addressed in these templates are Average Life Time Value, Average Value Of Orders, Returns, Average Number Of Orders. All the content presented in this PPT design is completely editable. Download it and make adjustments in color, background, font etc. as per your unique business setting.
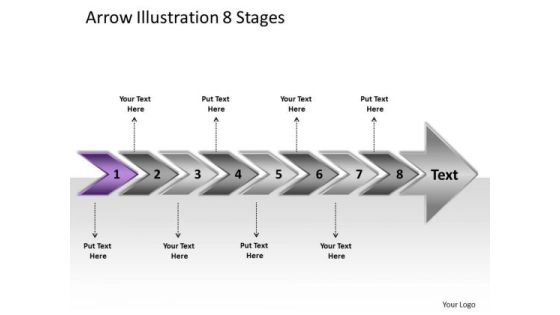
Arrow Illustration 8 Stages Flow Chart Slides PowerPoint
We present our arrow illustration 8 stages flow chart Slides PowerPoint. Use our Arrows PowerPoint Templates because, getting it done in time is the key to success. Use our Business PowerPoint Templates because; illustrate your plans on using the many social media modes available to inform society at large of the benefits of your product. Use our Shapes PowerPoint Templates because, our ready backdrops leave a lasting impression. Use our Finance PowerPoint Templates because, Present your views using our innovative slides and be assured of leaving a lasting impression. Use our Process and Flows PowerPoint Templates because, and keep you group steady in the top bracket. Use these PowerPoint slides for presentations relating to 3d arrow background bullet business chart checkmark chevron diagram drop eps10 financial five glass graphic gray icon illustration management point process project reflection set shadow stage text transparency vector white. The prominent colors used in the PowerPoint template are Purple, Gray, and Black

Dashboard To Track Beverage Brand Revenue And Sales Structure PDF
This slide covers dashboard to track sales and revenue generated by brand . The purpose of this template is to provide information based on generation of profits annually along with total units sold. It also includes elements such as tracking based on top ten cities, sales by retailers, operating profit and margin, etc. Are you in need of a template that can accommodate all of your creative concepts This one is crafted professionally and can be altered to fit any style. Use it with Google Slides or PowerPoint. Include striking photographs, symbols, depictions, and other visuals. Fill, move around, or remove text boxes as desired. Test out color palettes and font mixtures. Edit and save your work, or work with colleagues. Download Dashboard To Track Beverage Brand Revenue And Sales Structure PDF and observe how to make your presentation outstanding. Give an impeccable presentation to your group and make your presentation unforgettable.

Of Successful Business PowerPoint Presentations Plan Cycle Process Templates
We present our of successful business powerpoint presentations plan Cycle Process templates.Download our Flows Charts PowerPoint Templates because You are working at that stage with an air of royalty. Let our PowerPoint Templates and Slides be the jewels in your crown. Download our Arrows PowerPoint Templates because your group can behave steady in the top bracket. Download our Marketing PowerPoint Templates because networking is an imperative in todays world. You need to access the views of others. Similarly you need to give access to them of your abilities. Use our Business PowerPoint Templates because the fruits of your labour are beginning to show.Enlighten them on the great plans you have for their enjoyment. Use our Shapes PowerPoint Templates because there is a crucial aspect that requires extra attention.Use these PowerPoint slides for presentations relating to Arrow, background, banner,bluelight, concept,creative, design, direction, flow, ten,illustration, infographic, instruction, label,layout, manual, marketing, modern, next,number, offer, one, options, order,pointer, process, product,promotion, sequence, simple, special,step, symbol. The prominent colors used in the PowerPoint template are Blue light, White, Black. Customers tell us our of successful business powerpoint presentations plan Cycle Process templates are One-of-a-kind. We assure you our direction PowerPoint templates and PPT Slides are second to none. PowerPoint presentation experts tell us our of successful business powerpoint presentations plan Cycle Process templates are Adorable. People tell us our bluelight PowerPoint templates and PPT Slides are Splendid. We assure you our of successful business powerpoint presentations plan Cycle Process templates are Efficacious. Use our design PowerPoint templates and PPT Slides will help you be quick off the draw. Just enter your specific text and see your points hit home.

PowerPoint Presentation Diverging Process Arrow Chart 4 Steps Pie Templates
We present our powerpoint presentation diverging process arrow chart 4 steps Pie templates.Download and present our Arrows PowerPoint Templates because the graphic is a symbol of growth and success. Download our Process and flows PowerPoint Templates because it shows the pyramid which is a symbol of the desire to reach the top in a steady manner. Use our Flow Charts PowerPoint Templates because you have a clear vision of the cake you want. Use our Business PowerPoint Templates because the fruits of your labour are beginning to show.Enlighten them on the great plans you have for their enjoyment. Download our Marketing PowerPoint Templates because The marketplace is the merger of your dreams and your ability. Use these PowerPoint slides for presentations relating to Arrow, background, banner,concept,creative, design, direction, flow, ten,illustration, infographic, instruction, label,layout, manual, marketing, modern, next,number, offer, one, options, order,pointer, process, product,promotion, sequence, simple, special,step, symbol. The prominent colors used in the PowerPoint template are Yellow, Gray, White. Customers tell us our powerpoint presentation diverging process arrow chart 4 steps Pie templates are Lush. We assure you our concept PowerPoint templates and PPT Slides are specially created by a professional team with vast experience. They diligently strive to come up with the right vehicle for your brilliant Ideas. PowerPoint presentation experts tell us our powerpoint presentation diverging process arrow chart 4 steps Pie templates look good visually. People tell us our flow PowerPoint templates and PPT Slides are Fantastic. We assure you our powerpoint presentation diverging process arrow chart 4 steps Pie templates are Great. Use our creative PowerPoint templates and PPT Slides are effectively colour coded to prioritise your plans They automatically highlight the sequence of events you desire.

Regular Demonstration Of 12 Diverging Arrows Circular Process Diagram PowerPoint Templates
We present our regular demonstration of 12 diverging arrows Circular Process Diagram PowerPoint templates.Use our Process and Flows PowerPoint Templates because you have a great training programme in mind to upgrade the skills of your staff. Download our Arrows PowerPoint Templates because it is in your DNA to analyse possible causes to the minutest detail. Download and present our Marketing PowerPoint Templates because customer satisfaction is a mantra of the marketplace. Building a loyal client base is an essential element of your business. Download our Flow charts PowerPoint Templates because your group can behave steady in the top bracket. Download our Targets PowerPoint Templates because there is a key aspect to be emphasised.Use these PowerPoint slides for presentations relating to Arrow,concept,creative, design, direction, flow, ten,illustration, infographic, instruction, label,layout, manual, marketing, modern, next,number, offer, one, options, order,pointer, process, product,promotion, sequence, simple, special,step, symbol. The prominent colors used in the PowerPoint template are Blue, Black, Gray. Customers tell us our regular demonstration of 12 diverging arrows Circular Process Diagram PowerPoint templates will make the presenter successul in his career/life. We assure you our infographic PowerPoint templates and PPT Slides are topically designed to provide an attractive backdrop to any subject. PowerPoint presentation experts tell us our regular demonstration of 12 diverging arrows Circular Process Diagram PowerPoint templates are Playful. People tell us our direction PowerPoint templates and PPT Slides are designed to make your presentations professional. We assure you our regular demonstration of 12 diverging arrows Circular Process Diagram PowerPoint templates are Clever. Use our illustration PowerPoint templates and PPT Slides are Handsome.

Arrow Illustration 8 Stages Open Source Flowchart PowerPoint Slides
We present our arrow illustration 8 stages open source flowchart PowerPoint Slides. Use our Arrows PowerPoint Templates because, coincidentally it always points to the top. Use our Business PowerPoint Templates because; now funnel your marketing strategies down the cone, stage by stage, refining as you go along. Use our Shapes PowerPoint Templates because, Amplify on your plans to have dedicated sub groups working on related but distinct tasks. Use our Finance PowerPoint Templates because, There are different paths to gain the necessary knowledge to achieved it. Use our Process and Flows PowerPoint Templates because; Take your team along by explaining your plans. Use these PowerPoint slides for presentations relating to 3d arrow background bullet business chart checkmark chevron diagram drop eps10 financial five glass graphic gray icon illustration management point process project reflection set shadow stage text transparency vector white. The prominent colors used in the PowerPoint template are Purple, Gray, and Black
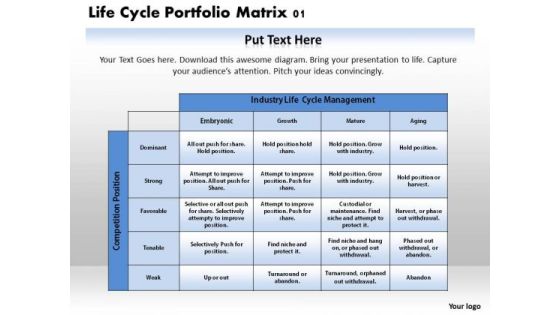
Life Cycle Portfolio Matrix 01 Business PowerPoint Presentation
Establish The Dominance Of Your Ideas. Our Life Cycle Portfolio Matrix 01 Business Powerpoint Presentation Powerpoint Templates Will Put Them On Top.
