AI PPT Maker
Templates
PPT Bundles
Design Services
Business PPTs
Business Plan
Management
Strategy
Introduction PPT
Roadmap
Self Introduction
Timelines
Process
Marketing
Agenda
Technology
Medical
Startup Business Plan
Cyber Security
Dashboards
SWOT
Proposals
Education
Pitch Deck
Digital Marketing
KPIs
Project Management
Product Management
Artificial Intelligence
Target Market
Communication
Supply Chain
Google Slides
Research Services
 One Pagers
All Categories
-
Home
- Customer Favorites
- Testing Icon
Testing Icon

Dashboard Highlighting Product Kpis For Enhancement Strategy Structure PDF
This slide illustrates dashboard indicating product kpis for improvement plan which can be referred by organizations to review sales campaign performance. It includes information about top products in revenue, online vs. Offline transactions, increased sales by campaign and cost of products sold. Showcasing this set of slides titled Dashboard Highlighting Product Kpis For Enhancement Strategy Structure PDF. The topics addressed in these templates are Revenue, Products, Cost. All the content presented in this PPT design is completely editable. Download it and make adjustments in color, background, font etc. as per your unique business setting.

Merger And Acquisition Buying Strategy For Business Growth Mergers And Acquisitions By Sector Designs PDF
The slide illustrates the graph of number of merger and acquisition deals by sector that the company has completed in last five years. It also covers key facts CAGR growth, deal value etc. related to merger and acquisition deals of the company. Deliver an awe inspiring pitch with this creative Merger And Acquisition Buying Strategy For Business Growth Mergers And Acquisitions By Sector Designs PDF bundle. Topics like Acquisition Value, Financials Services Sector can be discussed with this completely editable template. It is available for immediate download depending on the needs and requirements of the user.

Retail Outlet Operational Efficiency Analytics Sales Dashboards For Retail Store Inspiration PDF
This slide illustrates the dashboard retail store sales forecasting providing information regarding sales per employee, price unit every transaction, total number of customers and average value of customer transaction. Deliver and pitch your topic in the best possible manner with this Retail Outlet Operational Efficiency Analytics Sales Dashboards For Retail Store Inspiration PDF. Use them to share invaluable insights on Gross Sales, Total No Customers, Value Customer and impress your audience. This template can be altered and modified as per your expectations. So, grab it now.

Company Financials Performance Tracking Dashboard Brochure PDF
This slide illustrates KPI dashboard that can be used by organizations to track their financial performance on company basis. Kpis covered in the slide are contract status, revenue, cost of goods, overdue and task status. Showcasing this set of slides titled Company Financials Performance Tracking Dashboard Brochure PDF. The topics addressed in these templates are Report Shortcut, Revenue Cost, Overdue Task. All the content presented in this PPT design is completely editable. Download it and make adjustments in color, background, font etc. as per your unique business setting.

Dashboard For E Commerce Project Management Ppt Ideas Design Inspiration PDF
Mentioned slide illustrates a dashboard which can be used by company for e-Commerce project management. The various metrics mentioned in the slide are new orders, total revenue, expenses, new users, etc. Showcasing this set of slides titled Dashboard For E Commerce Project Management Ppt Ideas Design Inspiration PDF. The topics addressed in these templates are New Orders, Total Income, Total Expense. All the content presented in this PPT design is completely editable. Download it and make adjustments in color, background, font etc. as per your unique business setting.
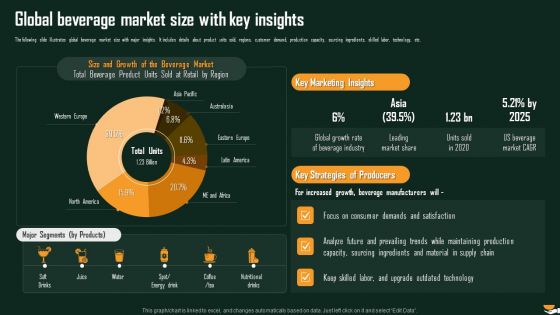
Global Beverage Market Size With Key Insights International Food And Beverages Sector Analysis Slides PDF
The following slide illustrates global beverage market size with major insights. It includes details about product units sold, regions, customer demand, production capacity, sourcing ingredients, skilled labor, technology, etc. Deliver and pitch your topic in the best possible manner with this Global Beverage Market Size With Key Insights International Food And Beverages Sector Analysis Slides PDF. Use them to share invaluable insights on Size Growth, Beverage Market, Marketing Insights and impress your audience. This template can be altered and modified as per your expectations. So, grab it now.
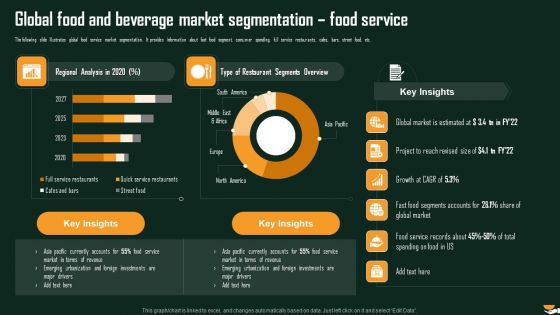
Global Food And Beverage Market Segmentation Food Service International Food And Beverages Sector Analysis Formats PDF
The following slide illustrates global food service market segmentation. It provides information about fast food segment, consumer spending, full service restaurants, cafes, bars, street food, etc. Deliver and pitch your topic in the best possible manner with this Global Food And Beverage Market Segmentation Food Service International Food And Beverages Sector Analysis Formats PDF. Use them to share invaluable insights on Regional Analysis, Restaurant Segments, Market Estimated and impress your audience. This template can be altered and modified as per your expectations. So, grab it now.
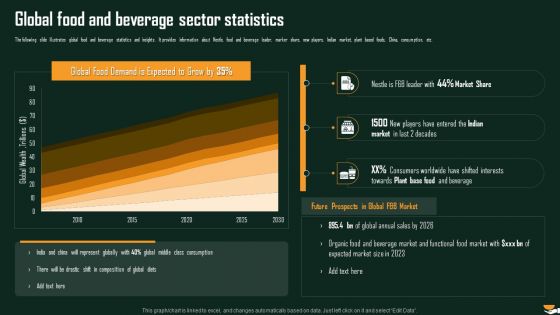
Global Food And Beverage Sector Statistics International Food And Beverages Sector Analysis Summary PDF
The following slide illustrates global food and beverage statistics and insights. It provides information about Nestle, food and beverage leader, marker share, new players, Indian market, plant based foods, China, consumption, etc. Deliver and pitch your topic in the best possible manner with this Global Food And Beverage Sector Statistics International Food And Beverages Sector Analysis Summary PDF. Use them to share invaluable insights on Demand Entered, Indian Expected, Functional Food and impress your audience. This template can be altered and modified as per your expectations. So, grab it now.
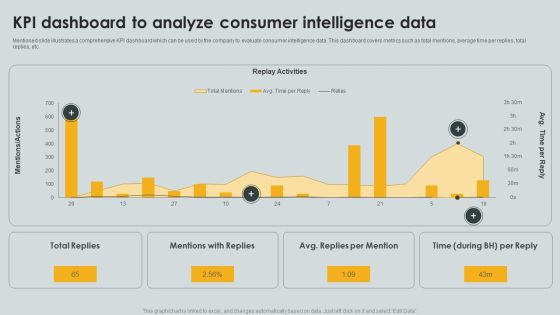
KPI Dashboard To Analyze Consumer Intelligence Data Ppt PowerPoint Presentation File Portfolio PDF
Mentioned slide illustrates a comprehensive KPI dashboard which can be used by the company to evaluate consumer intelligence data. This dashboard covers metrics such as total mentions, average time per replies, total replies, etc. Pitch your topic with ease and precision using this KPI Dashboard To Analyze Consumer Intelligence Data Ppt PowerPoint Presentation File Portfolio PDF. This layout presents information on Replay Activities, Total Replies, Mentions Replies. It is also available for immediate download and adjustment. So, changes can be made in the color, design, graphics or any other component to create a unique layout.

Business Clients Composition Dashboard For Capital Fund Raising Ppt Infographic Template Microsoft PDF
This slide illustrates facts related to composition to corporate clients for capital raising. It includes revenue contribution by clients, total contract value, new and active clients and client metrics etc. Showcasing this set of slides titled Business Clients Composition Dashboard For Capital Fund Raising Ppt Infographic Template Microsoft PDF. The topics addressed in these templates are Revenue Contribution Clients, Client Metrics, Total Contract Value. All the content presented in this PPT design is completely editable. Download it and make adjustments in color, background, font etc. as per your unique business setting.

Buy Side Merger And Acquisition Pitch Book Mergers And Acquisitions By Sector Summary PDF
The slide illustrates the graph of number of merger and acquisition deals by sector that the company has completed in last five years. It also covers key facts CAGR growth, deal value etc. related to merger and acquisition deals of the company. Deliver an awe inspiring pitch with this creative Buy Side Merger And Acquisition Pitch Book Mergers And Acquisitions By Sector Summary PDF bundle. Topics like Financials Services, Acquisition Value can be discussed with this completely editable template. It is available for immediate download depending on the needs and requirements of the user.

Business Management Strategy Survey To Boost Sales Summary PDF
This slide illustrate survey result of various promotional tactics used by top 1000 multi national companies to promote their product and services. it includes promotional strategies such as online advertisement, business directory, social media platforms etc. Pitch your topic with ease and precision using this Business Management Strategy Survey To Boost Sales Summary PDF. This layout presents information on Advertisement Strategy, Organization, Social Median. It is also available for immediate download and adjustment. So, changes can be made in the color, design, graphics or any other component to create a unique layout.

Customer Acquisition Plan Marketing Strategy Tools Information PDF
This slide illustrate success rate of various platform used for attracting and acquiring customer. It includes marketing tools such as website, email marketing, word of mouth communication, print advertisement, social media platforms etc. Showcasing this set of slides titled Customer Acquisition Plan Marketing Strategy Tools Information PDF. The topics addressed in these templates are Strategies, Customers, Marketing. All the content presented in this PPT design is completely editable. Download it and make adjustments in color, background, font etc. as per your unique business setting.
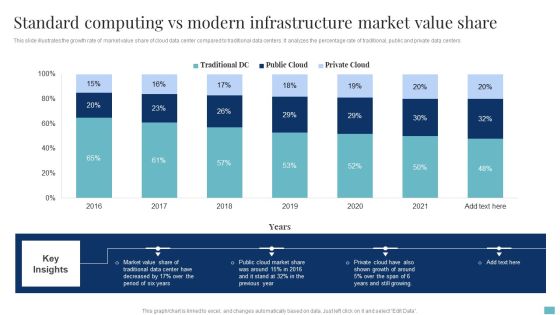
Standard Computing Vs Modern Infrastructure Market Value Share Brochure PDF
This slide illustrates the growth rate of market value share of cloud data center compared to traditional data centers. It analyzes the percentage rate of traditional, public and private data centers. Pitch your topic with ease and precision using this Standard Computing Vs Modern Infrastructure Market Value Share Brochure PDF. This layout presents information on Cloud Market Share, Market Value Share, Growth. It is also available for immediate download and adjustment. So, changes can be made in the color, design, graphics or any other component to create a unique layout.

Employee Risk Key Performance Indicator Dashboard With Case Incident Rate Ppt Professional Information PDF
The following slide highlights the employee safety key performance indicator dashboard with case incident rate illustrating total case occurrence rate, last reported case, days without reported, causing items, corrective actions, incident pyramid, incident by month and major causes. Pitch your topic with ease and precision using this Employee Risk Key Performance Indicator Dashboard With Case Incident Rate Ppt Professional Information PDF. This layout presents information on Total Case, Incident Rate, Last Incident Reported, Incident Causing Items. It is also available for immediate download and adjustment. So, changes can be made in the color, design, graphics or any other component to create a unique layout.
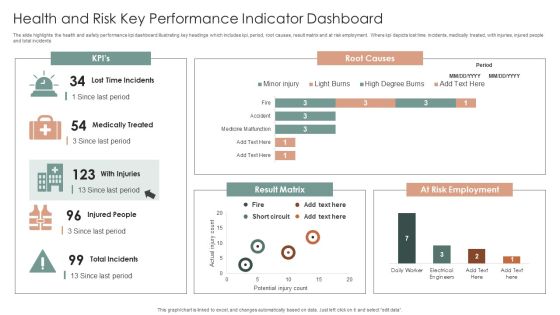
Health And Risk Key Performance Indicator Dashboard Ppt Layouts Graphics Design PDF
The slide highlights the health and safety performance kpi dashboard illustrating key headings which includes kpi, period, root causes, result matrix and at risk employment. Where kpi depicts lost time incidents, medically treated, with injuries, injured people and total incidents. Showcasing this set of slides titled Health And Risk Key Performance Indicator Dashboard Ppt Layouts Graphics Design PDF. The topics addressed in these templates are Root Causes, Result Matrix, At Risk Employment. All the content presented in this PPT design is completely editable. Download it and make adjustments in color, background, font etc. as per your unique business setting.

Health And Risk KPI Dashboard Ppt Pictures Designs Download PDF
The slide highlights the health and safety key performance indicator dashboard illustrating key headings which includes key objectives, inspections, total reports vs over due reports, injuries by body part and accident trends. Pitch your topic with ease and precision using this Health And Risk KPI Dashboard Ppt Pictures Designs Download PDF. This layout presents information on Key Objectives, Inspections, Accidents Trends. It is also available for immediate download and adjustment. So, changes can be made in the color, design, graphics or any other component to create a unique layout.

Patient Health And Risk Key Performance Indicator Dashboard Ppt Infographic Template Summary PDF
The following slide highlights the patient health and safety key performance indicator dashboard illustrating admission by department, admission by cost, patient satisfaction, total patients, operations cost, patient density, total staff, waiting time, treatment satisfaction and treatment confidence. Pitch your topic with ease and precision using this Patient Health And Risk Key Performance Indicator Dashboard Ppt Infographic Template Summary PDF. This layout presents information on Admission By Department, Admission Vs Cost, Patient Satisfaction. It is also available for immediate download and adjustment. So, changes can be made in the color, design, graphics or any other component to create a unique layout.

Improve IT Service Desk Service Desk Dashboard For Monitoring IT Infrastructure Introduction PDF
This slide illustrates service desk dashboard for monitoring information technology IT infrastructure. It provides information about issues, safety inspection, problem servers, workstations, operating system, Windows, Mac, Linux, etc.Deliver and pitch your topic in the best possible manner with this Improve IT Service Desk Service Desk Dashboard For Monitoring IT Infrastructure Introduction PDF. Use them to share invaluable insights on Problem Servers, Problem Workstations, Operating System and impress your audience. This template can be altered and modified as per your expectations. So, grab it now.

Improve IT Service Desk Statistics Highlighting Key Priorities Of Service Topics PDF
The following slide illustrates statistics showcasing major priorities of service desk professionals. It provides information about automation, inbound calls, emails, first time fix rate, self service portal, service desk costs, etc. Deliver and pitch your topic in the best possible manner with this Improve IT Service Desk Statistics Highlighting Key Priorities Of Service Topics PDF. Use them to share invaluable insights on Service Managers, Ticket Management, Increasing Time and impress your audience. This template can be altered and modified as per your expectations. So, grab it now.
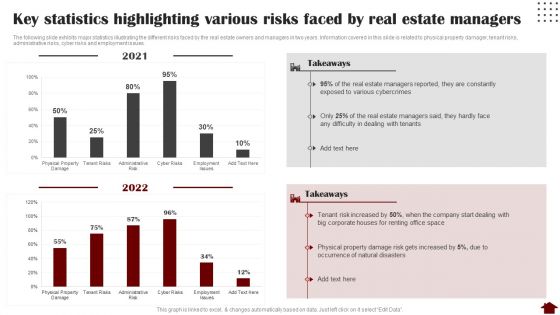
Key Statistics Highlighting Various Risks Faced By Real Estate Managers Mockup PDF
The following slide exhibits major statistics illustrating the different risks faced by the real estate owners and managers in two years. Information covered in this slide is related to physical property damager, tenant risks, administrative risks, cyber risks and employment issues. Deliver and pitch your topic in the best possible manner with this Key Statistics Highlighting Various Risks Faced By Real Estate Managers Mockup PDF. Use them to share invaluable insights on Key Statistics Highlighting, Various Risks, Real Estate Managers and impress your audience. This template can be altered and modified as per your expectations. So, grab it now.

Investment Project KPI Dashboard For Construction Analytics Background PDF
This slide illustrates construction dashboard for improving capital project outcomes. It also include KPIs such as projects completion, schedule performance index, consumer price index, project status, cost breakdown, etc. Pitch your topic with ease and precision using this Investment Project KPI Dashboard For Construction Analytics Background PDF. This layout presents information on Cost Breakdown, Completion, Progress. It is also available for immediate download and adjustment. So, changes can be made in the color, design, graphics or any other component to create a unique layout.

Key Program Kpis For Project Management Ppt Slides Graphic Images PDF
The following slide highlights the key program metrics for program management illustrating key headings which includes active program, total budget, budget utilized, budget utilization, total program, completed program, overdue program and completion status. Pitch your topic with ease and precision using this Key Program Kpis For Project Management Ppt Slides Graphic Images PDF. This layout presents information on Program Budget, Active Program, Total Budget. It is also available for immediate download and adjustment. So, changes can be made in the color, design, graphics or any other component to create a unique layout.
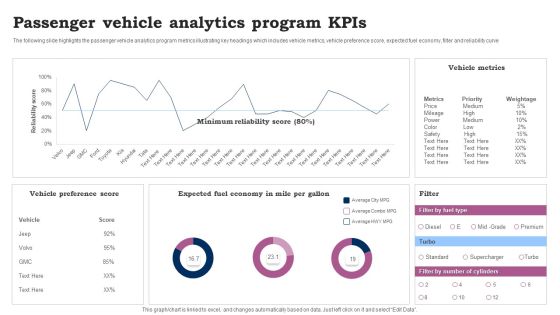
Passenger Vehicle Analytics Program Kpis Ppt Pictures Demonstration PDF
The following slide highlights the passenger vehicle analytics program metrics illustrating key headings which includes vehicle metrics, vehicle preference score, expected fuel economy, filter and reliability curve. Showcasing this set of slides titled Passenger Vehicle Analytics Program Kpis Ppt Pictures Demonstration PDF. The topics addressed in these templates are Vehicle Preference Score, Vehicle Metrics, Expected Fuel Economy. All the content presented in this PPT design is completely editable. Download it and make adjustments in color, background, font etc. as per your unique business setting.
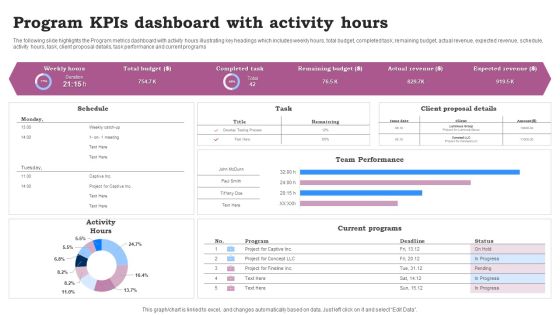
Program Kpis Dashboard With Activity Hours Ppt Infographics Clipart Images PDF
The following slide highlights the Program metrics dashboard with activity hours illustrating key headings which includes weekly hours, total budget, completed task, remaining budget, actual revenue, expected revenue, schedule, activity hours, task, client proposal details, task performance and current programs. Pitch your topic with ease and precision using this Program Kpis Dashboard With Activity Hours Ppt Infographics Clipart Images PDF. This layout presents information on Team Performance, Current Programs, Activity Hours. It is also available for immediate download and adjustment. So, changes can be made in the color, design, graphics or any other component to create a unique layout.
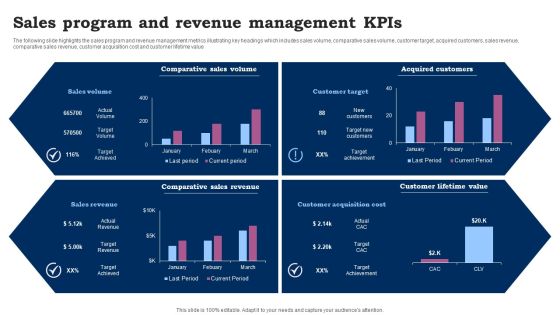
Sales Program And Revenue Management Kpis Ppt Outline Slide Download PDF
The following slide highlights the sales program and revenue management metrics illustrating key headings which includes sales volume, comparative sales volume, customer target, acquired customers, sales revenue, comparative sales revenue, customer acquisition cost and customer lifetime value. Showcasing this set of slides titled Sales Program And Revenue Management Kpis Ppt Outline Slide Download PDF. The topics addressed in these templates are Comparative Sales Volume, Acquired Customers, Comparative Sales Revenue. All the content presented in this PPT design is completely editable. Download it and make adjustments in color, background, font etc. as per your unique business setting.
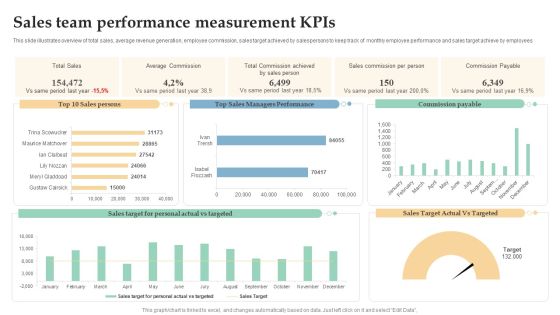
Sales Team Performance Measurement Kpis Ppt Professional Templates PDF
This slide illustrates overview of total sales, average revenue generation, employee commission, sales target achieved by salespersons to keep track of monthly employee performance and sales target achieve by employees. Showcasing this set of slides titled Sales Team Performance Measurement Kpis Ppt Professional Templates PDF. The topics addressed in these templates are Total Sales, Average Commission, Sales Commission, Per Person. All the content presented in this PPT design is completely editable. Download it and make adjustments in color, background, font etc. as per your unique business setting.

Key Statistics Highlighting Various Risks Faced By Real Managing Commercial Property Risks Elements PDF
The following slide exhibits major statistics illustrating the different risks faced by the real estate owners and managers in two years. Information covered in this slide is related to physical property damager, tenant risks, administrative risks, cyber risks and employment issues. Deliver and pitch your topic in the best possible manner with this Key Statistics Highlighting Various Risks Faced By Real Managing Commercial Property Risks Elements PDF. Use them to share invaluable insights on Various Cybercrimes, Estate Managers, Natural Disasters and impress your audience. This template can be altered and modified as per your expectations. So, grab it now.

Statistics Highlighting Call Center Business Success Measurement Introduction PDF
The following slide illustrates facts and figures for multiple success measures of service support teams. It provides information about customer effort score, CSAT customer satisfaction, NPS net promoter score, etc. Showcasing this set of slides titled Statistics Highlighting Call Center Business Success Measurement Introduction PDF. The topics addressed in these templates are BPO Managers, Customer Satisfaction Rate, Biggest Measure. All the content presented in this PPT design is completely editable. Download it and make adjustments in color, background, font etc. as per your unique business setting.
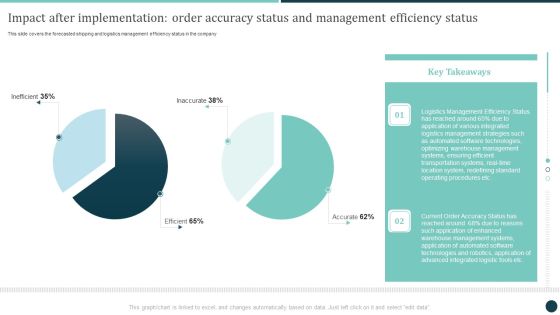
Impact After Implementation Order Accuracy Status And Management Efficiency Status Demonstration PDF
Slidegeeks is here to make your presentations a breeze with Impact After Implementation Order Accuracy Status And Management Efficiency Status Demonstration PDF With our easytouse and customizable templates, you can focus on delivering your ideas rather than worrying about formatting. With a variety of designs to choose from, youre sure to find one that suits your needs. And with animations and unique photos, illustrations, and fonts, you can make your presentation pop. So whether youre giving a sales pitch or presenting to the board, make sure to check out Slidegeeks first.

Business Overview Of Mid Term Earning Potential And Expectations Slides PDF
This slide illustrates business overview and profit potential of a corporation. It includes group revenue shares, business revenue, EBITDA, volume growth, profit growth and operating margins etc. Showcasing this set of slides titled Business Overview Of Mid Term Earning Potential And Expectations Slides PDF. The topics addressed in these templates are Value Growth, Profit Growth, Operating Margin. All the content presented in this PPT design is completely editable. Download it and make adjustments in color, background, font etc. as per your unique business setting.

Corporate Earning Potential With Key Drivers Summary PDF
This slide illustrates profit earnings of a corporation with expected profit in the current year. It includes yearly profit earned for five years and key drivers working behind that profit. Pitch your topic with ease and precision using this Corporate Earning Potential With Key Drivers Summary PDF. This layout presents information on Working Capital, Improved Profits, Capital. It is also available for immediate download and adjustment. So, changes can be made in the color, design, graphics or any other component to create a unique layout.

Dashboard Showing Earning Potential From Corporate Trends Demonstration PDF
This slide illustrates facts and figures related to five years of corporate financial figures for evaluation of expected profit. It includes yearly revenue and EBITDA, PAT and PAT margin, net worth and return on net worth etc. Showcasing this set of slides titled Dashboard Showing Earning Potential From Corporate Trends Demonstration PDF. The topics addressed in these templates are Potential From Corporate Trends, Dashboard Showing Earning. All the content presented in this PPT design is completely editable. Download it and make adjustments in color, background, font etc. as per your unique business setting.

Evaluation Of Earning Potential From Gross Earning And Ebit Dashboard Professional PDF
This slide illustrates finding profit potential of a corporation while studying gross profit margin and EBITDA. It includes key operating expenditure and gross profit margin, EBITDA dollar MM and EBITDA percent margin etc. Showcasing this set of slides titled Evaluation Of Earning Potential From Gross Earning And Ebit Dashboard Professional PDF. The topics addressed in these templates are Evaluation Of Earning Potential, Gross Earning, Ebit Dashboard. All the content presented in this PPT design is completely editable. Download it and make adjustments in color, background, font etc. as per your unique business setting.

International Business Revenue And Earning Potential Guidelines PDF
This slide illustrates finding profit potential from evaluation of international business done by the corporation. It includes international business revenue share percent, international business revenue in USD BB, share of group revenues etc. Pitch your topic with ease and precision using this International Business Revenue And Earning Potential Guidelines PDF. This layout presents information on Potential Organic Growth, Supply Chain. It is also available for immediate download and adjustment. So, changes can be made in the color, design, graphics or any other component to create a unique layout.
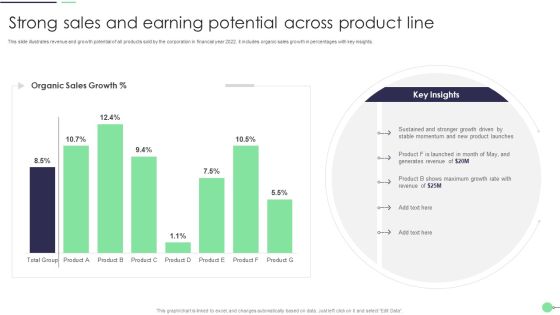
Strong Sales And Earning Potential Across Product Line Professional PDF
This slide illustrates revenue and growth potential of all products sold by the corporation in financial year 2022. it includes organic sales growth in percentages with key insights. Showcasing this set of slides titled Strong Sales And Earning Potential Across Product Line Professional PDF. The topics addressed in these templates are Product Launches, Generates Revenue, Growth Rate. All the content presented in this PPT design is completely editable. Download it and make adjustments in color, background, font etc. as per your unique business setting.

Sustained Sales Growth And Earning Potential During Covid 19 Pandemic Demonstration PDF
This slide illustrates sustained revenue and profit growth during consistent lockdowns in pandemic. It includes graphical representation of retail and out of home business with key insights etc. Pitch your topic with ease and precision using this Sustained Sales Growth And Earning Potential During Covid 19 Pandemic Demonstration PDF. This layout presents information on Revenue Growth, Business, Retail. It is also available for immediate download and adjustment. So, changes can be made in the color, design, graphics or any other component to create a unique layout.

Dashboard Highlighting Internal Hiring Sources And Costs Ppt Show Templates PDF
This slide illustrates dashboard for recruiting employees internally. It provides information about sourcing status, yield ratio, hiring pipeline, positions filled, recruitment costs, hire cost per team, etc. Showcasing this set of slides titled Dashboard Highlighting Internal Hiring Sources And Costs Ppt Show Templates PDF. The topics addressed in these templates are Hiring Pipeline, Sourcing Status, Recruitment Costs. All the content presented in this PPT design is completely editable. Download it and make adjustments in color, background, font etc. as per your unique business setting.

Creating New Product Launch Campaign Strategy Analyzing Sales Performance Over Last Three Years Structure PDF
Following slide illustrates sales performance highlights of the firm in FY18, FY19 and FY20. Category 4 is the most selling product category over the three years. If your project calls for a presentation, then Slidegeeks is your go to partner because we have professionally designed, easy to edit templates that are perfect for any presentation. After downloading, you can easily edit Creating New Product Launch Campaign Strategy Analyzing Sales Performance Over Last Three Years Structure PDF and make the changes accordingly. You can rearrange slides or fill them with different images. Check out all the handy templates.

Creating New Product Launch Campaign Strategy Dashboard To Measure Sales Rep Performance Introduction PDF
This slide illustrates sales representative performance measurement dashboard with key metrics such as average first contact resolution rate, occupancy rate, NPS and top agents by solved tickets. Make sure to capture your audiences attention in your business displays with our gratis customizable Creating New Product Launch Campaign Strategy Dashboard To Measure Sales Rep Performance Introduction PDF. These are great for business strategies, office conferences, capital raising or task suggestions. If you desire to acquire more customers for your tech business and ensure they stay satisfied, create your own sales presentation with these plain slides.
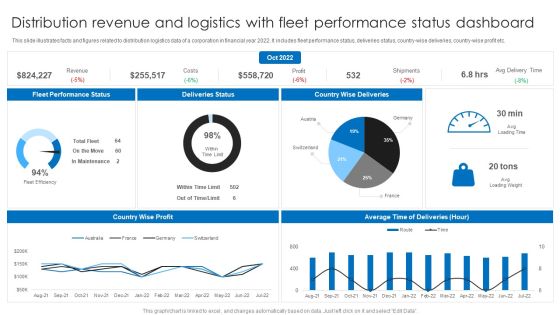
Distribution Revenue And Logistics With Fleet Performance Status Dashboard Ppt Layouts Background PDF
This slide illustrates facts and figures related to distribution logistics data of a corporation in financial year 2022. It includes fleet performance status, deliveries status, country-wise deliveries, country-wise profit etc. Pitch your topic with ease and precision using this Distribution Revenue And Logistics With Fleet Performance Status Dashboard Ppt Layouts Background PDF. This layout presents information on Deliveries Status, Country Wise Deliveries, Fleet Performance Status. It is also available for immediate download and adjustment. So, changes can be made in the color, design, graphics or any other component to create a unique layout.

Brand Value Measuring KPI Dashboard Guide To Understand Evaluate And Enhance Brand Value Slides PDF
Following slide illustrates KPI dashboard to measure brand value. KPIs covered are brand value and percentage change, brand value over time, most followed brands on social media.Take your projects to the next level with our ultimate collection of Brand Value Measuring KPI Dashboard Guide To Understand Evaluate And Enhance Brand Value Slides PDF. Slidegeeks has designed a range of layouts that are perfect for representing task or activity duration, keeping track of all your deadlines at a glance. Tailor these designs to your exact needs and give them a truly corporate look with your own brand colors they all make your projects stand out from the rest

30 60 90 Days Sales And Promotion Planning With Performance Analysis Guidelines PDF
The following slide illustrates the step by step sales and marketing plan to attain the business objectives. It also includes the sales performance evaluation by target achieved in the past 30 60 90 days. Showcasing this set of slides titled 30 60 90 Days Sales And Promotion Planning With Performance Analysis Guidelines PDF. The topics addressed in these templates are 30 60 90 Days, Sales Promotion Planning, Performance Analysis. All the content presented in this PPT design is completely editable. Download it and make adjustments in color, background, font etc. as per your unique business setting.
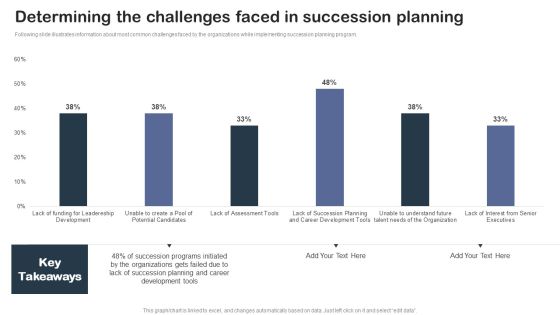
Staff Succession Planning And Development Determining The Challenges Faced Introduction PDF
Following slide illustrates information about most common challenges faced by the organizations while implementing succession planning program.Present like a pro with Staff Succession Planning And Development Determining The Challenges Faced Introduction PDF Create beautiful presentations together with your team, using our easy-to-use presentation slides. Share your ideas in real-time and make changes on the fly by downloading our templates. So whether you are in the office, on the go, or in a remote location, you can stay in sync with your team and present your ideas with confidence. With Slidegeeks presentation got a whole lot easier. Grab these presentations today.

Buy Side Advisory Services In M And A Mergers And Acquisitions By Sector Introduction PDF
The slide illustrates the graph of number of merger and acquisition deals by sector that the company has completed in last five years. It also covers key facts CAGR growth, deal value etc. related to merger and acquisition deals of the company.There are so many reasons you need a Buy Side Advisory Services In M And A Mergers And Acquisitions By Sector Introduction PDF. The first reason is you can not spend time making everything from scratch, Thus, Slidegeeks has made presentation templates for you too. You can easily download these templates from our website easily.
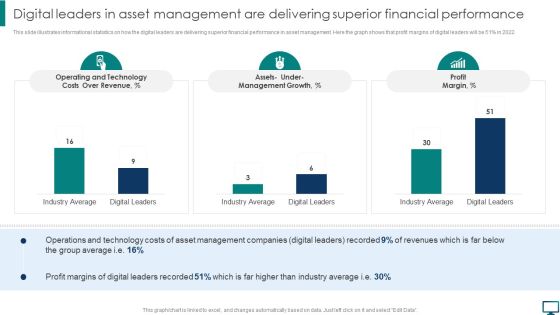
Digital Leaders In Asset Management Are Delivering Superior Financial Performance Topics PDF
This slide illustrates informational statistics on how the digital leaders are delivering superior financial performance in asset management. Here the graph shows that profit margins of digital leaders will be 51 percent in 2022. Take your projects to the next level with our ultimate collection of Digital Leaders In Asset Management Are Delivering Superior Financial Performance Topics PDF. Slidegeeks has designed a range of layouts that are perfect for representing task or activity duration, keeping track of all your deadlines at a glance. Tailor these designs to your exact needs and give them a truly corporate look with your own brand colors they will make your projects stand out from the rest.

Data Augmentation Dashboard For Lead Generation Ppt Pictures Deck PDF
This slide illustrates a data enrichment dashboard that helps shorten the customer journey for lead generation. It also includes KPIs such as leads enriched against target, lead stage, user, and lead created by user. Showcasing this set of slides titled Data Augmentation Dashboard For Lead Generation Ppt Pictures Deck PDF. The topics addressed in these templates are Leads Enriched against, Target, Leads Enriched, Lead Stage, Leads Created User, Leads Enriched User. All the content presented in this PPT design is completely editable. Download it and make adjustments in color, background, font etc. as per your unique business setting.

Cost And Schedule Variance Analysis In Earned Value Management Ppt Pictures Design Ideas PDF
This slide represents cost and schedule variance analysis in earned value management illustrating planned value, earned value, actual cost etc used for indicating cost performance index. Showcasing this set of slides titled Cost And Schedule Variance Analysis In Earned Value Management Ppt Pictures Design Ideas PDF. The topics addressed in these templates are CPI Indicates, Financial Effectiveness, Efficiency Project. All the content presented in this PPT design is completely editable. Download it and make adjustments in color, background, font etc. as per your unique business setting.

Business Threats Landscape Dashboard With Cyber Attacks Analysis Ppt Summary Brochure PDF
This slide illustrates risk landscape dashboard with cyber attacks analysis which contains malware attack frequency, country wise attacks, top 10 attacks, etc. It can assist IT managers in analyzing top threats so that they can be dealt with proper efficiency. Pitch your topic with ease and precision using this Business Threats Landscape Dashboard With Cyber Attacks Analysis Ppt Summary Brochure PDF. This layout presents information on Malware Attack Frequency, Every Minute, Every Second. It is also available for immediate download and adjustment. So, changes can be made in the color, design, graphics or any other component to create a unique layout.

Statistics Depicting Risk Magnitude In Business Threats Landscape Ppt File Example Introduction PDF
This slide illustrates statistics which highlight magnitude of threats faced by various business units in a risk landscape. It entails information about cybersecurity, data privacy, digital innovation, cloud computing, transformational projects, mergers and acquisition and regulatory environment. Pitch your topic with ease and precision using this Statistics Depicting Risk Magnitude In Business Threats Landscape Ppt File Example Introduction PDF. This layout presents information on Business Units, Risk Magnitude, Business Landscape. It is also available for immediate download and adjustment. So, changes can be made in the color, design, graphics or any other component to create a unique layout.
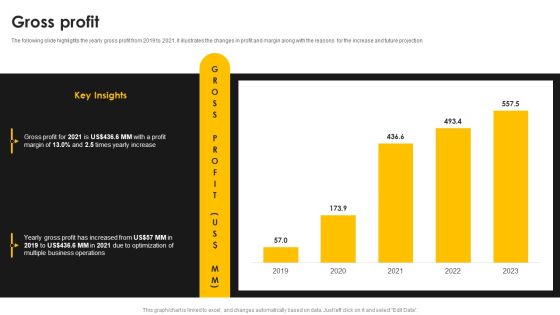
Kantar Consulting Company Outline Gross Profit Template PDF
The following slide highlights the yearly gross profit from 2019 to 2021. it illustrates the changes in profit and margin along with the reasons for the increase and future projection. Take your projects to the next level with our ultimate collection of Kantar Consulting Company Outline Gross Profit Template PDF. Slidegeeks has designed a range of layouts that are perfect for representing task or activity duration, keeping track of all your deadlines at a glance. Tailor these designs to your exact needs and give them a truly corporate look with your own brand colors they will make your projects stand out from the rest.

Cloud Computing Project Administration Dashboard With Change Requests Ppt Layouts Background Images PDF
Mentioned slide illustrates a comprehensive cloud project management. It covers various metrics such as planned and actual spending, risk count, issues count, change requests, overall project progress, etc. Showcasing this set of slides titled Cloud Computing Project Administration Dashboard With Change Requests Ppt Layouts Background Images PDF. The topics addressed in these templates are Project Financials, Project Spend, Project Progress. All the content presented in this PPT design is completely editable. Download it and make adjustments in color, background, font etc. as per your unique business setting.

Dashboard Of Product Sales Growth And Gross Analysis Analysis Ppt Styles Good PDF
The following slide highlights the dashboard o product sales growth and gross margin analysis illustrating key headings which includes sales by product, sales by month, sales product by margin, sales product by quantity, gross margin growth, gross margin trend and product inventory. Showcasing this set of slides titled Dashboard Of Product Sales Growth And Gross Analysis Analysis Ppt Styles Good PDF. The topics addressed in these templates are Gross Margin Growth, Gross Margin Trend, Product Inventory. All the content presented in this PPT design is completely editable. Download it and make adjustments in color, background, font etc. as per your unique business setting.
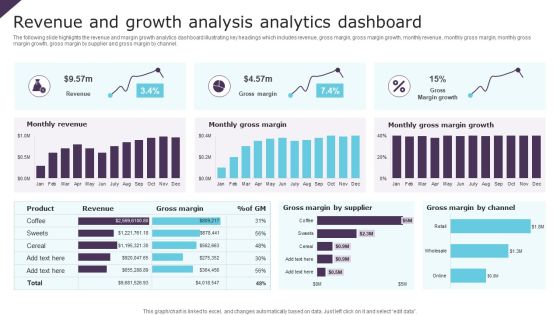
Revenue And Growth Analysis Analytics Dashboard Ppt Infographic Template Brochure PDF
The following slide highlights the revenue and margin growth analytics dashboard illustrating key headings which includes revenue, gross margin, gross margin growth, monthly revenue, monthly gross margin, monthly gross margin growth, gross margin by supplier and gross margin by channel. Pitch your topic with ease and precision using this Revenue And Growth Analysis Analytics Dashboard Ppt Infographic Template Brochure PDF. This layout presents information on Monthly Revenue, Monthly Gross Margin, Gross Margin Growth. It is also available for immediate download and adjustment. So, changes can be made in the color, design, graphics or any other component to create a unique layout.

Sales Revenue And Gross Growth Analysis Dashboard Ppt Inspiration Background Image PDF
The following slide highlights the sales revenue and gross margin growth dashboard illustrating key headings which includes gross margin, total revenue, total client, total product, gross margin trend, gross margin growth, monthly gross margin, monthly revenue, yearly revenue growth and gross margin growth trend by product. Showcasing this set of slides titled Sales Revenue And Gross Growth Analysis Dashboard Ppt Inspiration Background Image PDF. The topics addressed in these templates are Gross Margin, Total Revenue, Total Clients. All the content presented in this PPT design is completely editable. Download it and make adjustments in color, background, font etc. as per your unique business setting.
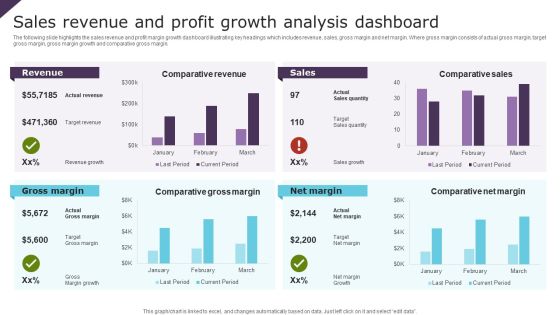
Sales Revenue And Profit Growth Analysis Dashboard Ppt Portfolio Slide PDF
The following slide highlights the sales revenue and profit margin growth dashboard illustrating key headings which includes revenue, sales, gross margin and net margin. Where gross margin consists of actual gross margin, target gross margin, gross margin growth and comparative gross margin. Showcasing this set of slides titled Sales Revenue And Profit Growth Analysis Dashboard Ppt Portfolio Slide PDF. The topics addressed in these templates are Revenue, Sales, Gross Margin, Net Margin. All the content presented in this PPT design is completely editable. Download it and make adjustments in color, background, font etc. as per your unique business setting.
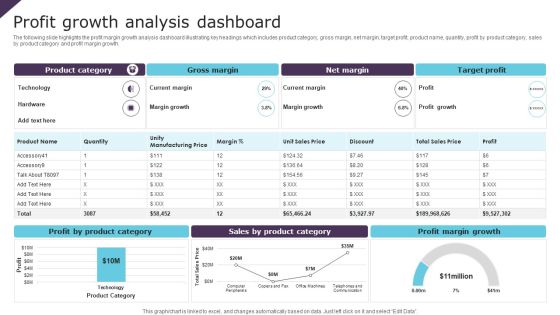
Profit Growth Analysis Dashboard Ppt PowerPoint Presentation File Design Templates PDF
The following slide highlights the profit margin growth analysis dashboard illustrating key headings which includes product category, gross margin, net margin, target profit, product name, quantity, profit by product category, sales by product category and profit margin growth. Showcasing this set of slides titled Profit Growth Analysis Dashboard Ppt PowerPoint Presentation File Design Templates PDF. The topics addressed in these templates are Gross Margin, Net Margin, Target Profit. All the content presented in this PPT design is completely editable. Download it and make adjustments in color, background, font etc. as per your unique business setting.

Customer NPS Metric Statistics Of Banking Industry Ppt Styles Microsoft PDF
This slide illustrates statistics of net promoter score NPS in banking industry. It provides information about summary, personal banking, business banking and wealth management. Pitch your topic with ease and precision using this Customer NPS Metric Statistics Of Banking Industry Ppt Styles Microsoft PDF. This layout presents information on Summary, Personal Banking, Business Banking, Wealth Management. It is also available for immediate download and adjustment. So, changes can be made in the color, design, graphics or any other component to create a unique layout.

Sales Performance Monitoring Dashboard With Revenue And Cost Metric Ppt Portfolio Good PDF
This slide illustrates sales revenue and costs tracking dashboard. It provides information about sales count, profit, expenses, sales revenue, expenses breakdown, up or cross selling, etc. Showcasing this set of slides titled Sales Performance Monitoring Dashboard With Revenue And Cost Metric Ppt Portfolio Good PDF. The topics addressed in these templates are Sales Count, Revenue, Profit, Expenses. All the content presented in this PPT design is completely editable. Download it and make adjustments in color, background, font etc. as per your unique business setting.

Key Business Metrics Dashboard Company Process Administration And Optimization Playbook Infographics PDF
The following dashboard displays the key business metrics such as new customers, profit, revenue per customer, and weekly revenue. Slidegeeks is here to make your presentations a breeze with Key Business Metrics Dashboard Company Process Administration And Optimization Playbook Infographics PDF With our easy-to-use and customizable templates, you can focus on delivering your ideas rather than worrying about formatting. With a variety of designs to choose from, you are sure to find one that suits your needs. And with animations and unique photos, illustrations, and fonts, you can make your presentation pop. So whether you are giving a sales pitch or presenting to the board, make sure to check out Slidegeeks first.
