Testing Icon

Various Statistics Showing Results Of Customer Brand Loyalty Program Background PDF
The purpose of this slide is to showcase major statistics illustrating the customer loyalty program results. The key statistics covered in the slide are extent of consumers loyalty to different brand, customers response to new brands and the various factors for brand loyalty. Pitch your topic with ease and precision using this various statistics showing results of customer brand loyalty program background pdf. This layout presents information on extent of customer loyalty to brands, customers responsiveness to new brands, brand loyalty matters. It is also available for immediate download and adjustment. So, changes can be made in the color, design, graphics or any other component to create a unique layout.
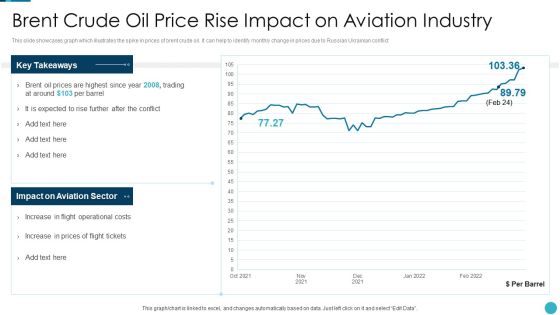
Russia Ukraine War Influence On Airline Sector Brent Crude Oil Price Rise Impact Ideas PDF
This slide showcases graph which illustrates the spike in prices of brent crude oil. It can help to identify monthly change in prices due to Russian Ukrainian conflict Deliver an awe inspiring pitch with this creative russia ukraine war influence on airline sector brent crude oil price rise impact ideas pdf bundle. Topics like brent crude oil price rise impact on aviation industry can be discussed with this completely editable template. It is available for immediate download depending on the needs and requirements of the user.
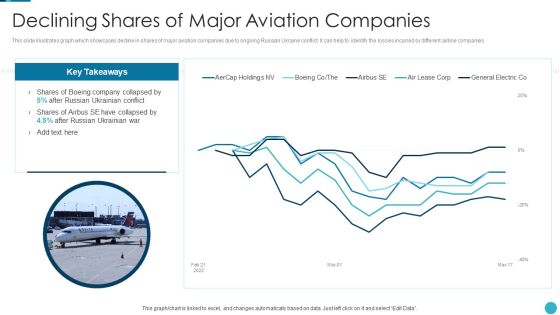
Russia Ukraine War Influence On Airline Sector Declining Shares Of Major Aviation Companies Guidelines PDF
This slide illustrates graph which showcases decline in shares of major aviation companies due to ongoing Russian Ukraine conflict. It can help to identify the losses incurred by different airline companies Deliver an awe inspiring pitch with this creative russia ukraine war influence on airline sector declining shares of major aviation companies guidelines pdf bundle. Topics like declining shares of major aviation companies can be discussed with this completely editable template. It is available for immediate download depending on the needs and requirements of the user.

Russia Ukraine War Influence On Airline Sector Delay And Cancellation Of Aircraft Deliveries Background PDF
This Slide showcases graphs which compares the aircraft orders booked and delivered to customers. It illustrates delay and cancellation of aircraft deliveries resulting in financial loss for aviation companies Deliver and pitch your topic in the best possible manner with this russia ukraine war influence on airline sector delay and cancellation of aircraft deliveries background pdf Use them to share invaluable insights on delay and cancellation of aircraft deliveries and impress your audience. This template can be altered and modified as per your expectations. So, grab it now.

Russia Ukraine War Influence On Airline Sector Gas Price Rise Impact On Aviation Industry Infographics PDF
This slide showcases graph which illustrates spike in prices of gas. It can help to identify monthly change in gas prices of countries like European union, united kingdom and united states of America Deliver and pitch your topic in the best possible manner with this russia ukraine war influence on airline sector gas price rise impact on aviation industry infographics pdf Use them to share invaluable insights on gas price rise impact on aviation industry and impress your audience. This template can be altered and modified as per your expectations. So, grab it now.
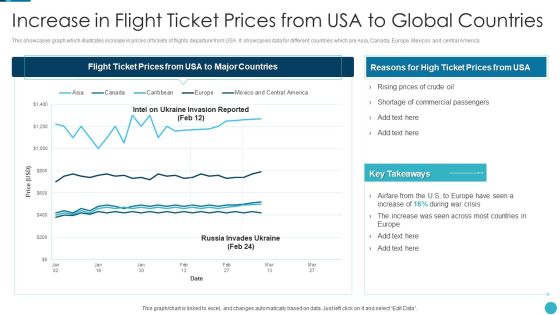
Russia Ukraine War Influence On Airline Sector Increase In Flight Ticket Prices From USA Pictures PDF
This showcases graph which illustrates increase in prices of tickets of flights departure from USA. It showcases data for different countries which are Asia, Canada, Europe, Mexicoo and central America Deliver an awe inspiring pitch with this creative russia ukraine war influence on airline sector increase in flight ticket prices from usa pictures pdf bundle. Topics like increase in flight ticket prices from usa to global countries can be discussed with this completely editable template. It is available for immediate download depending on the needs and requirements of the user.

Russia Ukraine War Influence On Airline Sector Jet Fuel Price Rise Impact On Aviation Industry Ideas PDF
This slide showcases graph which illustrates increase in prices of jet fuel after Russian Ukraine conflict. It can help to compare the fuel prices before and after the invasion Deliver and pitch your topic in the best possible manner with this russia ukraine war influence on airline sector jet fuel price rise impact on aviation industry ideas pdf Use them to share invaluable insights on jet fuel price rise impact on aviation industry and impress your audience. This template can be altered and modified as per your expectations. So, grab it now.

Russia Ukraine War Influence On Airline Sector Revenue Generated By Airline Companies Guidelines PDF
This slide showcases graph which illustrates revenue generated by full service and low cost airline companies before Russian Ukraine conflict escalation. It showcases data for a period of last 5 financial years Deliver an awe inspiring pitch with this creative russia ukraine war influence on airline sector revenue generated by airline companies guidelines pdf bundle. Topics like revenue generated by airline companies can be discussed with this completely editable template. It is available for immediate download depending on the needs and requirements of the user.
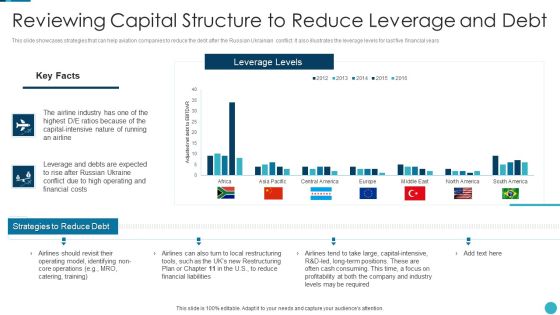
Russia Ukraine War Influence On Airline Sector Reviewing Capital Structure To Reduce Leverage Pictures PDF
This slide showcases strategies that can help aviation companies to reduce the debt after the Russian Ukrainian conflict. It also illustrates the leverage levels for last five financial years Deliver and pitch your topic in the best possible manner with this russia ukraine war influence on airline sector reviewing capital structure to reduce leverage pictures pdf Use them to share invaluable insights on strategies to reduce debt, leverage levels, restructuring tools and impress your audience. This template can be altered and modified as per your expectations. So, grab it now.
Guide For Software Developers KPI Dashboard For Tracking Project Team Performance Guidelines PDF
Following slide illustrates performance monitoring dashboard that can be used by managers to track their developers team efficiency. It also includes details about billable and non-billable hours along with task summary. Deliver an awe inspiring pitch with this creative guide for software developers kpi dashboard for tracking project team performance guidelines pdf bundle. Topics like task milestone, employee productivity, estimated time, actual time can be discussed with this completely editable template. It is available for immediate download depending on the needs and requirements of the user.
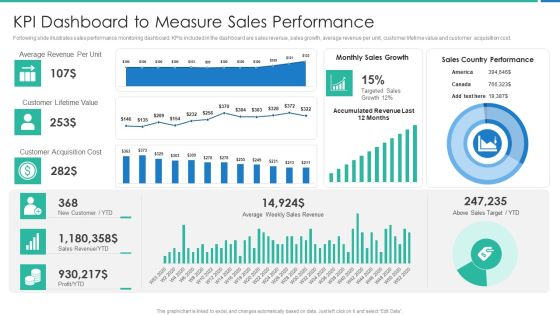
Strong Business Partnership To Ensure Company Success KPI Dashboard To Measure Sales Performance Slides PDF
Following slide illustrates sales performance monitoring dashboard. KPIs included in the dashboard are sales revenue, sales growth, average revenue per unit, customer lifetime value and customer acquisition cost.Deliver and pitch your topic in the best possible manner with this strong business partnership to ensure company success kpi dashboard to measure sales performance slides pdf Use them to share invaluable insights on kpi dashboard to measure sales performance and impress your audience. This template can be altered and modified as per your expectations. So, grab it now.
Software Developer Playbook Kpi Dashboard For Tracking Project Team Performance Guidelines PDF
Following slide illustrates performance monitoring dashboard that can be used by managers to track their developers team efficiency. It also includes details about billable and non-billable hours along with task summary. Deliver an awe inspiring pitch with this creative software developer playbook kpi dashboard for tracking project team performance guidelines pdf bundle. Topics like task milestone, employee productivity, estimated time, actual time can be discussed with this completely editable template. It is available for immediate download depending on the needs and requirements of the user.
Playbook For Application Developers KPI Dashboard For Tracking Project Team Performance Slides PDF
Following slide illustrates performance monitoring dashboard that can be used by managers to track their developers team efficiency. It also includes details about billable and non billable hours along with task summary.Deliver an awe inspiring pitch with this creative playbook for application developers kpi dashboard for tracking project team performance slides pdf bundle. Topics like kpi dashboard for tracking project team performance can be discussed with this completely editable template. It is available for immediate download depending on the needs and requirements of the user.
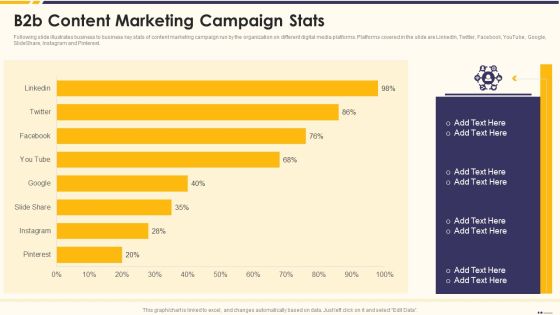
Promotion Standard Practices Tools And Templates B2b Content Marketing Campaign Stats Rules PDF
Following slide illustrates business to business key stats of content marketing campaign run by the organization on different digital media platforms. Platforms covered in the slide are LinkedIn, Twitter, Facebook, YouTube, Google, SlideShare, Instagram and Pinterest. Deliver and pitch your topic in the best possible manner with this promotion standard practices tools and templates b2b content marketing campaign stats rules pdf Use them to share invaluable insights on b2b content marketing campaign stats and impress your audience. This template can be altered and modified as per your expectations. So, grab it now.

Russia Ukraine Statistics Showing Major Cryptocurrency Performance During Russia Ukraine Conflict Summary PDF
The purpose of this slide is to exhibit key statistics illustrating the top cryptocurrency performance during the Russia-Ukraine crisis. Bitcoin, Ether, Ripple and Biance Coin are some of the major cryptocurrency which are highlighted in this slide. Deliver and pitch your topic in the best possible manner with this russia ukraine statistics showing major cryptocurrency performance during russia ukraine conflict summary pdf. Use them to share invaluable insights on invasion could occur anytime, russia invades ukraine and impress your audience. This template can be altered and modified as per your expectations. So, grab it now.

Project Management Professional Guide IT Old Vs New Blueprint Of PMP Certification Exam Graphics PDF
Following slide illustrates information on the old versus new blueprint of PMP certification exam. Here the slide shows that there is a shift towards predictive and agile approaches.Deliver an awe inspiring pitch with this creative project management professional guide it old vs new blueprint of pmp certification exam graphics pdf bundle. Topics like old vs new blueprint of pmp certification exam can be discussed with this completely editable template. It is available for immediate download depending on the needs and requirements of the user.

Customer Technical Assistant Engineer Dashboard With Voice Chat Status Slides PDF
This slide illustrates voice chat customer support engineer dashboard. It provides information such as chat volume, chat in queue, online status, net promoter score rate, etc. Showcasing this set of slides titled Customer Technical Assistant Engineer Dashboard With Voice Chat Status Slides PDF. The topics addressed in these templates are Customer Technical Assistant Engineer Dashboard With Voice Chat Status. All the content presented in this PPT design is completely editable. Download it and make adjustments in color, background, font etc. as per your unique business setting.

Revenue Performance And Risk Metrics Dashboard Demonstration PDF
This slide illustrates graphical representation of risk key performance indicators. It includes revenue performance of business units with their risk expenditure and people KRIs like employee job satisfaction, customer satisfaction etc. Showcasing this set of slides titled Revenue Performance And Risk Metrics Dashboard Demonstration PDF. The topics addressed in these templates are Total Risk Expenditure, Risk Management, Revenue Performance . All the content presented in this PPT design is completely editable. Download it and make adjustments in color, background, font etc. as per your unique business setting.
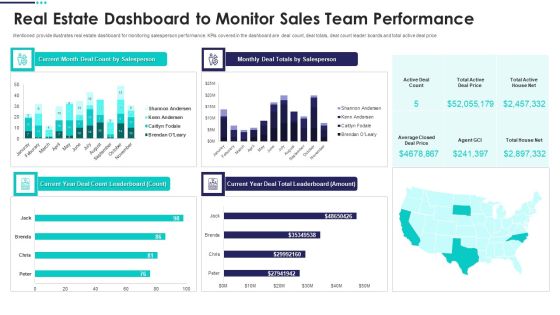
Real Estate Marketing Plan To Sell Real Estate Dashboard To Monitor Sales Team Demonstration PDF
Mentioned provide illustrates real estate dashboard for monitoring salesperson performance. KPIs covered in the dashboard are deal count, deal totals, deal count leader boards and total active deal price Deliver an awe inspiring pitch with this creative Real Estate Marketing Plan To Sell Real Estate Dashboard To Monitor Sales Team Demonstration PDF bundle. Topics like Real Estate Dashboard To Monitor Sales Team Performance can be discussed with this completely editable template. It is available for immediate download depending on the needs and requirements of the user.

Statistics Indicating Future Demand For Digital Insurance Technologies Brochure PDF
This slide illustrates data indicating future demand for insurtech digital technology. It provides information about data analytics, cloud technology, internal blockchain application, artificial intelligence, etc. Pitch your topic with ease and precision using this Statistics Indicating Future Demand For Digital Insurance Technologies Brochure PDF. This layout presents information on Data Analytics, Cloud Technology, Internal Blockchain Application. It is also available for immediate download and adjustment. So, changes can be made in the color, design, graphics or any other component to create a unique layout.

Cloud Platform Migration With Business Workload Forecast Introduction PDF Structure PDF
The following slide illustrates the forecasts of cloud platform migration usage in allocating multiple business workloads. It includes information about on premises, public, private and hybrid cloud platforms along with workload allocation projections. This can assist businesses in choosing most efficient system for doing operations.Showcasing this set of slides titled Cloud Platform Migration With Business Workload Forecast Introduction PDF Structure PDF. The topics addressed in these templates are Cloud Platform Migration With Business Workload Forecast. All the content presented in this PPT design is completely editable. Download it and make adjustments in color, background, font etc. as per your unique business setting.
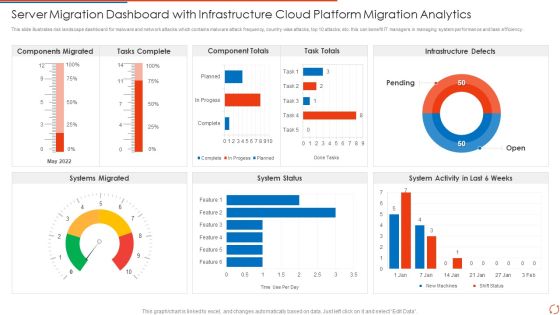
Server Migration Dashboard With Infrastructure Cloud Platform Migration Analytics Elements PDF Portrait PDF
This slide illustrates risk landscape dashboard for malware and network attacks which contains malware attack frequency, country wise attacks, top 10 attacks, etc. this can benefit IT managers in managing system performance and task efficiency Pitch your topic with ease and precision using this Server Migration Dashboard With Infrastructure Cloud Platform Migration Analytics Elements PDF Portrait PDF. This layout presents information on Tasks Complete, Component Totals, Task Totals. It is also available for immediate download and adjustment. So, changes can be made in the color, design, graphics or any other component to create a unique layout.

Top Reasons For Migration From On Premises Cloud Platform Migration To Cloud Introduction PDF Download PDF
This slide illustrates ideal reasons for migrating on premises platform to cloud which contains efficient cost, functionality and secured process. This can help organizations in previewing other companys perspective and have clear idea about the benefits of cloud platform.Showcasing this set of slides titled Top Reasons For Migration From On Premises Cloud Platform Migration To Cloud Introduction PDF Download PDF The topics addressed in these templates are Cost, Service Deliverables, Market. All the content presented in this PPT design is completely editable. Download it and make adjustments in color, background, font etc. as per your unique business setting.

Brand Revenue Comparative Analysis With Net Promoter Score Dashboard Mockup PDF
This slide illustrates graphical representation of revenue of three brands. It includes weekly revenue line graphs and net promoter score by age of customers.Pitch your topic with ease and precision using this Brand Revenue Comparative Analysis With Net Promoter Score Dashboard Mockup PDF. This layout presents information on Brand Revenue Comparative Analysis With Net Promoter Score Dashboard. It is also available for immediate download and adjustment. So, changes can be made in the color, design, graphics or any other component to create a unique layout.

Go To Market Approach For New Product Dashboard To Measure Sales Rep Performance Formats PDF
This slide illustrates sales representative performance measurement dashboard with key metrics such as average first contact resolution rate, occupancy rate, NPS and top agents by solved tickets.Deliver and pitch your topic in the best possible manner with this Go To Market Approach For New Product Dashboard To Measure Sales Rep Performance Formats PDF Use them to share invaluable insights on Dashboard To Measure Sales Rep Performance and impress your audience. This template can be altered and modified as per your expectations. So, grab it now.
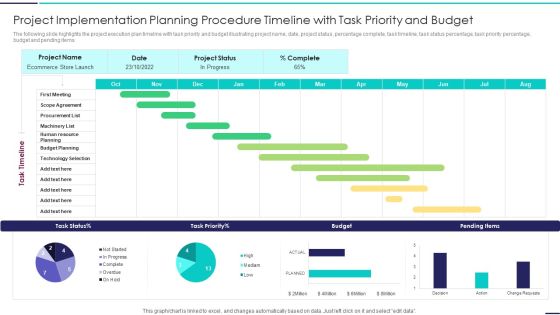
Project Implementation Planning Procedure Timeline With Task Priority And Budget Guidelines PDF
The following slide highlights the project execution plan timeline with task priority and budget illustrating project name, date, project status, percentage complete, task timeline, task status percentage, task priority percentage, budget and pending items. Showcasing this set of slides titled Project Implementation Planning Procedure Timeline With Task Priority And Budget Guidelines PDF. The topics addressed in these templates are Project Implementation Planning Procedure Timeline With Task Priority And Budget. All the content presented in this PPT design is completely editable. Download it and make adjustments in color, background, font etc. as per your unique business setting.
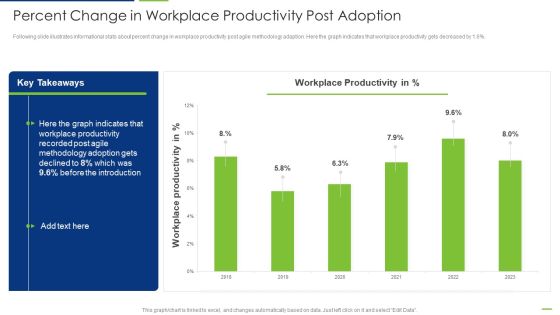
Professional Scrum Master Percent Change In Workplace Productivity Post Adoption Summary PDF
Following slide illustrates informational stats about percent change in workplace productivity post agile methodology adaption. Here the graph indicates that workplace productivity gets decreased by 1.6 percent. Deliver and pitch your topic in the best possible manner with this Professional Scrum Master Percent Change In Workplace Productivity Post Adoption Summary PDF. Use them to share invaluable insights on Workplace Productivity, 2018 To 2023, Agile Methodology and impress your audience. This template can be altered and modified as per your expectations. So, grab it now.

Vendor Scan And Ranking For BI Software BI Transformation Toolset Guidelines PDF
The following slide illustrates the results of the market scan performed to identify key vendors of business intelligence suite. It also contains information regarding vendor scoring and the unique selling proposition. Deliver and pitch your topic in the best possible manner with this Vendor Scan And Ranking For BI Software BI Transformation Toolset Guidelines PDF. Use them to share invaluable insights on Vendor Scan And Ranking For BI Software and impress your audience. This template can be altered and modified as per your expectations. So, grab it now.

E Commerce Project Campaign Planning And Management Dashboard Structure PDF
The following slide highlights the ecommerce project campaign planning and management dashboard illustrating key headings which includes revenue, onsite behaviour, mobile revenue and average order value, revenue by channel, top performing campaigns, high bounce mobile devices and mobile vs site revenue Showcasing this set of slides titled E Commerce Project Campaign Planning And Management Dashboard Structure PDF. The topics addressed in these templates are E Commerce Project Campaign Planning And Management Dashboard. All the content presented in this PPT design is completely editable. Download it and make adjustments in color, background, font etc. as per your unique business setting.

E Commerce Project Plan Performance Management Dashboard Slides PDF
The following slide highlights the ecommerce project plan performance dashboard illustrating key headings which includes impressions, clicks, expense, impression and click rate by channel, impression and click rate by time and performance. Showcasing this set of slides titled E Commerce Project Plan Performance Management Dashboard Slides PDF. The topics addressed in these templates are E Commerce Project Plan Performance Management Dashboard. All the content presented in this PPT design is completely editable. Download it and make adjustments in color, background, font etc. as per your unique business setting.

E Commerce Project Planning And Revenue Management Dashboard Introduction PDF
The following slide highlights the ecommerce project planning and revenue management dashboard illustrating key headings which includes product and marketing channel plan, revenue and conversion rate by product, revenue by channel, conversion rate by channel and revenue by state. Showcasing this set of slides titled E Commerce Project Planning And Revenue Management Dashboard Introduction PDF. The topics addressed in these templates are New Customers, Ecommerce Revenue, Repeat Purchase Rate. All the content presented in this PPT design is completely editable. Download it and make adjustments in color, background, font etc. as per your unique business setting.
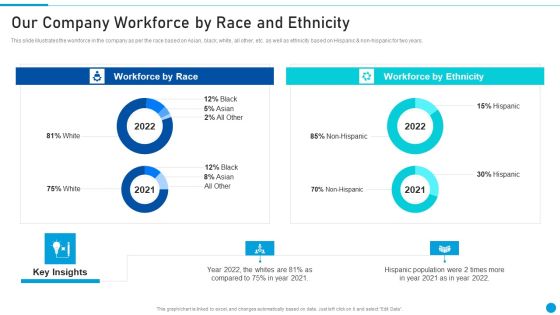
Embed Diversity And Inclusion Our Company Workforce By Race And Ethnicity Slides PDF
This slide illustrates the workforce in the company as per the race based on Asian, black, white, all other, etc. as well as ethnicity based on Hispanic and non-hispanic for two years. Deliver and pitch your topic in the best possible manner with this Embed Diversity And Inclusion Our Company Workforce By Race And Ethnicity Slides PDF. Use them to share invaluable insights on Workforce By Race, Workforce By Ethnicity and impress your audience. This template can be altered and modified as per your expectations. So, grab it now.

Survey Results Of Obstacles Faced By Team Members Due To Diverse Groups At Work Template PDF
This slide illustrates the survey results conducted within the company showing how the team members are getting affected due to diversity and inclusion at the company. Deliver and pitch your topic in the best possible manner with this Survey Results Of Obstacles Faced By Team Members Due To Diverse Groups At Work Template PDF. Use them to share invaluable insights on Racially, Ethically Diverse, Women, Lgbtq, Recruitment, Retention, Advancement, Leadership Commitment and impress your audience. This template can be altered and modified as per your expectations. So, grab it now.
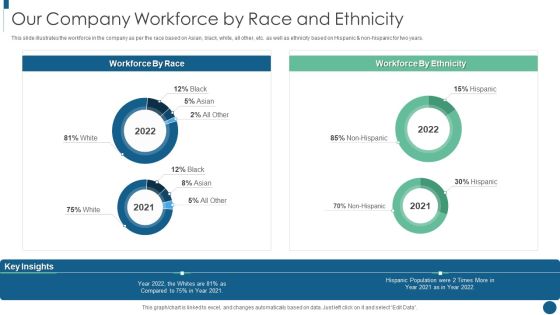
Developing Inclusive And Diversified Our Company Workforce By Race And Ethnicity Mockup PDF
This slide illustrates the workforce in the company as per the race based on Asian, black, white, all other, etc. as well as ethnicity based on Hispanic and non-hispanic for two years. Deliver and pitch your topic in the best possible manner with this Developing Inclusive And Diversified Our Company Workforce By Race And Ethnicity Mockup PDF. Use them to share invaluable insights on Workforce By Race, Workforce By Ethnicity and impress your audience. This template can be altered and modified as per your expectations. So, grab it now.

Data And Analytics Playbook How To Overcome Automated Discovery Of Insights Background PDF
This template illustrates that business needs is an intelligent analytics platform that can automatically discover valuable insights from the data. It also depicts that next-generation analytics platform acts as an analyst for the organizations. Deliver an awe inspiring pitch with this creative Data And Analytics Playbook How To Overcome Automated Discovery Of Insights Background PDF bundle. Topics like Estimated Time Savings, Automation Opportunities, Possible Deflections, Assignment Group can be discussed with this completely editable template. It is available for immediate download depending on the needs and requirements of the user.
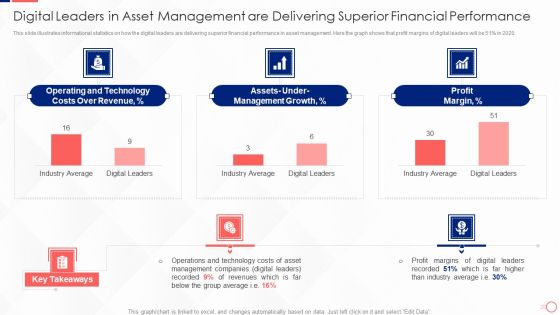
Digital Leaders In Asset Management Are Delivering Superior Financial Performance Structure PDF
This slide illustrates informational statistics on how the digital leaders are delivering superior financial performance in asset management. Here the graph shows that profit margins of digital leaders will be 51 percent in 2020. Deliver an awe inspiring pitch with this creative Digital Leaders In Asset Management Are Delivering Superior Financial Performance Structure PDF bundle. Topics like Operating And Technology, Management Growth, Profit Margin can be discussed with this completely editable template. It is available for immediate download depending on the needs and requirements of the user.

Investing In Tech Innovation Introducing Three Layers Of Distribution Technology Ideas PDF
Mentioned slide illustrates three layers model of distribution technology that firm will introduce within its business along with its impact. Layers covered are integrated data repository, client analysis engine and CX apps. Deliver an awe inspiring pitch with this creative Investing In Tech Innovation Introducing Three Layers Of Distribution Technology Ideas PDF bundle. Topics like Distribution Technology Layers, Integrated Data Repository, Client Analytics Engine can be discussed with this completely editable template. It is available for immediate download depending on the needs and requirements of the user.
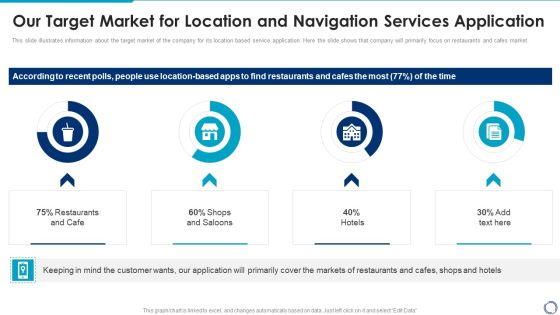
Our Target Market For Location And Navigation Services Application Topics PDF
This slide illustrates information about the target market of the company for its location based service application. Here the slide shows that company will primarily focus on restaurants and cafes market. Deliver an awe inspiring pitch with this creative Our Target Market For Location And Navigation Services Application Topics PDF bundle. Topics like Our Target Market, Location And Navigation, Services Application can be discussed with this completely editable template. It is available for immediate download depending on the needs and requirements of the user.

Corporate Digital Transformation Roadmap Market Scenario And Disruption In Business Infographics PDF
The following slide illustrates market scenario and business disruption for digital transformation industry. The slide displays the adoption rate of digital transformation, key issues in the Industry and solution for major problems Deliver an awe inspiring pitch with this creative Corporate Digital Transformation Roadmap Market Scenario And Disruption In Business Infographics PDF bundle. Topics like Organizations Dependent, Digital Products, Key Industries To Adopt Digital Transformation can be discussed with this completely editable template. It is available for immediate download depending on the needs and requirements of the user.

Capital Raising Pitch Presentation Our Target Market For LBS App Summary PDF
This slide illustrates information about the target market of the company for its location based service application. Here the slide shows that it will primarily focus on restaurants and cafes market. Deliver and pitch your topic in the best possible manner with this Capital Raising Pitch Presentation Our Target Market For LBS App Summary PDF. Use them to share invaluable insights on Restaurants And Cafe, Shops And Saloons, Hotels, Our Target Market, LBS App and impress your audience. This template can be altered and modified as per your expectations. So, grab it now.

Why Is Agile Cost Effective IT Projected Cost Of Project After Adopting Agile Inspiration PDF
Following slide illustrates forecasted statistics about project cost to be bear by the organization after adopting agile methodology. It also shows that technical debt will get decreased post agile adoption. Deliver an awe inspiring pitch with this creative Why Is Agile Cost Effective IT Projected Cost Of Project After Adopting Agile Inspiration PDF bundle. Topics like Project Cost, Technical Dept, Value Stream can be discussed with this completely editable template. It is available for immediate download depending on the needs and requirements of the user.

Maintaining Partner Relationships KPI Dashboard To Measure Sales Performance Rules PDF
Following slide illustrates sales performance monitoring dashboard. KPIs included in the dashboard are sales revenue, sales growth, average revenue per unit, customer lifetime value and customer acquisition cost. Deliver and pitch your topic in the best possible manner with this Maintaining Partner Relationships KPI Dashboard To Measure Sales Performance Rules PDF. Use them to share invaluable insights on Sales Country Performance, Above Sales Target, YTD, Customer Lifetime Value, Customer Acquisition Cost and impress your audience. This template can be altered and modified as per your expectations. So, grab it now.
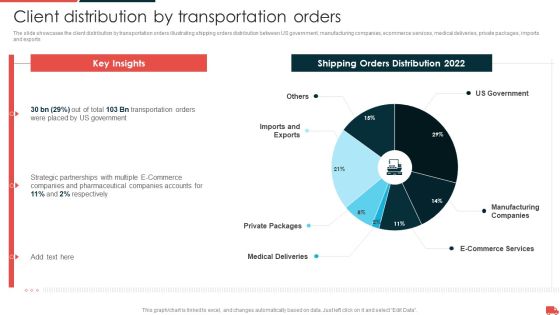
Transportation And Logistics Services Company Profile Client Distribution By Transportation Graphics PDF
The slide showcases the client distribution by transportation orders illustrating shipping orders distribution between US government, manufacturing companies, ecommerce services, medical deliveries, private packages, imports and exports. Deliver an awe inspiring pitch with this creative Transportation And Logistics Services Company Profile Client Distribution By Transportation Graphics PDF bundle. Topics like Key Insights, Shipping Orders Distribution 2022, Imports And Exports, E Commerce Services can be discussed with this completely editable template. It is available for immediate download depending on the needs and requirements of the user.

Transportation And Logistics Services Company Profile Orders Distribution By Services Category Topics PDF
The slide depicts the total orders distribution by services category illustrating percentage orders placed for each service including general freight, rail freight, sea freight, air freight, refrigerated freight and special services. Deliver and pitch your topic in the best possible manner with this Transportation And Logistics Services Company Profile Orders Distribution By Services Category Topics PDF. Use them to share invaluable insights on Road Transport, Special Services, General Freight, Refrigerated Freight, Rail Freight and impress your audience. This template can be altered and modified as per your expectations. So, grab it now.

Dashboard For Business To Business Market Division Inspiration PDF
This slide illustrates the market segmentation dashboard for B2B which can benefit them to improve the focus and boost the revenue of the organization. It includes the Division according to industries and company size. Showcasing this set of slides titled Dashboard For Business To Business Market Division Inspiration PDF. The topics addressed in these templates are Industries, Service, Automobiles. All the content presented in this PPT design is completely editable. Download it and make adjustments in color, background, font etc. as per your unique business setting.

Agile Techniques For Data Migration Performance Assessment Of It Projects Undertaken Slides PDF
Following slide illustrates performance assessment stats of IT projects undertaken and completed by the organization in FY22. It shows that organization was unable to deliver most of the projects on time. Deliver and pitch your topic in the best possible manner with this Agile Techniques For Data Migration Performance Assessment Of It Projects Undertaken Slides PDF. Use them to share invaluable insights on Workflow Management, Project Failure, Real Time Monitoring, Data Capture, Management And Analysis and impress your audience. This template can be altered and modified as per your expectations. So, grab it now.

Canned Food Company Profile Net Profit And Margin Information PDF
This slide illustrates a graph of net profit in USdollar and gross margin in percentage for food company. Additionally, it shows net profit of all business lines of the company food, beverage and dairy products Deliver and pitch your topic in the best possible manner with this Canned Food Company Profile Net Profit And Margin Information PDF Use them to share invaluable insights on Net Profit, Margin and impress your audience. This template can be altered and modified as per your expectations. So, grab it now.

Canned Food Company Profile Operating Profit And Margin Background PDF
This slide illustrates a graph of operating profit in USdollar and gross margin in percentage for food company. Additionally, it shows operating profit of all business lines of the company food, beverage and dairy products Deliver an awe inspiring pitch with this creative Canned Food Company Profile Operating Profit And Margin Background PDF bundle. Topics like Dairy Operating, Beverage Operating , Total Operating can be discussed with this completely editable template. It is available for immediate download depending on the needs and requirements of the user.

BCWP Analysis Report For Project Management Download PDF
The following slide highlights the earned value analysis report for project management illustrating comparative graph, summary and performances measures which are cost variance, schedule variance, cost performance index, schedule performance index. Showcasing this set of slides titled BCWP Analysis Report For Project Management Download PDF The topics addressed in these templates are Performance Measures, Project Budget, Earned Value All the content presented in this PPT design is completely editable. Download it and make adjustments in color, background, font etc. as per your unique business setting.
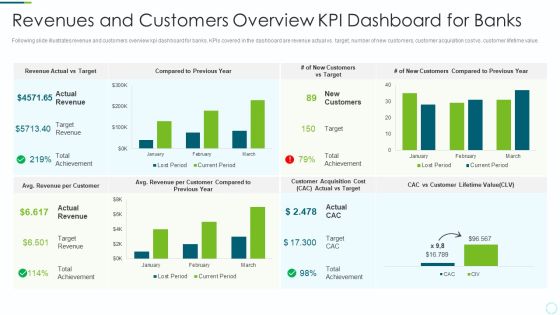
Implementing BPM Techniques Revenues And Customers Overview KPI Dashboard For Banks Microsoft PDF
Following slide illustrates revenue and customers overview kpi dashboard for banks. KPIs covered in the dashboard are revenue actual vs. target, number of new customers, customer acquisition cost vs. customer lifetime value. Deliver an awe inspiring pitch with this creative Implementing BPM Techniques Revenues And Customers Overview KPI Dashboard For Banks Microsoft PDF bundle. Topics like Target Revenue, Customers Compared, Customer Lifetime can be discussed with this completely editable template. It is available for immediate download depending on the needs and requirements of the user.

Implementing Agile Software Development Methodology For Cost Cutting IT Projected Cost Of Project Brochure PDF
Following slide illustrates forecasted statistics about project cost to be bear by the organization after adopting agile methodology. It also shows that technical debt will get decreased post agile adoption.Deliver and pitch your topic in the best possible manner with this Implementing Agile Software Development Methodology For Cost Cutting IT Projected Cost Of Project Brochure PDF Use them to share invaluable insights on Project Cost, Technical Dept, Value Stream and impress your audience. This template can be altered and modified as per your expectations. So, grab it now.

ERP Digital Transformation Journey Market Scenario And Disruption In Business Inspiration PDF
The following slide illustrates market scenario and business disruption for digital transformation industry. The following slide displays the adoption rate of digital transformation, key issues in the Industry and solution for major problems in Industry. Deliver an awe inspiring pitch with this creative ERP Digital Transformation Journey Market Scenario And Disruption In Business Inspiration PDF bundle. Topics like Solution Digital Transformation, Organizations Dependent, Digital Products can be discussed with this completely editable template. It is available for immediate download depending on the needs and requirements of the user.

Debt Recovery And Funds Recovery Dashboard Structure PDF
This slide illustrates debt collection and funds recovery dashboard which includes todays contacts, past collectionweeks todays collection by operator and regular collected funds data. It can help businesses in streamlining the process of bad debts recovery.Showcasing this set of slides titled Debt Recovery And Funds Recovery Dashboard Structure PDF The topics addressed in these templates are Debt Recovery, Funds Recovery Dashboard All the content presented in this PPT design is completely editable. Download it and make adjustments in color, background, font etc. as per your unique business setting.

Dashboard Of Recruitment Funnel And Key Metrics Information PDF
The slide highlights the dashboard of recruitment funnel and key metrics illustrating recruitment source, department, job level, key metrics, recruitment funnel, number of days per stage, gender ratio and age of applicants.Pitch your topic with ease and precision using this Dashboard Of Recruitment Funnel And Key Metrics Information PDF This layout presents information on Recruitment Funnel, Recruitment Dashboard, Recruitment Cost It is also available for immediate download and adjustment. So, changes can be made in the color, design, graphics or any other component to create a unique layout.

Our Target Market For LBS Application Elevator Pitch Deck Ppt Professional Elements PDF
This slide illustrates information about the target market of the company for its location based service application. Here the slide shows that company will primarily focus on restaurants and cafes market. Deliver an awe inspiring pitch with this creative Our Target Market For LBS Application Elevator Pitch Deck Ppt Professional Elements PDF bundle. Topics like Customer Wants, Keeping Mind, Primarily Cover can be discussed with this completely editable template. It is available for immediate download depending on the needs and requirements of the user.

Comparative Monthly Sales Report By Region Graphics PDF
The following slide highlights the comparative monthly sales by region illustrating key headings which includes monthly sales by region, monthly sales by quantity, product sales distribution and monthly sales revenue by product. Showcasing this set of slides titled Comparative Monthly Sales Report By Region Graphics PDF. The topics addressed in these templates are Sales Revenue, Monthly Sales Quantity, Product Sales Distribution. All the content presented in this PPT design is completely editable. Download it and make adjustments in color, background, font etc. as per your unique business setting.
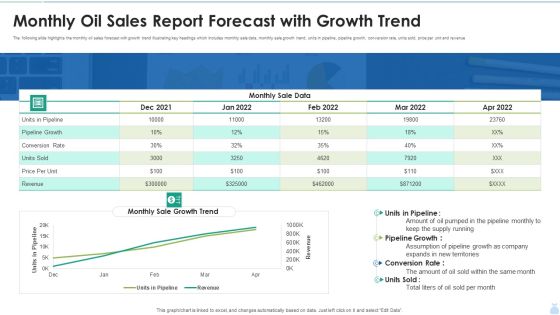
Monthly Oil Sales Report Forecast With Growth Trend Graphics PDF
The following slide highlights the monthly oil sales forecast with growth trend illustrating key headings which includes monthly sale data, monthly sale growth trend, units in pipeline, pipeline growth, conversion rate, units sold, price per unit and revenue. Showcasing this set of slides titled Monthly Oil Sales Report Forecast With Growth Trend Graphics PDF. The topics addressed in these templates are Pipeline Growth, Monthly Sale Data, Conversion Rate. All the content presented in this PPT design is completely editable. Download it and make adjustments in color, background, font etc. as per your unique business setting.

Sales Team Monthly Report With Variance Background PDF
The following slide highlights the sales team monthly report with variance illustrating key headings which includes key headings month, sales, target, variance, percentage variance and key takeaways. Pitch your topic with ease and precision using this Sales Team Monthly Report With Variance Background PDF. This layout presents information on Sales Team Monthly Report With Variance Background PDF. It is also available for immediate download and adjustment. So, changes can be made in the color, design, graphics or any other component to create a unique layout.
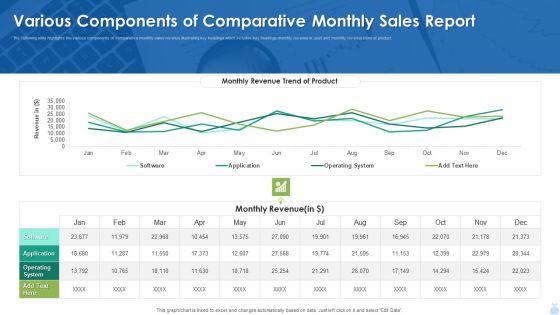
Various Components Of Comparative Monthly Sales Report Inspiration PDF
The following slide highlights the various components of comparative monthly sales revenue illustrating key headings which includes key headings monthly revenue in used and monthly revenue trend of product. Showcasing this set of slides titled Various Components Of Comparative Monthly Sales Report Inspiration PDF. The topics addressed in these templates are Various Components Of Comparative Monthly Sales Report Inspiration PDF. All the content presented in this PPT design is completely editable. Download it and make adjustments in color, background, font etc. as per your unique business setting.

Effective Sales Plan For New Product Introduction In Market Dashboard To Measure Sales Download PDF
This slide illustrates sales representative performance measurement dashboard with key metrics such as average first contact resolution rate, occupancy rate, NPS and top agents by solved tickets.Deliver and pitch your topic in the best possible manner with this Effective Sales Plan For New Product Introduction In Market Dashboard To Measure Sales Download PDF Use them to share invaluable insights on Sales Enquiry, Feature Request, Setup Request and impress your audience. This template can be altered and modified as per your expectations. So, grab it now.
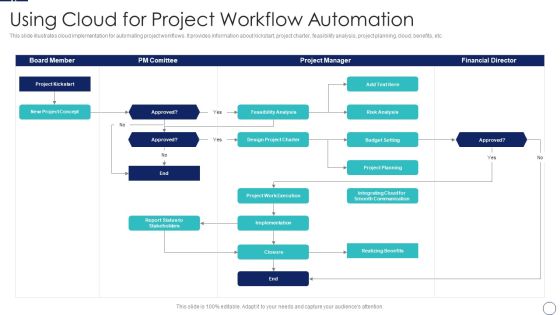
How To Implement Cloud Collaboration Using Cloud For Project Workflow Automation Ideas PDF
This slide illustrates cloud implementation for automating project workflows. It provides information about kickstart, project charter, feasibility analysis, project planning, cloud, benefits, etc. This is a How To Implement Cloud Collaboration Using Cloud For Project Workflow Automation Ideas PDF template with various stages. Focus and dispense information on one stages using this creative set, that comes with editable features. It contains large content boxes to add your information on topics like Board Member, New Project Concept, Risk Analysis. You can also showcase facts, figures, and other relevant content using this PPT layout. Grab it now.

Capacity Allotment Management For Program Backlog Management Graphics PDF
This slide illustrates capacity allocation which can be helpful for agile teams for reducing program backlogs. It contains information about team context, stakeholders, team backlog, user stories, refactors, maintenance, next program increment, etc. Pitch your topic with ease and precision using this Capacity Allotment Management For Program Backlog Management Graphics PDF. This layout presents information on Increment Commitment Planning, Designs, Technological. It is also available for immediate download and adjustment. So, changes can be made in the color, design, graphics or any other component to create a unique layout.

Online Dating Business Investor Capital Financing Most Popular Dating Apps In Usa By Audience Size Clipart PDF
Following slide illustrates key statistics of most popular dating apps in USA by audience size. Dating apps covered are Tinder, Plenty of Fish, OKCupid, Bumble and Zoosk. Deliver and pitch your topic in the best possible manner with this Online Dating Business Investor Capital Financing Most Popular Dating Apps In Usa By Audience Size Clipart PDF. Use them to share invaluable insights on Popular Dating Apps and impress your audience. This template can be altered and modified as per your expectations. So, grab it now.
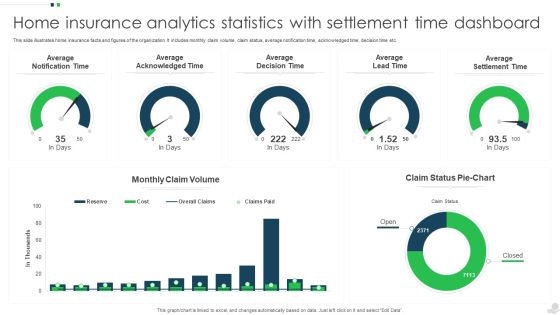
Home Insurance Analytics Statistics With Settlement Time Dashboard Ideas PDF
This slide illustrates home insurance facts and figures of the organization. It includes monthly claim volume, claim status, average notification time, acknowledged time, decision time etc. Pitch your topic with ease and precision using this Home Insurance Analytics Statistics With Settlement Time Dashboard Ideas PDF. This layout presents information on Average Acknowledged Time, Average Decision Time, Average Lead Time. It is also available for immediate download and adjustment. So, changes can be made in the color, design, graphics or any other component to create a unique layout.
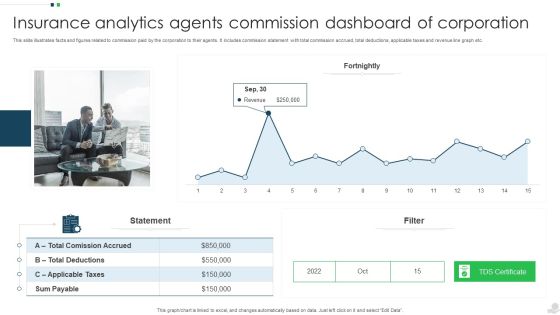
Insurance Analytics Agents Commission Dashboard Of Corporation Introduction PDF
This slide illustrates facts and figures related to commission paid by the corporation to their agents. It includes commission statement with total commission accrued, total deductions, applicable taxes and revenue line graph etc. Pitch your topic with ease and precision using this Insurance Analytics Agents Commission Dashboard Of Corporation Introduction PDF. This layout presents information on Applicable Taxes, Sum Payable, Revenue. It is also available for immediate download and adjustment. So, changes can be made in the color, design, graphics or any other component to create a unique layout.

Insurance Analytics Corporation Clients Claims Dashboard Summary PDF
This slide illustrates clients claim status statistics of a insurance corporation. It includes total claims, monthly claims, claims amount by type, percentage of claims, denied and received claims line graph. Showcasing this set of slides titled Insurance Analytics Corporation Clients Claims Dashboard Summary PDF. The topics addressed in these templates are Insurance Analytics Corporation, Clients Claims Dashboard. All the content presented in this PPT design is completely editable. Download it and make adjustments in color, background, font etc. as per your unique business setting.

Insurance Analytics Corporation Sales Insights Dashboard Structure PDF
This slide illustrates facts and figures in relation to sales and overall policy status. It includes total policies and premiums in current and previous year, quarterly premium revenue and monthly policy status. Pitch your topic with ease and precision using this Insurance Analytics Corporation Sales Insights Dashboard Structure PDF. This layout presents information on Quarterly Premium Revenue, Sales Insights Dashboard, Insurance Analytics Corporation. It is also available for immediate download and adjustment. So, changes can be made in the color, design, graphics or any other component to create a unique layout.
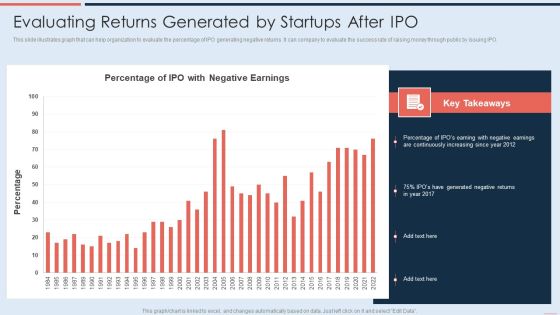
Evaluating Returns Generated By Startups After IPO Brochure PDF
This slide illustrates graph that can help organization to evaluate the percentage of IPO generating negative returns. It can company to evaluate the success rate of raising money through public by issuing IPO. Deliver and pitch your topic in the best possible manner with this Evaluating Returns Generated By Startups After IPO Brochure PDF. Use them to share invaluable insights on Percentage, Continuously Increasing, Generated Negative Returns and impress your audience. This template can be altered and modified as per your expectations. So, grab it now.
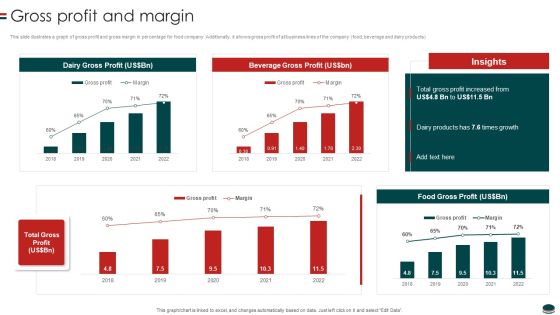
Instant Snacks And Food Firm Details Gross Profit And Margin Professional PDF
This slide illustrates a graph of gross profit and gross margin in percentage for food company. Additionally, it shows gross profit of all business lines of the company food, beverage and dairy products.Deliver an awe inspiring pitch with this creative Instant Snacks And Food Firm Details Gross Profit And Margin Professional PDF bundle. Topics like Gross Profit, Beverage Gross, Dairy Products can be discussed with this completely editable template. It is available for immediate download depending on the needs and requirements of the user.

Instant Snacks And Food Firm Details Net Profit And Margin Microsoft PDF
This slide illustrates a graph of net profit in US and gross margin in percentage for food company. Additionally, it shows net profit of all business lines of the company food, beverage and dairy products.Deliver and pitch your topic in the best possible manner with this Instant Snacks And Food Firm Details Net Profit And Margin Microsoft PDF Use them to share invaluable insights on Profit Increased, Profit Margin, Disrupted Supply and impress your audience. This template can be altered and modified as per your expectations. So, grab it now.
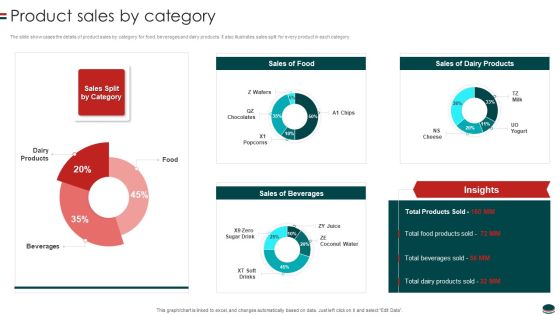
Instant Snacks And Food Firm Details Product Sales By Category Structure PDF
The slide showcases the details of product sales by category for food, beverages and dairy products. It also illustrates sales split for every product in each category Deliver and pitch your topic in the best possible manner with this Instant Snacks And Food Firm Details Product Sales By Category Structure PDF Use them to share invaluable insights on Dairy Products, Sales Beverages, Sales Of Food and impress your audience. This template can be altered and modified as per your expectations. So, grab it now.
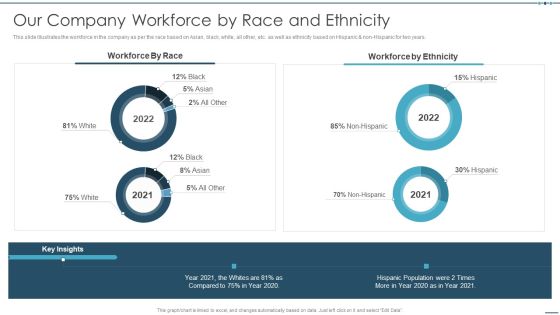
Setting Workplace Diversity And Inclusivity Objectives Our Company Workforce By Race And Ethnicity Clipart PDF
This slide illustrates the workforce in the company as per the race based on Asian, black, white, all other, etc. as well as ethnicity based on Hispanic no Hispanic for two years.Deliver and pitch your topic in the best possible manner with this Setting Workplace Diversity And Inclusivity Objectives Our Company Workforce By Race And Ethnicity Clipart PDF Use them to share invaluable insights on Workforce By Race, Workforce By Ethnicity, Non Hispanic and impress your audience. This template can be altered and modified as per your expectations. So, grab it now.

Byjus Investor Capital Financing Pitch Deck Byjus Revenue Generation Model Introduction PDF
Following slide illustrates information about the companys revenue model. The company generates revenue from multiple streams namely freemium business model includes subscription fees, table model courses installed in a tablet where the student must buy the tablet and learn offline, offline coaching, product purchase, offline career counselling and revenue from APIs Application Programme Interface.Deliver an awe inspiring pitch with this creative Byjus Investor Capital Financing Pitch Deck Byjus Revenue Generation Model Introduction PDF bundle. Topics like Programming Interface, Freemium Business, Career Counselling can be discussed with this completely editable template. It is available for immediate download depending on the needs and requirements of the user.
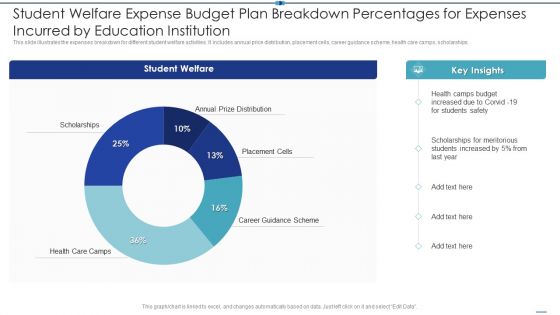
Student Welfare Expense Budget Plan Breakdown Percentages For Expenses Incurred By Education Institution Demonstration PDF
This slide illustrates the expenses breakdown for different student welfare activities. It includes annual price distribution, placement cells, career guidance scheme, health care camps, scholarships.Showcasing this set of slides titled Student Welfare Expense Budget Plan Breakdown Percentages For Expenses Incurred By Education Institution Demonstration PDF The topics addressed in these templates are Scholarships For Meritorious, Students Increased, Student Welfare All the content presented in this PPT design is completely editable. Download it and make adjustments in color, background, font etc. as per your unique business setting.
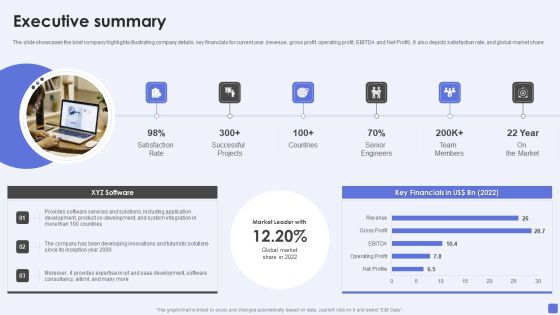
Software Services Business Profile Executive Summary Ppt PowerPoint Presentation File Elements PDF
The slide showcases the brief company highlights illustrating company details, key financials for current year revenue, gross profit, operating profit, EBITDA and Net Profit. It also depicts satisfaction rate, and global market share. Deliver an awe inspiring pitch with this creative Software Services Business Profile Executive Summary Ppt PowerPoint Presentation File Elements PDF bundle. Topics like Satisfaction Rate, Successful Projects, Senior Engineers can be discussed with this completely editable template. It is available for immediate download depending on the needs and requirements of the user.
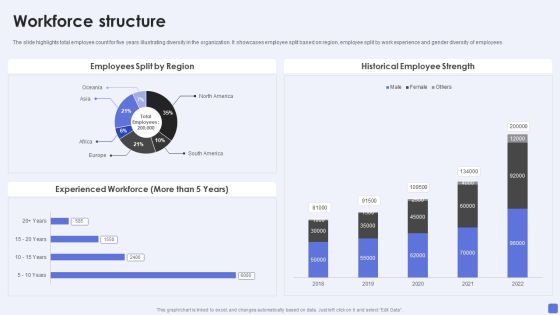
Software Services Business Profile Workforce Structure Ppt PowerPoint Presentation Gallery Good PDF
The slide highlights total employee count for five years illustrating diversity in the organization. It showcases employee split based on region, employee split by work experience and gender diversity of employees. Deliver and pitch your topic in the best possible manner with this Software Services Business Profile Workforce Structure Ppt PowerPoint Presentation Gallery Good PDF. Use them to share invaluable insights on Employees Split Region, Historical Employee Strength, Experienced Workforce, 2018 To 2022 and impress your audience. This template can be altered and modified as per your expectations. So, grab it now.
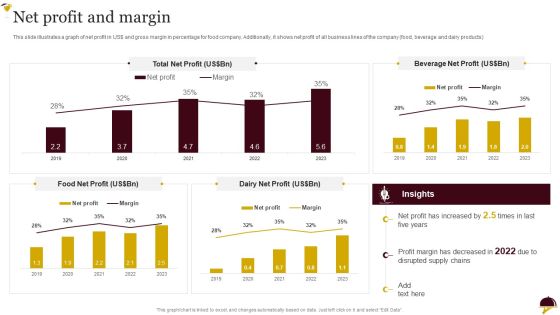
Food Company Overview Net Profit And Margin Summary PDF
This slide illustrates a graph of net profit in USdollar and gross margin in percentage for food company. Additionally, it shows net profit of all business lines of the company food, beverage and dairy products.Deliver and pitch your topic in the best possible manner with this Food Company Overview Net Profit And Margin Summary PDF Use them to share invaluable insights on Beverage Net, Margin Decreased, Disrupted Supply and impress your audience. This template can be altered and modified as per your expectations. So, grab it now.

Challenges Of Human Resource Consulting With Impact Ppt Styles Layout PDF
The following slide highlights the challenges of human resource consulting with impact illustrating challenges which includes high expenses, skilled talent scarcity, employee engagement, retaining top talent, training and development cost and work life balance and impact of challenges on profit and efficiency. Showcasing this set of slides titled Challenges Of Human Resource Consulting With Impact Ppt Styles Layout PDF. The topics addressed in these templates are Challenges, Impact On Profit, Impact On Efficiency. All the content presented in this PPT design is completely editable. Download it and make adjustments in color, background, font etc. as per your unique business setting.
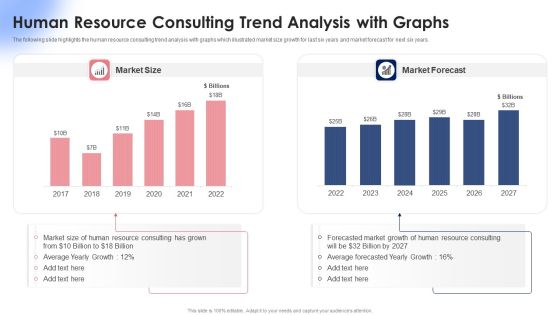
Human Resource Consulting Trend Analysis With Graphs Ppt Summary Clipart Images PDF
The following slide highlights the human resource consulting trend analysis with graphs which illustrated market size growth for last six years and market forecast for next six years. Pitch your topic with ease and precision using this Human Resource Consulting Trend Analysis With Graphs Ppt Summary Clipart Images PDF. This layout presents information on Market Size, Market Forecast, 2017 To 2022. It is also available for immediate download and adjustment. So, changes can be made in the color, design, graphics or any other component to create a unique layout.
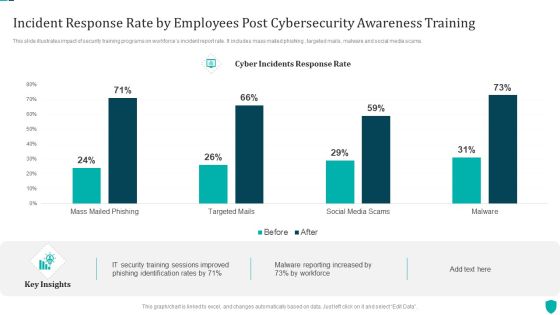
Incident Response Rate By Employees Post Cybersecurity Awareness Training Demonstration PDF
This slide illustrates impact of security training programs on workforces incident report rate. It includes mass mailed phishing , targeted mails, malware and social media scams.Pitch your topic with ease and precision using this Incident Response Rate By Employees Post Cybersecurity Awareness Training Demonstration PDF. This layout presents information on Training Sessions, Phishing Identification, Malware Reporting. It is also available for immediate download and adjustment. So, changes can be made in the color, design, graphics or any other component to create a unique layout.
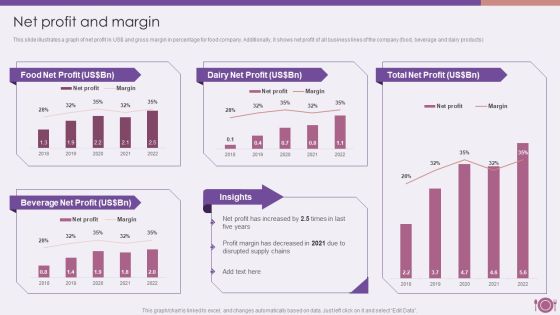
Packaged Food Firm Description Net Profit And Margin Download PDF
This slide illustrates a graph of net profit in USdollar and gross margin in percentage for food company. Additionally, it shows net profit of all business lines of the company food, beverage and dairy products.Deliver and pitch your topic in the best possible manner with this Packaged Food Firm Description Net Profit And Margin Download PDF. Use them to share invaluable insights on Dairy Net, Total Net, Beverage Net Profit and impress your audience. This template can be altered and modified as per your expectations. So, grab it now.
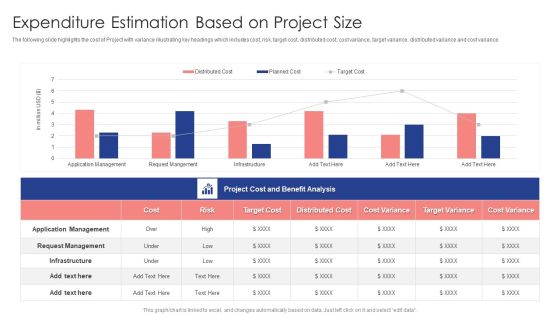
Expenditure Estimation Based On Project Size Ppt Styles Example Introduction PDF
The following slide highlights the cost of Project with variance illustrating key headings which includes cost, risk, target cost, distributed cost, cost variance, target variance, distributed variance and cost variance Showcasing this set of slides titled Expenditure Estimation Based On Project Size Ppt Styles Example Introduction PDF. The topics addressed in these templates are Cost, Risk, Target Cost, Target Variance. All the content presented in this PPT design is completely editable. Download it and make adjustments in color, background, font etc. as per your unique business setting.

Breakeven Point Graph With Degree Of Operational Leverage Ppt Layouts Graphics Pictures PDF
This slide illustrates graphical representation of breakeven point and key insights. It includes figures of contribution margin, fixed costs, total cost, operating costs etc. Showcasing this set of slides titled Breakeven Point Graph With Degree Of Operational Leverage Ppt Layouts Graphics Pictures PDF. The topics addressed in these templates are Total Sales, Net income, Total Costs, Total Variables Costs. All the content presented in this PPT design is completely editable. Download it and make adjustments in color, background, font etc. as per your unique business setting.
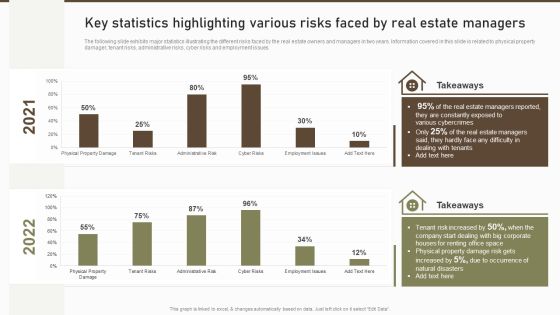
Key Statistics Highlighting Various Risks Faced By Real Estate Managers Microsoft PDF
The following slide exhibits major statistics illustrating the different risks faced by the real estate owners and managers in two years. Information covered in this slide is related to physical property damager, tenant risks, administrative risks, cyber risks and employment issues. Deliver an awe inspiring pitch with this creative Key Statistics Highlighting Various Risks Faced By Real Estate Managers Microsoft PDF bundle. Topics like Estate Managers, Constantly Exposed, Various Cybercrimes can be discussed with this completely editable template. It is available for immediate download depending on the needs and requirements of the user.

Dashboard Of Shipment Logistics KPI With Operating Cost Ppt Styles Example Topics PDF
The following slide highlights dashboard of shipment transportation with operating cost illustrating transportation operating cost, monthly order completion rate, operating cost distribution, order completion trend, transportation by destination and transportation efficiency. Showcasing this set of slides titled Dashboard Of Shipment Logistics KPI With Operating Cost Ppt Styles Example Topics PDF. The topics addressed in these templates are Transportation Operating Cost, Monthly Order, Completion Rate, Operating Cost Distribution. All the content presented in this PPT design is completely editable. Download it and make adjustments in color, background, font etc. as per your unique business setting.
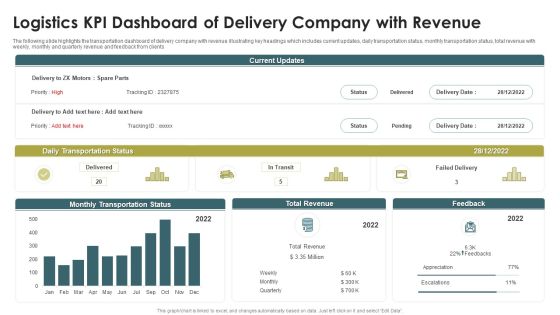
Logistics KPI Dashboard Of Delivery Company With Revenue Ppt Show PDF
The following slide highlights the transportation dashboard of delivery company with revenue illustrating key headings which includes current updates, daily transportation status, monthly transportation status, total revenue with weekly, monthly and quarterly revenue and feedback from clients. Showcasing this set of slides titled Logistics KPI Dashboard Of Delivery Company With Revenue Ppt Show PDF. The topics addressed in these templates are Daily Transportation Status, Monthly Transportation Status, Total Revenue. All the content presented in this PPT design is completely editable. Download it and make adjustments in color, background, font etc. as per your unique business setting.

Logistics KPI Status Dashboard With Monthly KPI Ppt Infographic Template Layout PDF
The following slide highlights the transportation status dashboard with monthly KPI illustrating order status with customer, order date and delivery date. It shows financial performance for four quarters as well as todays order, inventory and monthly KPI with Inventory, shipping cost for past 30 days. Pitch your topic with ease and precision using this Logistics KPI Status Dashboard With Monthly KPI Ppt Infographic Template Layout PDF. This layout presents information on Order Status, Today Order, Inventory, Monthly KPI. It is also available for immediate download and adjustment. So, changes can be made in the color, design, graphics or any other component to create a unique layout.

Dashboard For International Logistics KPI Via Third Party Carriers Rules PDF
The following slide highlights the dashboard for international transportation via third party carriers illustrating total shipment, payment method, revenue, shipment status and shipment details such as company, tracking id, Item, weight, address, payment, status to monitor the transportation. Showcasing this set of slides titled Dashboard For International Logistics KPI Via Third Party Carriers Rules PDF. The topics addressed in these templates are Total Shipment, Payment Method, Revenue, 20. All the content presented in this PPT design is completely editable. Download it and make adjustments in color, background, font etc. as per your unique business setting.

Dashboard For Logistics KPI Management System Of Logistics Company Infographics PDF
The following slide highlights the dashboard for transportation management system of logistics company illustrating shipment status of 30 days, shipment by carrier, on time shipment, average shipment cost, carrier efficiency and shipment count. Pitch your topic with ease and precision using this Dashboard For Logistics KPI Management System Of Logistics Company Infographics PDF. This layout presents information on Shipment Status, Shipment By Carrier, On Time Shipment. It is also available for immediate download and adjustment. So, changes can be made in the color, design, graphics or any other component to create a unique layout.
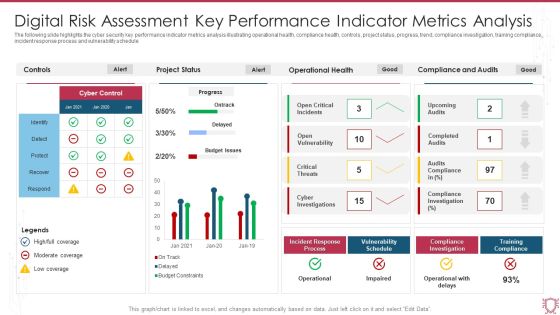
Digital Risk Assessment Key Performance Indicator Metrics Analysis Infographics PDF
The following slide highlights the cyber security key performance indicator metrics analysis illustrating operational health, compliance health, controls, project status, progress, trend, compliance investigation, training compliance, incident response process and vulnerability schedule. Showcasing this set of slides titled Digital Risk Assessment Key Performance Indicator Metrics Analysis Infographics PDF. The topics addressed in these templates are Project Status, Operational Health, Compliance And Audits. All the content presented in this PPT design is completely editable. Download it and make adjustments in color, background, font etc. as per your unique business setting.
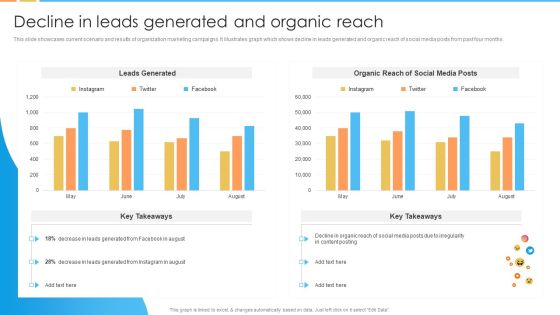
Digital Marketing Guide For B2B Firms Decline In Leads Generated And Organic Reach Pictures PDF
This slide showcases current scenario and results of organization marketing campaigns. It illustrates graph which shows decline in leads generated and organic reach of social media posts from past four months.Deliver and pitch your topic in the best possible manner with this Digital Marketing Guide For B2B Firms Decline In Leads Generated And Organic Reach Pictures PDF. Use them to share invaluable insights on Leads Generated, Organic Reach, Leads Generated and impress your audience. This template can be altered and modified as per your expectations. So, grab it now.
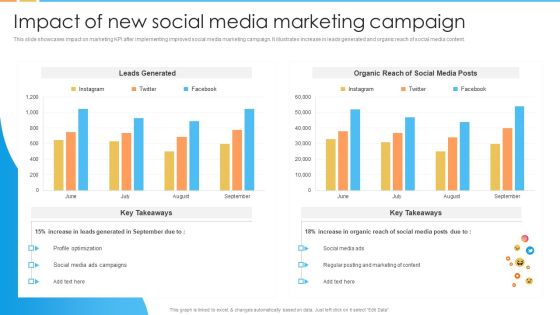
Digital Marketing Guide For B2B Firms Impact Of New Social Media Marketing Campaign Guidelines PDF
This slide showcases impact on marketing KPI after implementing improved social media marketing campaign. It illustrates increase in leads generated and organic reach of social media content.Deliver and pitch your topic in the best possible manner with this Digital Marketing Guide For B2B Firms Impact Of New Social Media Marketing Campaign Guidelines PDF. Use them to share invaluable insights on Profile Optimization, Organic Reach, Regular Posting and impress your audience. This template can be altered and modified as per your expectations. So, grab it now.

Freelance Content Marketing Dashboard With Metrics Demonstration PDF
The following slide highlights the freelance content marketing dashboard with metrics illustrating most visited content, monthly total visit, average content score. It depicts key metrics which includes content reach, unique visits, organic ranking, number of shares, rating, session time and repeat visitors. Showcasing this set of slides titled Freelance Content Marketing Dashboard With Metrics Demonstration PDF. The topics addressed in these templates are Organic Ranking, Manufacturing, Average Content Score. All the content presented in this PPT design is completely editable. Download it and make adjustments in color, background, font etc. as per your unique business setting.
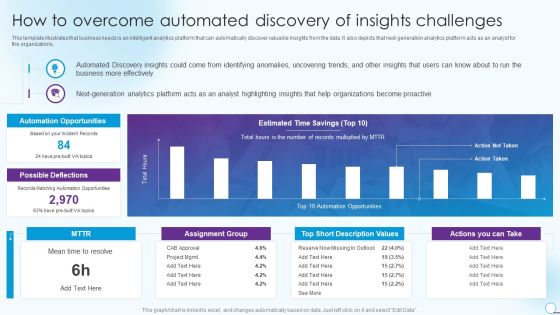
Information Analytics And Ml Strategy Playbook How To Overcome Automated Discovery Of Insights Challenges Information PDF
This template illustrates that business needs is an intelligent analytics platform that can automatically discover valuable insights from the data. It also depicts that next-generation analytics platform acts as an analyst for the organizations. Deliver an awe inspiring pitch with this creative Information Analytics And Ml Strategy Playbook How To Overcome Automated Discovery Of Insights Challenges Information PDF bundle. Topics like Organizations, Automation Opportunities, Description Values can be discussed with this completely editable template. It is available for immediate download depending on the needs and requirements of the user.
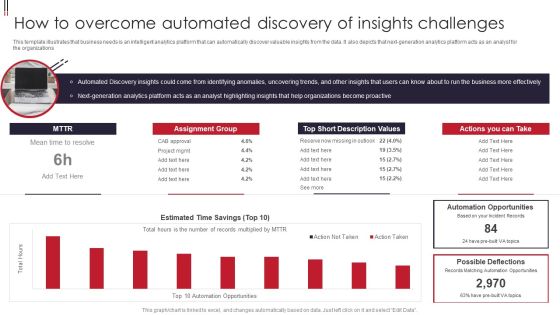
Information Visualizations Playbook How To Overcome Automated Discovery Of Insights Challenges Designs PDF
This template illustrates that business needs is an intelligent analytics platform that can automatically discover valuable insights from the data. It also depicts that next-generation analytics platform acts as an analyst for the organizations. Deliver and pitch your topic in the best possible manner with this Information Visualizations Playbook How To Overcome Automated Discovery Of Insights Challenges Designs PDF. Use them to share invaluable insights on Short Description Values, Automation Opportunities, Short Description Values, Analytics Platform and impress your audience. This template can be altered and modified as per your expectations. So, grab it now.

Key Trends Dashboard Required For Human Resources Strategic Plan Information PDF
The given slide illustrates a checklist for employee welfare and wellness. It includes activities such as designing schedule, keeping yourself physically fit, developing a social network etc. Showcasing this set of slides titled Key Trends Dashboard Required For Human Resources Strategic Plan Information PDF. The topics addressed in these templates are Organizational Cultural Management, Engaging Workforce, Talent Retention. All the content presented in this PPT design is completely editable. Download it and make adjustments in color, background, font etc. as per your unique business setting.

B2B Market Segmentation Dashboard Microsoft PDF
This slide illustrates the market segmentation dashboard for B2B which can benefit them to improve the focus and boost the revenue of the organization. It includes segmentation based in company size and different industries under B2B market. Pitch your topic with ease and precision using this B2B Market Segmentation Dashboard Microsoft PDF. This layout presents information on Industries, Market Segmentation, Service. It is also available for immediate download and adjustment. So, changes can be made in the color, design, graphics or any other component to create a unique layout.

Software Products And Solutions Firm Details Company Work Culture 2022 Graphics PDF
The slide showcases work culture and diversity report for FY22 illustrating key ranking criteria including global organization diversity rank, employee care services, health facilities, diversity policy and percentage employee with disabilities. Deliver an awe inspiring pitch with this creative Software Products And Solutions Firm Details Company Work Culture 2022 Graphics PDF bundle. Topics like Global Organization, Diversity Rank, Employee Care Services can be discussed with this completely editable template. It is available for immediate download depending on the needs and requirements of the user.
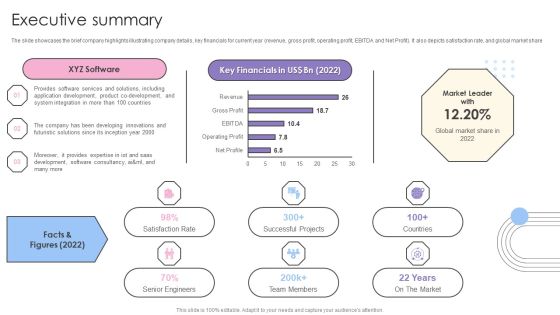
Software Products And Solutions Firm Details Executive Summary Clipart PDF
The slide showcases the brief company highlights illustrating company details, key financials for current year revenue, gross profit, operating profit, EBITDA and Net Profit. It also depicts satisfaction rate, and global market share. Deliver and pitch your topic in the best possible manner with this Software Products And Solutions Firm Details Executive Summary Clipart PDF. Use them to share invaluable insights on XYZ Software, Key Financials, Market Leader and impress your audience. This template can be altered and modified as per your expectations. So, grab it now.
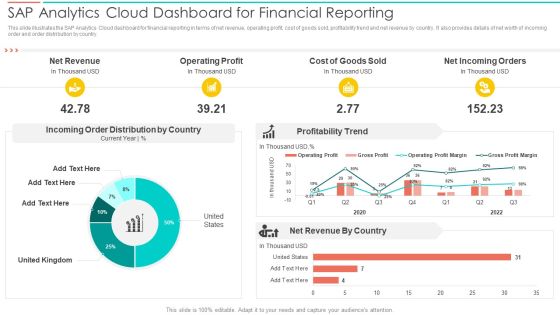
SAC Planning And Implementation SAP Analytics Cloud Dashboard For Financial Reporting Introduction PDF
This slide illustrates the SAP Analytics Cloud dashboard for financial reporting in terms of net revenue, operating profit, cost of goods sold, profitability trend and net revenue by country. It also provides details of net worth of incoming order and order distribution by country. Deliver an awe inspiring pitch with this creative SAC Planning And Implementation SAP Analytics Cloud Dashboard For Financial Reporting Introduction PDF bundle. Topics like Net Revenue, Operating Profit, Cost Goods Sold can be discussed with this completely editable template. It is available for immediate download depending on the needs and requirements of the user.
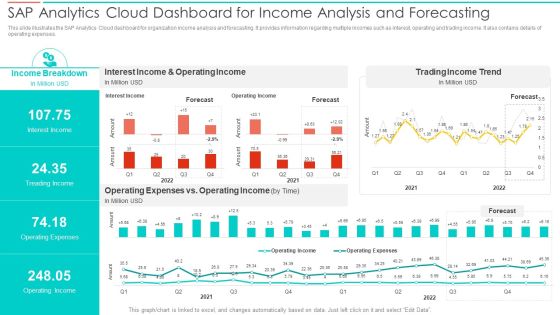
SAC Planning And Implementation SAP Analytics Cloud Dashboard For Income Analysis Summary PDF
This slide illustrates the SAP Analytics Cloud dashboard for organization income analysis and forecasting. It provides information regarding multiple incomes such as interest, operating and trading income. It also contains details of operating expenses. Deliver an awe inspiring pitch with this creative SAC Planning And Implementation SAP Analytics Cloud Dashboard For Income Analysis Summary PDF bundle. Topics like Income Breakdown, Interest Income, Operating Income, Trading Income Trend can be discussed with this completely editable template. It is available for immediate download depending on the needs and requirements of the user.

Personal Job Assignment Management Dashboard With Progress Background PDF
The following slide highlights the employee workload management dashboard with progress illustrating key headings which includes monthly task status, time, progress, task, employee work status and workload. Showcasing this set of slides titled Personal Job Assignment Management Dashboard With Progress Background PDF. The topics addressed in these templates are Monthly Task Status, Time, Progress, Employee Work Status. All the content presented in this PPT design is completely editable. Download it and make adjustments in color, background, font etc. as per your unique business setting.
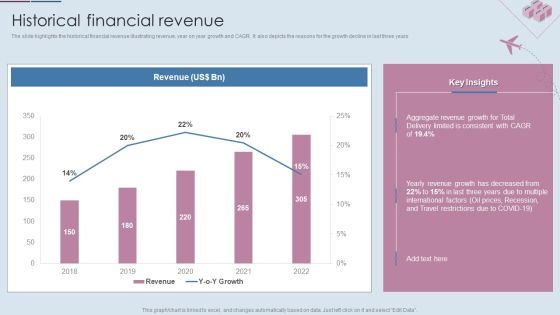
Logistics Shipment Company Profile Historical Financial Revenue Ppt Gallery Templates PDF
The slide highlights the historical financial revenue illustrating revenue, year on year growth and CAGR. It also depicts the reasons for the growth decline in last three years. Deliver and pitch your topic in the best possible manner with this Logistics Shipment Company Profile Historical Financial Revenue Ppt Gallery Templates PDF. Use them to share invaluable insights on Revenue, 2018 To 2022, Aggregate Revenue Growth and impress your audience. This template can be altered and modified as per your expectations. So, grab it now.

Logistics Shipment Company Profile Orders Distribution By Services Category In 2022 Designs PDF
The slide depicts the total orders distribution by services category illustrating percentage orders placed for each service including general freight, rail freight, sea freight, air freight, refrigerated freight and special services. Deliver an awe inspiring pitch with this creative Logistics Shipment Company Profile Orders Distribution By Services Category In 2022 Designs PDF bundle. Topics like Special Services, General Freight, Rail Freight can be discussed with this completely editable template. It is available for immediate download depending on the needs and requirements of the user.
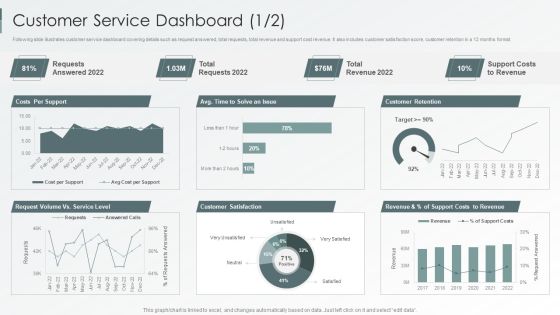
Enterprise Sustainability Performance Metrics Customer Service Dashboard Professional PDF
Following slide illustrates customer service dashboard covering details such as request answered, total requests, total revenue and support cost revenue. It also includes customer satisfaction score, customer retention in a 12 months format.Deliver and pitch your topic in the best possible manner with this Enterprise Sustainability Performance Metrics Customer Service Dashboard Professional PDF. Use them to share invaluable insights on Customer Satisfaction, Customer Retention, Support Revenue and impress your audience. This template can be altered and modified as per your expectations. So, grab it now.
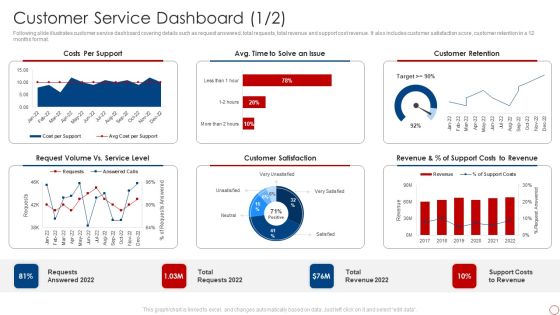
Kpis For Evaluating Business Sustainability Customer Service Dashboard Designs PDF
Following slide illustrates customer service dashboard covering details such as request answered, total requests, total revenue and support cost revenue. It also includes customer satisfaction score, customer retention in a 12 months format. Deliver and pitch your topic in the best possible manner with this Kpis For Evaluating Business Sustainability Customer Service Dashboard Designs PDF. Use them to share invaluable insights on Costs Per Support, Customer Retention, Customer Satisfaction and impress your audience. This template can be altered and modified as per your expectations. So, grab it now.

Business Software Development Company Profile Company Work Culture 2022 Ideas PDF
The slide showcases work culture and diversity report for FY22 illustrating key ranking criteria including global organization diversity rank, employee care services, health facilities, diversity policy and percentage employee with disabilities. Deliver an awe inspiring pitch with this creative Business Software Development Company Profile Company Work Culture 2022 Ideas PDF bundle. Topics like Work, Culture And Diversity, Report 2022, Employee Care Services can be discussed with this completely editable template. It is available for immediate download depending on the needs and requirements of the user.

Business Software Development Company Profile Executive Summary Introduction PDF
The slide showcases the brief company highlights illustrating company details, key financials for current year revenue, gross profit, operating profit, EBITDA and Net Profit. It also depicts satisfaction rate, and global market share. Deliver an awe inspiring pitch with this creative Business Software Development Company Profile Executive Summary Introduction PDF bundle. Topics like Key Financials US Dollar, Market Leader, Inception Year 2000 can be discussed with this completely editable template. It is available for immediate download depending on the needs and requirements of the user.

Brand Promotion Advertising Dashboard With Purchase Kpis Ppt PowerPoint Presentation File Format PDF
This slide illustrates the KPI dashboard for brand management. It also includes tracking metrics such as brand awareness, brand commitment, brand attribute, advertising awareness, sources of ad awareness, market share, repeat purchase, etc. Showcasing this set of slides titled Brand Promotion Advertising Dashboard With Purchase Kpis Ppt PowerPoint Presentation File Format PDF. The topics addressed in these templates are Brand Awareness, Advertising Awareness, Purchase Frequency. All the content presented in this PPT design is completely editable. Download it and make adjustments in color, background, font etc. as per your unique business setting.
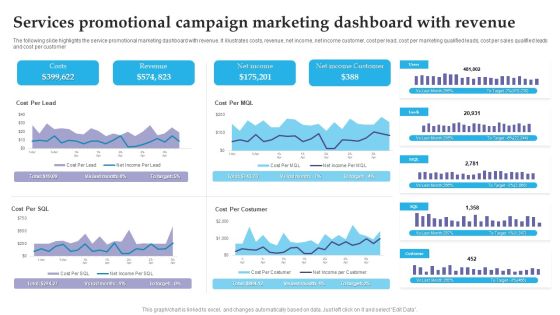
Services Promotional Campaign Marketing Dashboard With Revenue Brochure PDF
The following slide highlights the service promotional marketing dashboard with revenue. It illustrates costs, revenue, net income, net income customer, cost per lead, cost per marketing qualified leads, cost per sales qualified leads and cost per customer. Pitch your topic with ease and precision using this Services Promotional Campaign Marketing Dashboard With Revenue Brochure PDF. This layout presents information on Costs, Revenue, Net Income. It is also available for immediate download and adjustment. So, changes can be made in the color, design, graphics or any other component to create a unique layout.
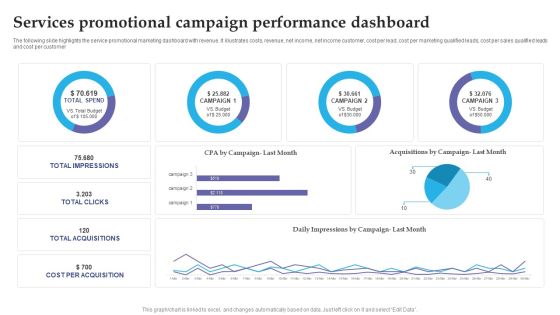
Services Promotional Campaign Performance Dashboard Slides PDF
The following slide highlights the service promotional marketing dashboard with revenue. It illustrates costs, revenue, net income, net income customer, cost per lead, cost per marketing qualified leads, cost per sales qualified leads and cost per customer. Pitch your topic with ease and precision using this Services Promotional Campaign Performance Dashboard Slides PDF. This layout presents information on Services Promotional, Campaign Performance Dashboard. It is also available for immediate download and adjustment. So, changes can be made in the color, design, graphics or any other component to create a unique layout.
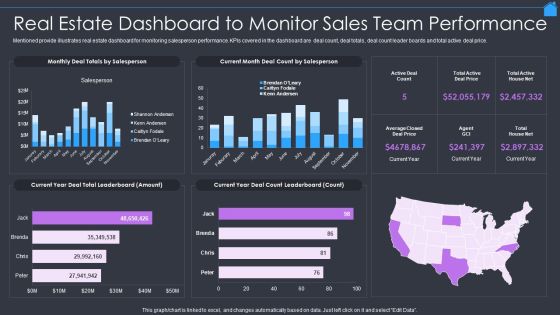
Marketing Strategy To Enhance Real Estate Sales Real Estate Dashboard To Monitor Sales Team Performance Infographics PDF
Mentioned provide illustrates real estate dashboard for monitoring salesperson performance. KPIs covered in the dashboard are deal count, deal totals, deal count leader boards and total active deal price. Deliver an awe inspiring pitch with this creative Marketing Strategy To Enhance Real Estate Sales Real Estate Dashboard To Monitor Sales Team Performance Infographics PDF bundle. Topics like Real Estate Dashboard, Monitor Sales Team Performance can be discussed with this completely editable template. It is available for immediate download depending on the needs and requirements of the user.
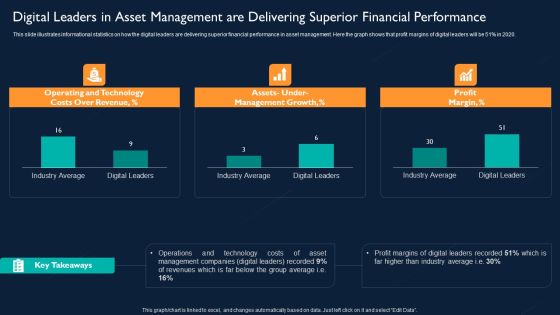
Digital Leaders In Asset Management Are Delivering Superior Financial Performance Designs PDF
This slide illustrates informational statistics on how the digital leaders are delivering superior financial performance in asset management. Here the graph shows that profit margins of digital leaders will be 51 percentage in 2020. Deliver and pitch your topic in the best possible manner with this Digital Leaders In Asset Management Are Delivering Superior Financial Performance Designs PDF. Use them to share invaluable insights on Operating And Technology Costs, Management Growth, Profit Margin and impress your audience. This template can be altered and modified as per your expectations. So, grab it now.
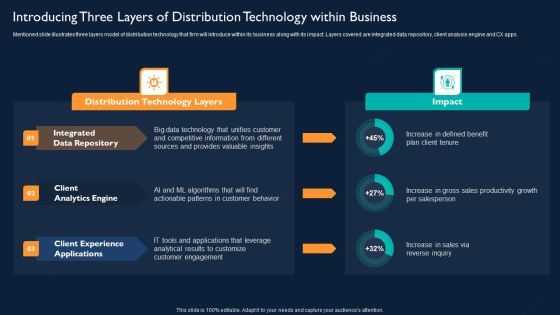
Introducing Three Layers Of Distribution Technology Within Business Ideas PDF
Mentioned slide illustrates three layers model of distribution technology that firm will introduce within its business along with its impact. Layers covered are integrated data repository, client analysis engine and CX apps. Deliver an awe inspiring pitch with this creative Introducing Three Layers Of Distribution Technology Within Business Ideas PDF bundle. Topics like Integrated Data Repository, Client Analytics Engine, Client Experience Applications can be discussed with this completely editable template. It is available for immediate download depending on the needs and requirements of the user.

Technology Investment To Enhance Business Growth Service Level Perceptions Asset Managers Versus Buyers Topics PDF
Following slide illustrates information about service level perceptions of asset managers versus buyers. It shows that on an average, customer rate the service level 14 percentage lower than the perception of asset managers. Deliver and pitch your topic in the best possible manner with this Technology Investment To Enhance Business Growth Service Level Perceptions Asset Managers Versus Buyers Topics PDF. Use them to share invaluable insights on Service Level Perceptions, Asset Managers Versus Buyers and impress your audience. This template can be altered and modified as per your expectations. So, grab it now.
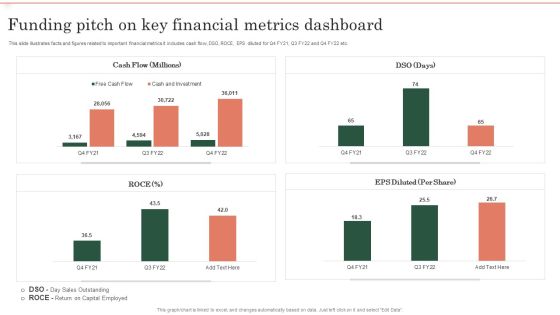
Funding Pitch On Key Financial Metrics Dashboard Ppt Ideas Deck PDF
This slide illustrates facts and figures related to important financial metrics It includes cash flow, DSO, ROCE, EPS diluted for Q4 FY21, Q3 FY22 and Q4 FY22 etc. Showcasing this set of slides titled Funding Pitch On Key Financial Metrics Dashboard Ppt Ideas Deck PDF. The topics addressed in these templates are Cash Flow, EPS Diluted, ROCE. All the content presented in this PPT design is completely editable. Download it and make adjustments in color, background, font etc. as per your unique business setting.

Funding Pitch Showing Revenue And Profit Growth Ppt Gallery Objects PDF
This slide illustrates business performance and revenue growth of a corporation for capital fund raising. It includes net revenue growth, gross profit, adjusted EPS growth, free cash flow etc. Showcasing this set of slides titled Funding Pitch Showing Revenue And Profit Growth Ppt Gallery Objects PDF. The topics addressed in these templates are Net Revenue, Gross profit Growth, Adjusted EPS Growth. All the content presented in this PPT design is completely editable. Download it and make adjustments in color, background, font etc. as per your unique business setting.

Pureprofile Business Overview Operational Kpis Ppt Summary Introduction PDF
The following slide showcases the business operations KPI to illustrate the performance of the organization. The KPIs include YOY growth, repeat clients revenue, survey completion growth, client growth, and incentives earned. Deliver and pitch your topic in the best possible manner with this Pureprofile Business Overview Operational Kpis Ppt Summary Introduction PDF. Use them to share invaluable insights on Average Client Tenure, Panel Acquisition Growth, SaaS Clients Growth and impress your audience. This template can be altered and modified as per your expectations. So, grab it now.

Business Opportunity Dashboard With Customer Metrics Information PDF
This Slide illustrates market opportunity dashboard with customer metrics which contains favorable net promoter score NPS, standard customers, growth rate, cumulative average of customer location, net income vs projection, customer distribution, sales by representatives, etc. Pitch your topic with ease and precision using this Business Opportunity Dashboard With Customer Metrics Information PDF. This layout presents information on Customer Distribution, Growth Rate, Top Customers Locations. It is also available for immediate download and adjustment. So, changes can be made in the color, design, graphics or any other component to create a unique layout.
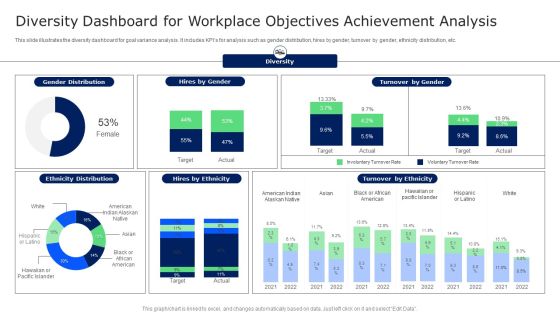
Diversity Dashboard For Workplace Objectives Achievement Analysis Microsoft PDF
This slide illustrates the diversity dashboard for goal variance analysis. It includes KPIs for analysis such as gender distribution, hires by gender, turnover by gender, ethnicity distribution, etc. Showcasing this set of slides titled Diversity Dashboard For Workplace Objectives Achievement Analysis Microsoft PDF. The topics addressed in these templates are Target, Involuntary Turnover Rate, Turnover By Ethnicity. All the content presented in this PPT design is completely editable. Download it and make adjustments in color, background, font etc. as per your unique business setting.

Dashboard Highlighting Product Kpis For Enhancement Strategy Structure PDF
This slide illustrates dashboard indicating product kpis for improvement plan which can be referred by organizations to review sales campaign performance. It includes information about top products in revenue, online vs. Offline transactions, increased sales by campaign and cost of products sold. Showcasing this set of slides titled Dashboard Highlighting Product Kpis For Enhancement Strategy Structure PDF. The topics addressed in these templates are Revenue, Products, Cost. All the content presented in this PPT design is completely editable. Download it and make adjustments in color, background, font etc. as per your unique business setting.

Merger And Acquisition Buying Strategy For Business Growth Mergers And Acquisitions By Sector Designs PDF
The slide illustrates the graph of number of merger and acquisition deals by sector that the company has completed in last five years. It also covers key facts CAGR growth, deal value etc. related to merger and acquisition deals of the company. Deliver an awe inspiring pitch with this creative Merger And Acquisition Buying Strategy For Business Growth Mergers And Acquisitions By Sector Designs PDF bundle. Topics like Acquisition Value, Financials Services Sector can be discussed with this completely editable template. It is available for immediate download depending on the needs and requirements of the user.

Retail Outlet Operational Efficiency Analytics Sales Dashboards For Retail Store Inspiration PDF
This slide illustrates the dashboard retail store sales forecasting providing information regarding sales per employee, price unit every transaction, total number of customers and average value of customer transaction. Deliver and pitch your topic in the best possible manner with this Retail Outlet Operational Efficiency Analytics Sales Dashboards For Retail Store Inspiration PDF. Use them to share invaluable insights on Gross Sales, Total No Customers, Value Customer and impress your audience. This template can be altered and modified as per your expectations. So, grab it now.

Company Financials Performance Tracking Dashboard Brochure PDF
This slide illustrates KPI dashboard that can be used by organizations to track their financial performance on company basis. Kpis covered in the slide are contract status, revenue, cost of goods, overdue and task status. Showcasing this set of slides titled Company Financials Performance Tracking Dashboard Brochure PDF. The topics addressed in these templates are Report Shortcut, Revenue Cost, Overdue Task. All the content presented in this PPT design is completely editable. Download it and make adjustments in color, background, font etc. as per your unique business setting.

Dashboard For E Commerce Project Management Ppt Ideas Design Inspiration PDF
Mentioned slide illustrates a dashboard which can be used by company for e-Commerce project management. The various metrics mentioned in the slide are new orders, total revenue, expenses, new users, etc. Showcasing this set of slides titled Dashboard For E Commerce Project Management Ppt Ideas Design Inspiration PDF. The topics addressed in these templates are New Orders, Total Income, Total Expense. All the content presented in this PPT design is completely editable. Download it and make adjustments in color, background, font etc. as per your unique business setting.
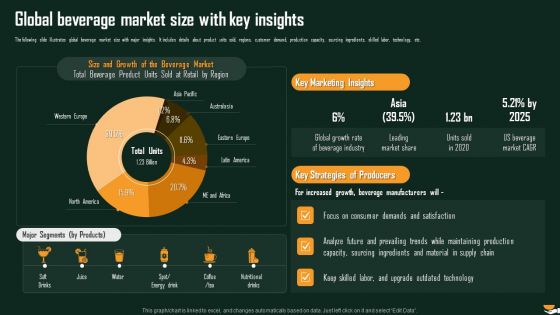
Global Beverage Market Size With Key Insights International Food And Beverages Sector Analysis Slides PDF
The following slide illustrates global beverage market size with major insights. It includes details about product units sold, regions, customer demand, production capacity, sourcing ingredients, skilled labor, technology, etc. Deliver and pitch your topic in the best possible manner with this Global Beverage Market Size With Key Insights International Food And Beverages Sector Analysis Slides PDF. Use them to share invaluable insights on Size Growth, Beverage Market, Marketing Insights and impress your audience. This template can be altered and modified as per your expectations. So, grab it now.
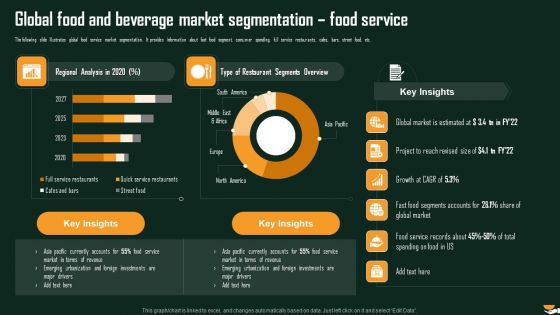
Global Food And Beverage Market Segmentation Food Service International Food And Beverages Sector Analysis Formats PDF
The following slide illustrates global food service market segmentation. It provides information about fast food segment, consumer spending, full service restaurants, cafes, bars, street food, etc. Deliver and pitch your topic in the best possible manner with this Global Food And Beverage Market Segmentation Food Service International Food And Beverages Sector Analysis Formats PDF. Use them to share invaluable insights on Regional Analysis, Restaurant Segments, Market Estimated and impress your audience. This template can be altered and modified as per your expectations. So, grab it now.
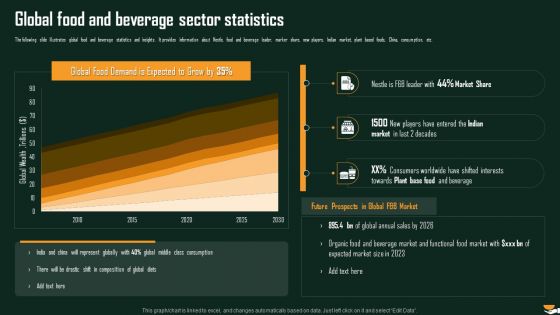
Global Food And Beverage Sector Statistics International Food And Beverages Sector Analysis Summary PDF
The following slide illustrates global food and beverage statistics and insights. It provides information about Nestle, food and beverage leader, marker share, new players, Indian market, plant based foods, China, consumption, etc. Deliver and pitch your topic in the best possible manner with this Global Food And Beverage Sector Statistics International Food And Beverages Sector Analysis Summary PDF. Use them to share invaluable insights on Demand Entered, Indian Expected, Functional Food and impress your audience. This template can be altered and modified as per your expectations. So, grab it now.
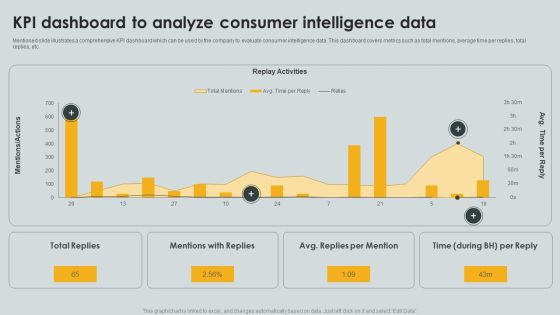
KPI Dashboard To Analyze Consumer Intelligence Data Ppt PowerPoint Presentation File Portfolio PDF
Mentioned slide illustrates a comprehensive KPI dashboard which can be used by the company to evaluate consumer intelligence data. This dashboard covers metrics such as total mentions, average time per replies, total replies, etc. Pitch your topic with ease and precision using this KPI Dashboard To Analyze Consumer Intelligence Data Ppt PowerPoint Presentation File Portfolio PDF. This layout presents information on Replay Activities, Total Replies, Mentions Replies. It is also available for immediate download and adjustment. So, changes can be made in the color, design, graphics or any other component to create a unique layout.

Business Clients Composition Dashboard For Capital Fund Raising Ppt Infographic Template Microsoft PDF
This slide illustrates facts related to composition to corporate clients for capital raising. It includes revenue contribution by clients, total contract value, new and active clients and client metrics etc. Showcasing this set of slides titled Business Clients Composition Dashboard For Capital Fund Raising Ppt Infographic Template Microsoft PDF. The topics addressed in these templates are Revenue Contribution Clients, Client Metrics, Total Contract Value. All the content presented in this PPT design is completely editable. Download it and make adjustments in color, background, font etc. as per your unique business setting.

Buy Side Merger And Acquisition Pitch Book Mergers And Acquisitions By Sector Summary PDF
The slide illustrates the graph of number of merger and acquisition deals by sector that the company has completed in last five years. It also covers key facts CAGR growth, deal value etc. related to merger and acquisition deals of the company. Deliver an awe inspiring pitch with this creative Buy Side Merger And Acquisition Pitch Book Mergers And Acquisitions By Sector Summary PDF bundle. Topics like Financials Services, Acquisition Value can be discussed with this completely editable template. It is available for immediate download depending on the needs and requirements of the user.

Business Management Strategy Survey To Boost Sales Summary PDF
This slide illustrate survey result of various promotional tactics used by top 1000 multi national companies to promote their product and services. it includes promotional strategies such as online advertisement, business directory, social media platforms etc. Pitch your topic with ease and precision using this Business Management Strategy Survey To Boost Sales Summary PDF. This layout presents information on Advertisement Strategy, Organization, Social Median. It is also available for immediate download and adjustment. So, changes can be made in the color, design, graphics or any other component to create a unique layout.

Customer Acquisition Plan Marketing Strategy Tools Information PDF
This slide illustrate success rate of various platform used for attracting and acquiring customer. It includes marketing tools such as website, email marketing, word of mouth communication, print advertisement, social media platforms etc. Showcasing this set of slides titled Customer Acquisition Plan Marketing Strategy Tools Information PDF. The topics addressed in these templates are Strategies, Customers, Marketing. All the content presented in this PPT design is completely editable. Download it and make adjustments in color, background, font etc. as per your unique business setting.
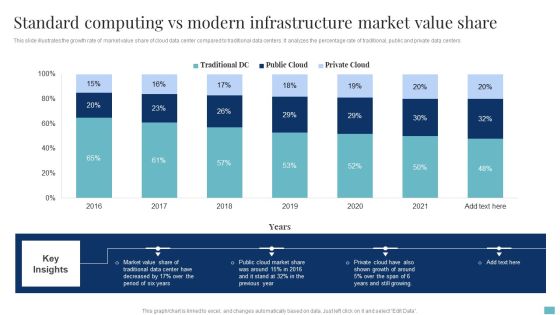
Standard Computing Vs Modern Infrastructure Market Value Share Brochure PDF
This slide illustrates the growth rate of market value share of cloud data center compared to traditional data centers. It analyzes the percentage rate of traditional, public and private data centers. Pitch your topic with ease and precision using this Standard Computing Vs Modern Infrastructure Market Value Share Brochure PDF. This layout presents information on Cloud Market Share, Market Value Share, Growth. It is also available for immediate download and adjustment. So, changes can be made in the color, design, graphics or any other component to create a unique layout.

Employee Risk Key Performance Indicator Dashboard With Case Incident Rate Ppt Professional Information PDF
The following slide highlights the employee safety key performance indicator dashboard with case incident rate illustrating total case occurrence rate, last reported case, days without reported, causing items, corrective actions, incident pyramid, incident by month and major causes. Pitch your topic with ease and precision using this Employee Risk Key Performance Indicator Dashboard With Case Incident Rate Ppt Professional Information PDF. This layout presents information on Total Case, Incident Rate, Last Incident Reported, Incident Causing Items. It is also available for immediate download and adjustment. So, changes can be made in the color, design, graphics or any other component to create a unique layout.
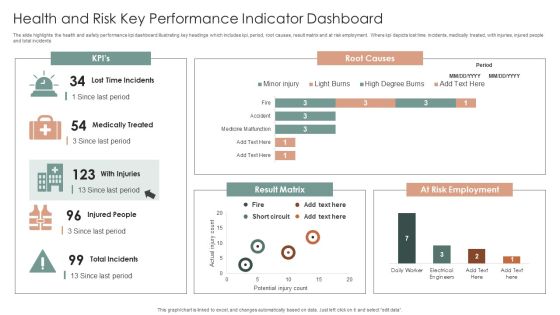
Health And Risk Key Performance Indicator Dashboard Ppt Layouts Graphics Design PDF
The slide highlights the health and safety performance kpi dashboard illustrating key headings which includes kpi, period, root causes, result matrix and at risk employment. Where kpi depicts lost time incidents, medically treated, with injuries, injured people and total incidents. Showcasing this set of slides titled Health And Risk Key Performance Indicator Dashboard Ppt Layouts Graphics Design PDF. The topics addressed in these templates are Root Causes, Result Matrix, At Risk Employment. All the content presented in this PPT design is completely editable. Download it and make adjustments in color, background, font etc. as per your unique business setting.

Health And Risk KPI Dashboard Ppt Pictures Designs Download PDF
The slide highlights the health and safety key performance indicator dashboard illustrating key headings which includes key objectives, inspections, total reports vs over due reports, injuries by body part and accident trends. Pitch your topic with ease and precision using this Health And Risk KPI Dashboard Ppt Pictures Designs Download PDF. This layout presents information on Key Objectives, Inspections, Accidents Trends. It is also available for immediate download and adjustment. So, changes can be made in the color, design, graphics or any other component to create a unique layout.

Patient Health And Risk Key Performance Indicator Dashboard Ppt Infographic Template Summary PDF
The following slide highlights the patient health and safety key performance indicator dashboard illustrating admission by department, admission by cost, patient satisfaction, total patients, operations cost, patient density, total staff, waiting time, treatment satisfaction and treatment confidence. Pitch your topic with ease and precision using this Patient Health And Risk Key Performance Indicator Dashboard Ppt Infographic Template Summary PDF. This layout presents information on Admission By Department, Admission Vs Cost, Patient Satisfaction. It is also available for immediate download and adjustment. So, changes can be made in the color, design, graphics or any other component to create a unique layout.

Improve IT Service Desk Service Desk Dashboard For Monitoring IT Infrastructure Introduction PDF
This slide illustrates service desk dashboard for monitoring information technology IT infrastructure. It provides information about issues, safety inspection, problem servers, workstations, operating system, Windows, Mac, Linux, etc.Deliver and pitch your topic in the best possible manner with this Improve IT Service Desk Service Desk Dashboard For Monitoring IT Infrastructure Introduction PDF. Use them to share invaluable insights on Problem Servers, Problem Workstations, Operating System and impress your audience. This template can be altered and modified as per your expectations. So, grab it now.

Improve IT Service Desk Statistics Highlighting Key Priorities Of Service Topics PDF
The following slide illustrates statistics showcasing major priorities of service desk professionals. It provides information about automation, inbound calls, emails, first time fix rate, self service portal, service desk costs, etc. Deliver and pitch your topic in the best possible manner with this Improve IT Service Desk Statistics Highlighting Key Priorities Of Service Topics PDF. Use them to share invaluable insights on Service Managers, Ticket Management, Increasing Time and impress your audience. This template can be altered and modified as per your expectations. So, grab it now.
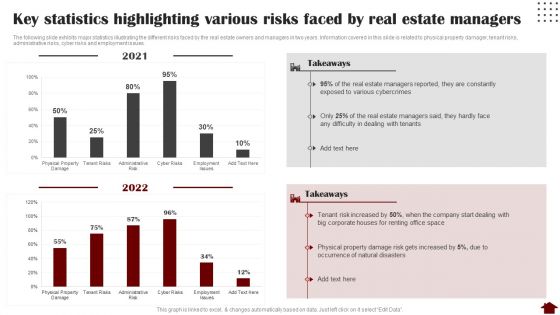
Key Statistics Highlighting Various Risks Faced By Real Estate Managers Mockup PDF
The following slide exhibits major statistics illustrating the different risks faced by the real estate owners and managers in two years. Information covered in this slide is related to physical property damager, tenant risks, administrative risks, cyber risks and employment issues. Deliver and pitch your topic in the best possible manner with this Key Statistics Highlighting Various Risks Faced By Real Estate Managers Mockup PDF. Use them to share invaluable insights on Key Statistics Highlighting, Various Risks, Real Estate Managers and impress your audience. This template can be altered and modified as per your expectations. So, grab it now.

Investment Project KPI Dashboard For Construction Analytics Background PDF
This slide illustrates construction dashboard for improving capital project outcomes. It also include KPIs such as projects completion, schedule performance index, consumer price index, project status, cost breakdown, etc. Pitch your topic with ease and precision using this Investment Project KPI Dashboard For Construction Analytics Background PDF. This layout presents information on Cost Breakdown, Completion, Progress. It is also available for immediate download and adjustment. So, changes can be made in the color, design, graphics or any other component to create a unique layout.

Key Program Kpis For Project Management Ppt Slides Graphic Images PDF
The following slide highlights the key program metrics for program management illustrating key headings which includes active program, total budget, budget utilized, budget utilization, total program, completed program, overdue program and completion status. Pitch your topic with ease and precision using this Key Program Kpis For Project Management Ppt Slides Graphic Images PDF. This layout presents information on Program Budget, Active Program, Total Budget. It is also available for immediate download and adjustment. So, changes can be made in the color, design, graphics or any other component to create a unique layout.
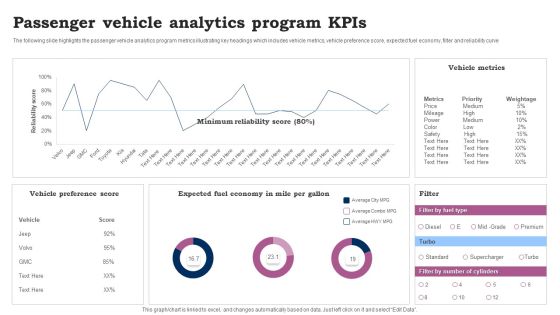
Passenger Vehicle Analytics Program Kpis Ppt Pictures Demonstration PDF
The following slide highlights the passenger vehicle analytics program metrics illustrating key headings which includes vehicle metrics, vehicle preference score, expected fuel economy, filter and reliability curve. Showcasing this set of slides titled Passenger Vehicle Analytics Program Kpis Ppt Pictures Demonstration PDF. The topics addressed in these templates are Vehicle Preference Score, Vehicle Metrics, Expected Fuel Economy. All the content presented in this PPT design is completely editable. Download it and make adjustments in color, background, font etc. as per your unique business setting.
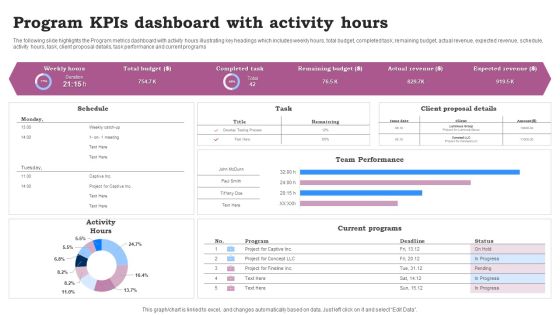
Program Kpis Dashboard With Activity Hours Ppt Infographics Clipart Images PDF
The following slide highlights the Program metrics dashboard with activity hours illustrating key headings which includes weekly hours, total budget, completed task, remaining budget, actual revenue, expected revenue, schedule, activity hours, task, client proposal details, task performance and current programs. Pitch your topic with ease and precision using this Program Kpis Dashboard With Activity Hours Ppt Infographics Clipart Images PDF. This layout presents information on Team Performance, Current Programs, Activity Hours. It is also available for immediate download and adjustment. So, changes can be made in the color, design, graphics or any other component to create a unique layout.
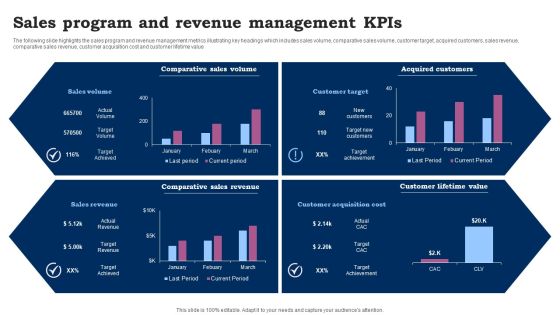
Sales Program And Revenue Management Kpis Ppt Outline Slide Download PDF
The following slide highlights the sales program and revenue management metrics illustrating key headings which includes sales volume, comparative sales volume, customer target, acquired customers, sales revenue, comparative sales revenue, customer acquisition cost and customer lifetime value. Showcasing this set of slides titled Sales Program And Revenue Management Kpis Ppt Outline Slide Download PDF. The topics addressed in these templates are Comparative Sales Volume, Acquired Customers, Comparative Sales Revenue. All the content presented in this PPT design is completely editable. Download it and make adjustments in color, background, font etc. as per your unique business setting.
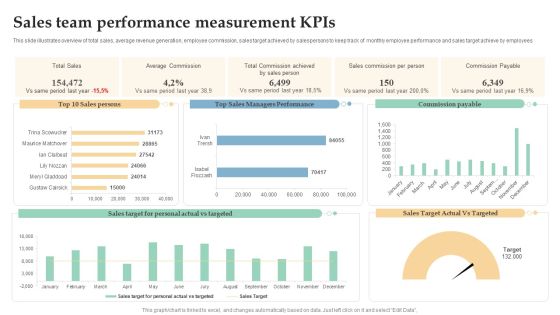
Sales Team Performance Measurement Kpis Ppt Professional Templates PDF
This slide illustrates overview of total sales, average revenue generation, employee commission, sales target achieved by salespersons to keep track of monthly employee performance and sales target achieve by employees. Showcasing this set of slides titled Sales Team Performance Measurement Kpis Ppt Professional Templates PDF. The topics addressed in these templates are Total Sales, Average Commission, Sales Commission, Per Person. All the content presented in this PPT design is completely editable. Download it and make adjustments in color, background, font etc. as per your unique business setting.

Key Statistics Highlighting Various Risks Faced By Real Managing Commercial Property Risks Elements PDF
The following slide exhibits major statistics illustrating the different risks faced by the real estate owners and managers in two years. Information covered in this slide is related to physical property damager, tenant risks, administrative risks, cyber risks and employment issues. Deliver and pitch your topic in the best possible manner with this Key Statistics Highlighting Various Risks Faced By Real Managing Commercial Property Risks Elements PDF. Use them to share invaluable insights on Various Cybercrimes, Estate Managers, Natural Disasters and impress your audience. This template can be altered and modified as per your expectations. So, grab it now.

Statistics Highlighting Call Center Business Success Measurement Introduction PDF
The following slide illustrates facts and figures for multiple success measures of service support teams. It provides information about customer effort score, CSAT customer satisfaction, NPS net promoter score, etc. Showcasing this set of slides titled Statistics Highlighting Call Center Business Success Measurement Introduction PDF. The topics addressed in these templates are BPO Managers, Customer Satisfaction Rate, Biggest Measure. All the content presented in this PPT design is completely editable. Download it and make adjustments in color, background, font etc. as per your unique business setting.
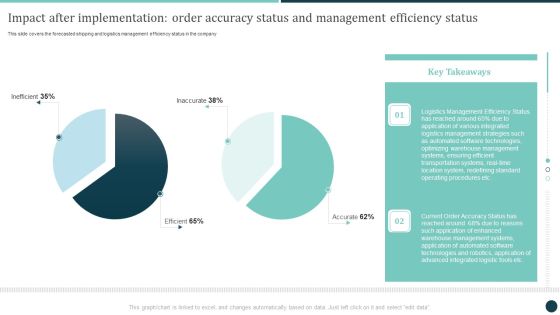
Impact After Implementation Order Accuracy Status And Management Efficiency Status Demonstration PDF
Slidegeeks is here to make your presentations a breeze with Impact After Implementation Order Accuracy Status And Management Efficiency Status Demonstration PDF With our easytouse and customizable templates, you can focus on delivering your ideas rather than worrying about formatting. With a variety of designs to choose from, youre sure to find one that suits your needs. And with animations and unique photos, illustrations, and fonts, you can make your presentation pop. So whether youre giving a sales pitch or presenting to the board, make sure to check out Slidegeeks first.

Business Overview Of Mid Term Earning Potential And Expectations Slides PDF
This slide illustrates business overview and profit potential of a corporation. It includes group revenue shares, business revenue, EBITDA, volume growth, profit growth and operating margins etc. Showcasing this set of slides titled Business Overview Of Mid Term Earning Potential And Expectations Slides PDF. The topics addressed in these templates are Value Growth, Profit Growth, Operating Margin. All the content presented in this PPT design is completely editable. Download it and make adjustments in color, background, font etc. as per your unique business setting.

Corporate Earning Potential With Key Drivers Summary PDF
This slide illustrates profit earnings of a corporation with expected profit in the current year. It includes yearly profit earned for five years and key drivers working behind that profit. Pitch your topic with ease and precision using this Corporate Earning Potential With Key Drivers Summary PDF. This layout presents information on Working Capital, Improved Profits, Capital. It is also available for immediate download and adjustment. So, changes can be made in the color, design, graphics or any other component to create a unique layout.

Dashboard Showing Earning Potential From Corporate Trends Demonstration PDF
This slide illustrates facts and figures related to five years of corporate financial figures for evaluation of expected profit. It includes yearly revenue and EBITDA, PAT and PAT margin, net worth and return on net worth etc. Showcasing this set of slides titled Dashboard Showing Earning Potential From Corporate Trends Demonstration PDF. The topics addressed in these templates are Potential From Corporate Trends, Dashboard Showing Earning. All the content presented in this PPT design is completely editable. Download it and make adjustments in color, background, font etc. as per your unique business setting.

Evaluation Of Earning Potential From Gross Earning And Ebit Dashboard Professional PDF
This slide illustrates finding profit potential of a corporation while studying gross profit margin and EBITDA. It includes key operating expenditure and gross profit margin, EBITDA dollar MM and EBITDA percent margin etc. Showcasing this set of slides titled Evaluation Of Earning Potential From Gross Earning And Ebit Dashboard Professional PDF. The topics addressed in these templates are Evaluation Of Earning Potential, Gross Earning, Ebit Dashboard. All the content presented in this PPT design is completely editable. Download it and make adjustments in color, background, font etc. as per your unique business setting.

International Business Revenue And Earning Potential Guidelines PDF
This slide illustrates finding profit potential from evaluation of international business done by the corporation. It includes international business revenue share percent, international business revenue in USD BB, share of group revenues etc. Pitch your topic with ease and precision using this International Business Revenue And Earning Potential Guidelines PDF. This layout presents information on Potential Organic Growth, Supply Chain. It is also available for immediate download and adjustment. So, changes can be made in the color, design, graphics or any other component to create a unique layout.
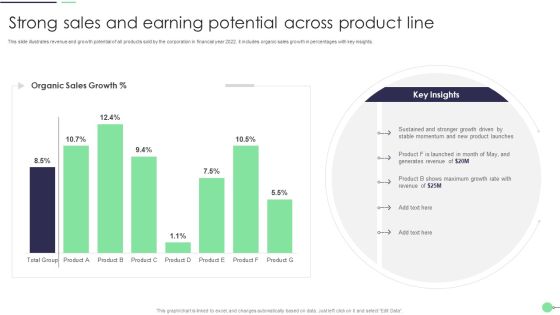
Strong Sales And Earning Potential Across Product Line Professional PDF
This slide illustrates revenue and growth potential of all products sold by the corporation in financial year 2022. it includes organic sales growth in percentages with key insights. Showcasing this set of slides titled Strong Sales And Earning Potential Across Product Line Professional PDF. The topics addressed in these templates are Product Launches, Generates Revenue, Growth Rate. All the content presented in this PPT design is completely editable. Download it and make adjustments in color, background, font etc. as per your unique business setting.

Sustained Sales Growth And Earning Potential During Covid 19 Pandemic Demonstration PDF
This slide illustrates sustained revenue and profit growth during consistent lockdowns in pandemic. It includes graphical representation of retail and out of home business with key insights etc. Pitch your topic with ease and precision using this Sustained Sales Growth And Earning Potential During Covid 19 Pandemic Demonstration PDF. This layout presents information on Revenue Growth, Business, Retail. It is also available for immediate download and adjustment. So, changes can be made in the color, design, graphics or any other component to create a unique layout.

Dashboard Highlighting Internal Hiring Sources And Costs Ppt Show Templates PDF
This slide illustrates dashboard for recruiting employees internally. It provides information about sourcing status, yield ratio, hiring pipeline, positions filled, recruitment costs, hire cost per team, etc. Showcasing this set of slides titled Dashboard Highlighting Internal Hiring Sources And Costs Ppt Show Templates PDF. The topics addressed in these templates are Hiring Pipeline, Sourcing Status, Recruitment Costs. All the content presented in this PPT design is completely editable. Download it and make adjustments in color, background, font etc. as per your unique business setting.

Creating New Product Launch Campaign Strategy Analyzing Sales Performance Over Last Three Years Structure PDF
Following slide illustrates sales performance highlights of the firm in FY18, FY19 and FY20. Category 4 is the most selling product category over the three years. If your project calls for a presentation, then Slidegeeks is your go to partner because we have professionally designed, easy to edit templates that are perfect for any presentation. After downloading, you can easily edit Creating New Product Launch Campaign Strategy Analyzing Sales Performance Over Last Three Years Structure PDF and make the changes accordingly. You can rearrange slides or fill them with different images. Check out all the handy templates.

Creating New Product Launch Campaign Strategy Dashboard To Measure Sales Rep Performance Introduction PDF
This slide illustrates sales representative performance measurement dashboard with key metrics such as average first contact resolution rate, occupancy rate, NPS and top agents by solved tickets. Make sure to capture your audiences attention in your business displays with our gratis customizable Creating New Product Launch Campaign Strategy Dashboard To Measure Sales Rep Performance Introduction PDF. These are great for business strategies, office conferences, capital raising or task suggestions. If you desire to acquire more customers for your tech business and ensure they stay satisfied, create your own sales presentation with these plain slides.
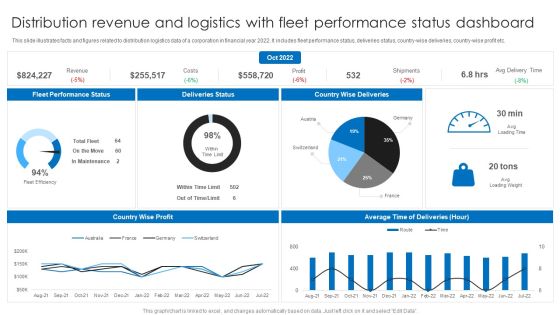
Distribution Revenue And Logistics With Fleet Performance Status Dashboard Ppt Layouts Background PDF
This slide illustrates facts and figures related to distribution logistics data of a corporation in financial year 2022. It includes fleet performance status, deliveries status, country-wise deliveries, country-wise profit etc. Pitch your topic with ease and precision using this Distribution Revenue And Logistics With Fleet Performance Status Dashboard Ppt Layouts Background PDF. This layout presents information on Deliveries Status, Country Wise Deliveries, Fleet Performance Status. It is also available for immediate download and adjustment. So, changes can be made in the color, design, graphics or any other component to create a unique layout.

Brand Value Measuring KPI Dashboard Guide To Understand Evaluate And Enhance Brand Value Slides PDF
Following slide illustrates KPI dashboard to measure brand value. KPIs covered are brand value and percentage change, brand value over time, most followed brands on social media.Take your projects to the next level with our ultimate collection of Brand Value Measuring KPI Dashboard Guide To Understand Evaluate And Enhance Brand Value Slides PDF. Slidegeeks has designed a range of layouts that are perfect for representing task or activity duration, keeping track of all your deadlines at a glance. Tailor these designs to your exact needs and give them a truly corporate look with your own brand colors they all make your projects stand out from the rest

30 60 90 Days Sales And Promotion Planning With Performance Analysis Guidelines PDF
The following slide illustrates the step by step sales and marketing plan to attain the business objectives. It also includes the sales performance evaluation by target achieved in the past 30 60 90 days. Showcasing this set of slides titled 30 60 90 Days Sales And Promotion Planning With Performance Analysis Guidelines PDF. The topics addressed in these templates are 30 60 90 Days, Sales Promotion Planning, Performance Analysis. All the content presented in this PPT design is completely editable. Download it and make adjustments in color, background, font etc. as per your unique business setting.
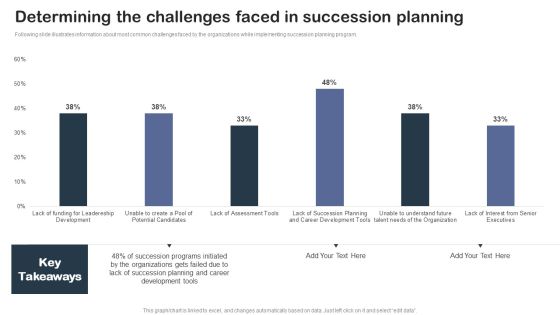
Staff Succession Planning And Development Determining The Challenges Faced Introduction PDF
Following slide illustrates information about most common challenges faced by the organizations while implementing succession planning program.Present like a pro with Staff Succession Planning And Development Determining The Challenges Faced Introduction PDF Create beautiful presentations together with your team, using our easy-to-use presentation slides. Share your ideas in real-time and make changes on the fly by downloading our templates. So whether you are in the office, on the go, or in a remote location, you can stay in sync with your team and present your ideas with confidence. With Slidegeeks presentation got a whole lot easier. Grab these presentations today.

Buy Side Advisory Services In M And A Mergers And Acquisitions By Sector Introduction PDF
The slide illustrates the graph of number of merger and acquisition deals by sector that the company has completed in last five years. It also covers key facts CAGR growth, deal value etc. related to merger and acquisition deals of the company.There are so many reasons you need a Buy Side Advisory Services In M And A Mergers And Acquisitions By Sector Introduction PDF. The first reason is you can not spend time making everything from scratch, Thus, Slidegeeks has made presentation templates for you too. You can easily download these templates from our website easily.
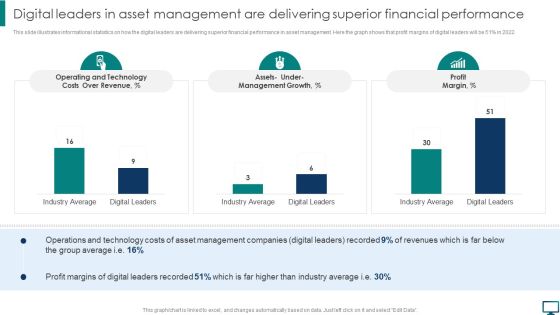
Digital Leaders In Asset Management Are Delivering Superior Financial Performance Topics PDF
This slide illustrates informational statistics on how the digital leaders are delivering superior financial performance in asset management. Here the graph shows that profit margins of digital leaders will be 51 percent in 2022. Take your projects to the next level with our ultimate collection of Digital Leaders In Asset Management Are Delivering Superior Financial Performance Topics PDF. Slidegeeks has designed a range of layouts that are perfect for representing task or activity duration, keeping track of all your deadlines at a glance. Tailor these designs to your exact needs and give them a truly corporate look with your own brand colors they will make your projects stand out from the rest.

Data Augmentation Dashboard For Lead Generation Ppt Pictures Deck PDF
This slide illustrates a data enrichment dashboard that helps shorten the customer journey for lead generation. It also includes KPIs such as leads enriched against target, lead stage, user, and lead created by user. Showcasing this set of slides titled Data Augmentation Dashboard For Lead Generation Ppt Pictures Deck PDF. The topics addressed in these templates are Leads Enriched against, Target, Leads Enriched, Lead Stage, Leads Created User, Leads Enriched User. All the content presented in this PPT design is completely editable. Download it and make adjustments in color, background, font etc. as per your unique business setting.

Cost And Schedule Variance Analysis In Earned Value Management Ppt Pictures Design Ideas PDF
This slide represents cost and schedule variance analysis in earned value management illustrating planned value, earned value, actual cost etc used for indicating cost performance index. Showcasing this set of slides titled Cost And Schedule Variance Analysis In Earned Value Management Ppt Pictures Design Ideas PDF. The topics addressed in these templates are CPI Indicates, Financial Effectiveness, Efficiency Project. All the content presented in this PPT design is completely editable. Download it and make adjustments in color, background, font etc. as per your unique business setting.

Business Threats Landscape Dashboard With Cyber Attacks Analysis Ppt Summary Brochure PDF
This slide illustrates risk landscape dashboard with cyber attacks analysis which contains malware attack frequency, country wise attacks, top 10 attacks, etc. It can assist IT managers in analyzing top threats so that they can be dealt with proper efficiency. Pitch your topic with ease and precision using this Business Threats Landscape Dashboard With Cyber Attacks Analysis Ppt Summary Brochure PDF. This layout presents information on Malware Attack Frequency, Every Minute, Every Second. It is also available for immediate download and adjustment. So, changes can be made in the color, design, graphics or any other component to create a unique layout.

Statistics Depicting Risk Magnitude In Business Threats Landscape Ppt File Example Introduction PDF
This slide illustrates statistics which highlight magnitude of threats faced by various business units in a risk landscape. It entails information about cybersecurity, data privacy, digital innovation, cloud computing, transformational projects, mergers and acquisition and regulatory environment. Pitch your topic with ease and precision using this Statistics Depicting Risk Magnitude In Business Threats Landscape Ppt File Example Introduction PDF. This layout presents information on Business Units, Risk Magnitude, Business Landscape. It is also available for immediate download and adjustment. So, changes can be made in the color, design, graphics or any other component to create a unique layout.
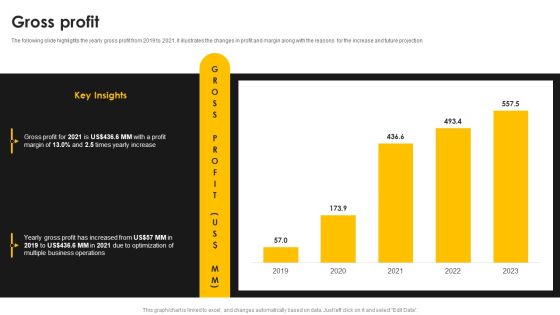
Kantar Consulting Company Outline Gross Profit Template PDF
The following slide highlights the yearly gross profit from 2019 to 2021. it illustrates the changes in profit and margin along with the reasons for the increase and future projection. Take your projects to the next level with our ultimate collection of Kantar Consulting Company Outline Gross Profit Template PDF. Slidegeeks has designed a range of layouts that are perfect for representing task or activity duration, keeping track of all your deadlines at a glance. Tailor these designs to your exact needs and give them a truly corporate look with your own brand colors they will make your projects stand out from the rest.

Cloud Computing Project Administration Dashboard With Change Requests Ppt Layouts Background Images PDF
Mentioned slide illustrates a comprehensive cloud project management. It covers various metrics such as planned and actual spending, risk count, issues count, change requests, overall project progress, etc. Showcasing this set of slides titled Cloud Computing Project Administration Dashboard With Change Requests Ppt Layouts Background Images PDF. The topics addressed in these templates are Project Financials, Project Spend, Project Progress. All the content presented in this PPT design is completely editable. Download it and make adjustments in color, background, font etc. as per your unique business setting.

Dashboard Of Product Sales Growth And Gross Analysis Analysis Ppt Styles Good PDF
The following slide highlights the dashboard o product sales growth and gross margin analysis illustrating key headings which includes sales by product, sales by month, sales product by margin, sales product by quantity, gross margin growth, gross margin trend and product inventory. Showcasing this set of slides titled Dashboard Of Product Sales Growth And Gross Analysis Analysis Ppt Styles Good PDF. The topics addressed in these templates are Gross Margin Growth, Gross Margin Trend, Product Inventory. All the content presented in this PPT design is completely editable. Download it and make adjustments in color, background, font etc. as per your unique business setting.
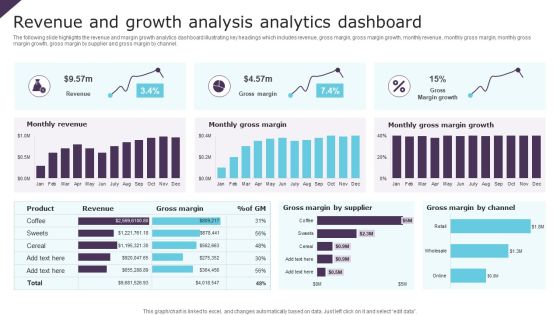
Revenue And Growth Analysis Analytics Dashboard Ppt Infographic Template Brochure PDF
The following slide highlights the revenue and margin growth analytics dashboard illustrating key headings which includes revenue, gross margin, gross margin growth, monthly revenue, monthly gross margin, monthly gross margin growth, gross margin by supplier and gross margin by channel. Pitch your topic with ease and precision using this Revenue And Growth Analysis Analytics Dashboard Ppt Infographic Template Brochure PDF. This layout presents information on Monthly Revenue, Monthly Gross Margin, Gross Margin Growth. It is also available for immediate download and adjustment. So, changes can be made in the color, design, graphics or any other component to create a unique layout.

Sales Revenue And Gross Growth Analysis Dashboard Ppt Inspiration Background Image PDF
The following slide highlights the sales revenue and gross margin growth dashboard illustrating key headings which includes gross margin, total revenue, total client, total product, gross margin trend, gross margin growth, monthly gross margin, monthly revenue, yearly revenue growth and gross margin growth trend by product. Showcasing this set of slides titled Sales Revenue And Gross Growth Analysis Dashboard Ppt Inspiration Background Image PDF. The topics addressed in these templates are Gross Margin, Total Revenue, Total Clients. All the content presented in this PPT design is completely editable. Download it and make adjustments in color, background, font etc. as per your unique business setting.
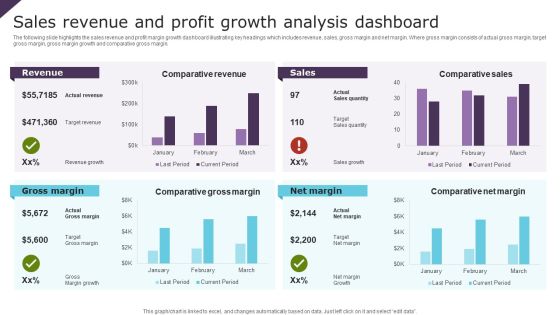
Sales Revenue And Profit Growth Analysis Dashboard Ppt Portfolio Slide PDF
The following slide highlights the sales revenue and profit margin growth dashboard illustrating key headings which includes revenue, sales, gross margin and net margin. Where gross margin consists of actual gross margin, target gross margin, gross margin growth and comparative gross margin. Showcasing this set of slides titled Sales Revenue And Profit Growth Analysis Dashboard Ppt Portfolio Slide PDF. The topics addressed in these templates are Revenue, Sales, Gross Margin, Net Margin. All the content presented in this PPT design is completely editable. Download it and make adjustments in color, background, font etc. as per your unique business setting.
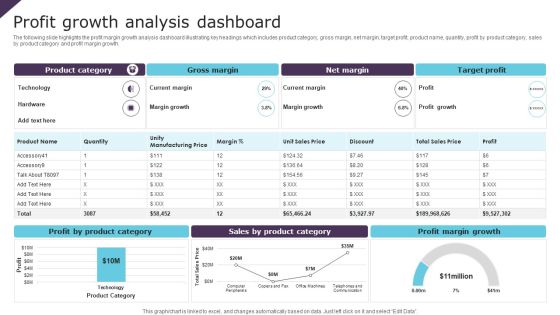
Profit Growth Analysis Dashboard Ppt PowerPoint Presentation File Design Templates PDF
The following slide highlights the profit margin growth analysis dashboard illustrating key headings which includes product category, gross margin, net margin, target profit, product name, quantity, profit by product category, sales by product category and profit margin growth. Showcasing this set of slides titled Profit Growth Analysis Dashboard Ppt PowerPoint Presentation File Design Templates PDF. The topics addressed in these templates are Gross Margin, Net Margin, Target Profit. All the content presented in this PPT design is completely editable. Download it and make adjustments in color, background, font etc. as per your unique business setting.

Customer NPS Metric Statistics Of Banking Industry Ppt Styles Microsoft PDF
This slide illustrates statistics of net promoter score NPS in banking industry. It provides information about summary, personal banking, business banking and wealth management. Pitch your topic with ease and precision using this Customer NPS Metric Statistics Of Banking Industry Ppt Styles Microsoft PDF. This layout presents information on Summary, Personal Banking, Business Banking, Wealth Management. It is also available for immediate download and adjustment. So, changes can be made in the color, design, graphics or any other component to create a unique layout.

Sales Performance Monitoring Dashboard With Revenue And Cost Metric Ppt Portfolio Good PDF
This slide illustrates sales revenue and costs tracking dashboard. It provides information about sales count, profit, expenses, sales revenue, expenses breakdown, up or cross selling, etc. Showcasing this set of slides titled Sales Performance Monitoring Dashboard With Revenue And Cost Metric Ppt Portfolio Good PDF. The topics addressed in these templates are Sales Count, Revenue, Profit, Expenses. All the content presented in this PPT design is completely editable. Download it and make adjustments in color, background, font etc. as per your unique business setting.

Key Business Metrics Dashboard Company Process Administration And Optimization Playbook Infographics PDF
The following dashboard displays the key business metrics such as new customers, profit, revenue per customer, and weekly revenue. Slidegeeks is here to make your presentations a breeze with Key Business Metrics Dashboard Company Process Administration And Optimization Playbook Infographics PDF With our easy-to-use and customizable templates, you can focus on delivering your ideas rather than worrying about formatting. With a variety of designs to choose from, you are sure to find one that suits your needs. And with animations and unique photos, illustrations, and fonts, you can make your presentation pop. So whether you are giving a sales pitch or presenting to the board, make sure to check out Slidegeeks first.
 Home
Home