AI PPT Maker
Templates
PPT Bundles
Design Services
Business PPTs
Business Plan
Management
Strategy
Introduction PPT
Roadmap
Self Introduction
Timelines
Process
Marketing
Agenda
Technology
Medical
Startup Business Plan
Cyber Security
Dashboards
SWOT
Proposals
Education
Pitch Deck
Digital Marketing
KPIs
Project Management
Product Management
Artificial Intelligence
Target Market
Communication
Supply Chain
Google Slides
Research Services
 One Pagers
All Categories
-
Home
- Customer Favorites
- Technology Costs
Technology Costs

Business Management Strategy Survey To Boost Sales Summary PDF
This slide illustrate survey result of various promotional tactics used by top 1000 multi national companies to promote their product and services. it includes promotional strategies such as online advertisement, business directory, social media platforms etc. Pitch your topic with ease and precision using this Business Management Strategy Survey To Boost Sales Summary PDF. This layout presents information on Advertisement Strategy, Organization, Social Median. It is also available for immediate download and adjustment. So, changes can be made in the color, design, graphics or any other component to create a unique layout.

Customer Acquisition Plan Marketing Strategy Tools Information PDF
This slide illustrate success rate of various platform used for attracting and acquiring customer. It includes marketing tools such as website, email marketing, word of mouth communication, print advertisement, social media platforms etc. Showcasing this set of slides titled Customer Acquisition Plan Marketing Strategy Tools Information PDF. The topics addressed in these templates are Strategies, Customers, Marketing. All the content presented in this PPT design is completely editable. Download it and make adjustments in color, background, font etc. as per your unique business setting.

Yearly Sales Assessment Dashboard With Total Revenue Introduction PDF
This slide represent annual sales review dashboard of various products sold by an organization through various selling platform with comparison and product wise revenue generated .It includes product, unit sold and total revenue. Showcasing this set of slides titled Yearly Sales Assessment Dashboard With Total Revenue Introduction PDF. The topics addressed in these templates are Product Sold, Inventory Outstanding, Average. All the content presented in this PPT design is completely editable. Download it and make adjustments in color, background, font etc. as per your unique business setting.

Yearly Sales Assessment Of Products With Bar Graph Structure PDF
This slide represent graphical presentation of annual sales review of various products sold by an organization within 5 years showing difference in revenue generated .It shows report of following years 2018,2019,2020,and 2021. Showcasing this set of slides titled Yearly Sales Assessment Of Products With Bar Graph Structure PDF. The topics addressed in these templates are Product, Sales Of Product, Product Demand. All the content presented in this PPT design is completely editable. Download it and make adjustments in color, background, font etc. as per your unique business setting.

Comparative Health And Risk Key Performance Indicator Dashboard Ppt Portfolio Slide PDF
The slide highlights the comparative health and safety key performance indicator dashboard. It shows current year and previous events, safety incident classification, safety cases by place, map and safety consequence. Showcasing this set of slides titled Comparative Health And Risk Key Performance Indicator Dashboard Ppt Portfolio Slide PDF. The topics addressed in these templates are Safety Consequence, Safety Incidents Classification, Map. All the content presented in this PPT design is completely editable. Download it and make adjustments in color, background, font etc. as per your unique business setting.

Risk Key Performance Indicator Dashboard For Manufacturing Company Ppt Gallery Graphics Design PDF
The following slide highlights the safety key performance indicator dashboard for manufacturing company. It showcases safety incident per employee, total number of cases, safety events avoided, accumulated total and safety incidents. Pitch your topic with ease and precision using this Risk Key Performance Indicator Dashboard For Manufacturing Company Ppt Gallery Graphics Design PDF. This layout presents information on Safety Incidents, Safety Incident Avoided, Safety Incident Accumulated. It is also available for immediate download and adjustment. So, changes can be made in the color, design, graphics or any other component to create a unique layout.
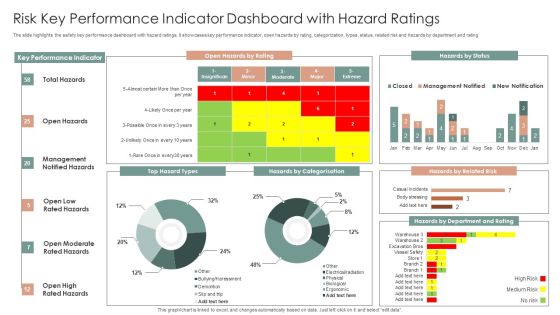
Risk Key Performance Indicator Dashboard With Hazard Ratings Ppt Layouts Slideshow PDF
The slide highlights the safety key performance dashboard with hazard ratings. It showcases key performance indicator, open hazards by rating, categorization, types, status, related risk and hazards by department and rating. Showcasing this set of slides titled Risk Key Performance Indicator Dashboard With Hazard Ratings Ppt Layouts Slideshow PDF. The topics addressed in these templates are Key Performance Indicator, Open Hazards, Hazards By Status. All the content presented in this PPT design is completely editable. Download it and make adjustments in color, background, font etc. as per your unique business setting.

KPI Dashboard To Track Effectiveness Of Real Estate Business Performance Slides PDF
The following slide exhibits key performance indicator KPI dashboard which can be used to measure the financial performance of the real estate company. It covers various kpis such as sales vs target per agent, top 10 projects, top 5 agencies etc. Deliver an awe inspiring pitch with this creative KPI Dashboard To Track Effectiveness Of Real Estate Business Performance Slides PDF bundle. Topics like KPI Dashboard, Track Effectiveness, Real Estate Business Performance can be discussed with this completely editable template. It is available for immediate download depending on the needs and requirements of the user.

Companies Share In Development Of Healthcare Devices Ppt Summary Infographics PDF
This slide shows the market share of various companies that manufacture medical products to identify market leader. It includes companies nova, med, 3N, strike corp., Dana corp., box int, and world med. Showcasing this set of slides titled Companies Share In Development Of Healthcare Devices Ppt Summary Infographics PDF. The topics addressed in these templates are Johnson And Global, High Quality Products, Higher Production Rate. All the content presented in this PPT design is completely editable. Download it and make adjustments in color, background, font etc. as per your unique business setting.

Analyzing Marketing Industry Key Challenges Survey Ppt Inspiration Skills PDF
This slide demonstrate survey of 500 internet marketing agencies specialized in paid search from all over the world. It includes hurdles such as getting new clients, retaining current customers, time management etc. Showcasing this set of slides titled Analyzing Marketing Industry Key Challenges Survey Ppt Inspiration Skills PDF. The topics addressed in these templates are Online Marketing Industry, Time Management, Online Marketing Industry. All the content presented in this PPT design is completely editable. Download it and make adjustments in color, background, font etc. as per your unique business setting.
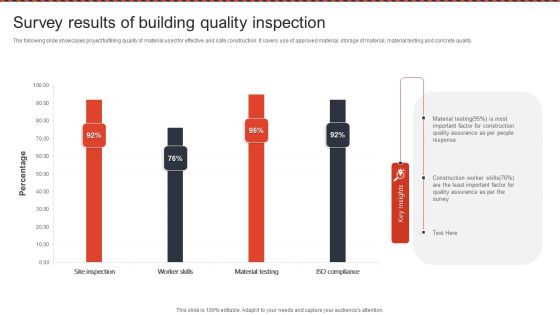
Survey Results Of Building Quality Inspection Ppt PowerPoint Presentation File Show PDF
The following slide showcases project fulfilling quality of material used for effective and safe construction. It covers use of approved material, storage of material, material testing and concrete quality. Pitch your topic with ease and precision using this Survey Results Of Building Quality Inspection Ppt PowerPoint Presentation File Show PDF. This layout presents information on Material Testing, Quality Assurance, Construction Worker Skills. It is also available for immediate download and adjustment. So, changes can be made in the color, design, graphics or any other component to create a unique layout.

Strategic Financial Performance Review And Evaluation Ppt Layouts Styles PDF
This slide shows financial performance assessment to identify potential problems or opportunities to achieve organizational goals. It includes various elements such as quick ratio, cash balance, days sales and payable outstanding. Showcasing this set of slides titled Strategic Financial Performance Review And Evaluation Ppt Layouts Styles PDF. The topics addressed in these templates are Cash Balance, Quick Ratio, Current Ratio. All the content presented in this PPT design is completely editable. Download it and make adjustments in color, background, font etc. as per your unique business setting.

COVID 19 Testing Supplies Survey Format Ppt Infographic Template Slide PDF
This slide shows the results of lab workers who are conducting the coronavirus tests through the prescribed supplies test kits, swabs, reagents and PPE It also displays the results of three different types of laboratories commercial and reference, hospital and public health , etc. Showcasing this set of slides titled COVID 19 Testing Supplies Survey Format Ppt Infographic Template Slide PDF. The topics addressed in these templates are All Laboratories, Commercial And Reference, Hospital Associated. All the content presented in this PPT design is completely editable. Download it and make adjustments in color, background, font etc. as per your unique business setting.
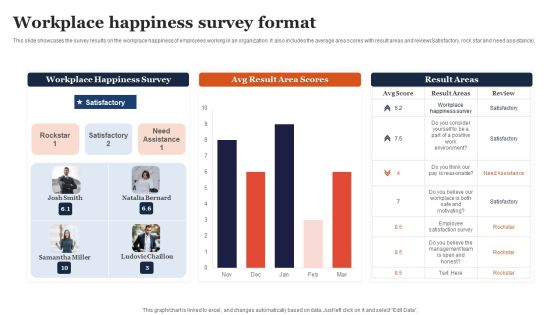
Workplace Happiness Survey Format Ppt Model Brochure PDF
This slide showcases the survey results on the workplace happiness of employees working in an organization. It also includes the average area scores with result areas and review Satisfactory, rock star and need. Pitch your topic with ease and precision using this Workplace Happiness Survey Format Ppt Model Brochure PDF. This layout presents information on Workplace Happiness Survey, Avg Result, Area Scores. It is also available for immediate download and adjustment. So, changes can be made in the color, design, graphics or any other component to create a unique layout.

Cash Flow Metrics To Measure Firm Operations Effectiveness Ppt Outline Infographic Template PDF
This slide showcases yearly cash conversion cycle to determine companys working capital management. It includes DSO, DIO, DPO and CCC that measure the average number of days organization takes to collect payment and pay bills. Pitch your topic with ease and precision using this Cash Flow Metrics To Measure Firm Operations Effectiveness Ppt Outline Infographic Template PDF. This layout presents information on Cash Conversion Cycle, 2019 To 2022, Cash Flow. It is also available for immediate download and adjustment. So, changes can be made in the color, design, graphics or any other component to create a unique layout.
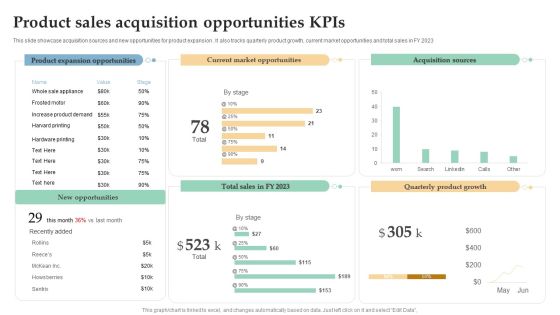
Product Sales Acquisition Opportunities Kpis Ppt Pictures Slide PDF
This slide showcase acquisition sources and new opportunities for product expansion . It also tracks quarterly product growth, current market opportunities and total sales in FY 2023. Pitch your topic with ease and precision using this Product Sales Acquisition Opportunities Kpis Ppt Pictures Slide PDF. This layout presents information on Product Expansion Opportunities, Current Market Opportunities, Acquisition Sources. It is also available for immediate download and adjustment. So, changes can be made in the color, design, graphics or any other component to create a unique layout.
Product Sales Kpis With Website Traffic Ppt Icon Smartart
This slide showcase different strategies through which product is marketize to increase the product reach to the consumer and increase the market share. It includes total product revenue, sales comparison of online and in store sales, marketing campaigning and website traffic. Showcasing this set of slides titled Product Sales Kpis With Website Traffic Ppt Icon Smartart. The topics addressed in these templates are Website Traffic, Product Sales Increment, Total Product Revenue. All the content presented in this PPT design is completely editable. Download it and make adjustments in color, background, font etc. as per your unique business setting.

Sales Product Performance And Growth Kpis Ppt Layouts Mockup PDF
This slide displays a breakdown of sales results by particular product to monitor product demand and also to project product growth in the market. It includes units sold, annual income, and product revenue. Pitch your topic with ease and precision using this Sales Product Performance And Growth Kpis Ppt Layouts Mockup PDF. This layout presents information on Monthly Revenue, Product, Product Units. It is also available for immediate download and adjustment. So, changes can be made in the color, design, graphics or any other component to create a unique layout.
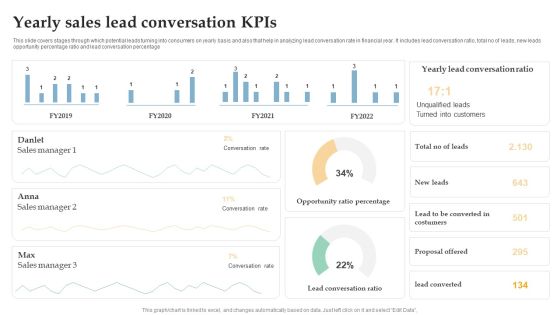
Yearly Sales Lead Conversation Kpis Ppt Inspiration Brochure PDF
This slide covers stages through which potential leads turning into consumers on yearly basis and also that help in analyzing lead conversation rate in financial year. It includes lead conversation ratio, total no of leads, new leads opportunity percentage ratio and lead conversation percentage. Pitch your topic with ease and precision using this Yearly Sales Lead Conversation Kpis Ppt Inspiration Brochure PDF. This layout presents information on Sales Manager, Conversation Rate, Opportunity Ratio Percentage. It is also available for immediate download and adjustment. So, changes can be made in the color, design, graphics or any other component to create a unique layout.
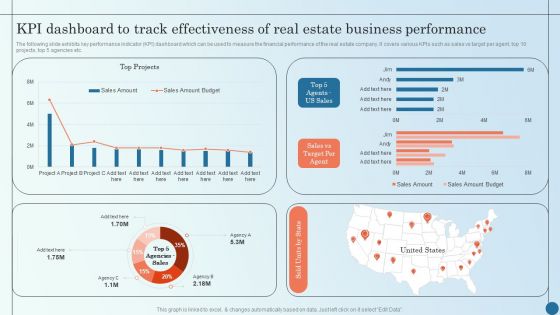
KPI Dashboard To Track Effectiveness Of Real Estate Business Managing Commercial Property Risks Demonstration PDF
The following slide exhibits key performance indicator KPI dashboard which can be used to measure the financial performance of the real estate company. It covers various KPIs such as sales vs target per agent, top 10 projects, top 5 agencies etc.Deliver an awe inspiring pitch with this creative KPI Dashboard To Track Effectiveness Of Real Estate Business Managing Commercial Property Risks Demonstration PDF bundle. Topics like Kpi Dashboard, Track Effectiveness, Estate Business can be discussed with this completely editable template. It is available for immediate download depending on the needs and requirements of the user.

Consumer Journey Mapping Techniques Dashboard For Tracking Customer Service Team Performance Summary PDF
This slide covers the KPI dashboard for analyzing the performance of client support department. It includes metrics such as first call resolution, unresolved calls, average response rate, the best day to call, average time to solve issues, etc. Pitch your topic with ease and precision using this Consumer Journey Mapping Techniques Dashboard For Tracking Customer Service Team Performance Summary PDF. This layout presents information on Dashboard For Tracking Customer, Service Team Performance. It is also available for immediate download and adjustment. So, changes can be made in the color, design, graphics or any other component to create a unique layout.

Consumer Journey Mapping Techniques Dashboard For Tracking Digital Content Performance Clipart PDF
This slide covers the KPI dashboard for analyzing online content. It includes metrics such as blog visitors, pageviews, newsletter conversion rate, new signups, new customers, etc. Showcasing this set of slides titled Consumer Journey Mapping Techniques Dashboard For Tracking Digital Content Performance Clipart PDF. The topics addressed in these templates are Purchase Amount, Customers, Tracking Digital Content Performance. All the content presented in this PPT design is completely editable. Download it and make adjustments in color, background, font etc. as per your unique business setting.

Consumer Journey Mapping Techniques Dashboard For Tracking Social Media Platforms Introduction PDF
This slide covers the KPI dashboard for analyzing social media channels. It includes metrics such as social media followers, Facebook daily reach, Facebook engaged users and page impressions, etc. Pitch your topic with ease and precision using this Consumer Journey Mapping Techniques Dashboard For Tracking Social Media Platforms Introduction PDF. This layout presents information on Linkedin Key Metrics, Social Media Followers, Awareness. It is also available for immediate download and adjustment. So, changes can be made in the color, design, graphics or any other component to create a unique layout.

Dashboard For Tracking Customer Service Team Performance Information PDF
This slide covers the KPI dashboard for analyzing the performance of client support department. It includes metrics such as first call resolution, unresolved calls, average response rate, the best day to call, average time to solve issues, etc. Deliver an awe inspiring pitch with this creative Dashboard For Tracking Customer Service Team Performance Information PDF bundle. Topics like Dashboard For Tracking Customer, Service Team Performance can be discussed with this completely editable template. It is available for immediate download depending on the needs and requirements of the user.

Dashboard To Business Success Measurement Of Customer Service Initiatives Microsoft PDF
This slide showcases customer service initiatives success measurement dashboard. It provides information about net promoter score NPS, customer satisfaction CSAT, first response time, close time, etc. Showcasing this set of slides titled Dashboard To Business Success Measurement Of Customer Service Initiatives Microsoft PDF. The topics addressed in these templates are Initial Response Time, Close Time, First Response Time. All the content presented in this PPT design is completely editable. Download it and make adjustments in color, background, font etc. as per your unique business setting.

Statistics Highlighting Call Center Business Success Measurement Introduction PDF
The following slide illustrates facts and figures for multiple success measures of service support teams. It provides information about customer effort score, CSAT customer satisfaction, NPS net promoter score, etc. Showcasing this set of slides titled Statistics Highlighting Call Center Business Success Measurement Introduction PDF. The topics addressed in these templates are BPO Managers, Customer Satisfaction Rate, Biggest Measure. All the content presented in this PPT design is completely editable. Download it and make adjustments in color, background, font etc. as per your unique business setting.

Enterprise Workforce Performance Dashboard With Sprint Review Themes PDF
This slide illustrates project extended team KPI dashboard with sprints evaluation. It provides information about average cycle time, velocity history, sprint variance, capacity variance, committed variance, etc. Showcasing this set of slides titled Enterprise Workforce Performance Dashboard With Sprint Review Themes PDF. The topics addressed in these templates are Velocity History, Sprint Variance, Average Cycle, Time Per State. All the content presented in this PPT design is completely editable. Download it and make adjustments in color, background, font etc. as per your unique business setting.

Customer Service Request Tickets Administration Dashboard Icons PDF
This slide covers division of tickets into different groups. It also includes a pie chart dividing tickets in multiple categories such as status, tech groups, alert level, request type and alert condition. Pitch your topic with ease and precision using this Customer Service Request Tickets Administration Dashboard Icons PDF. This layout presents information on Tickets Activity, Tickets Alert Level, Tickets Teach Group. It is also available for immediate download and adjustment. So, changes can be made in the color, design, graphics or any other component to create a unique layout.

Business Overview Of Mid Term Earning Potential And Expectations Slides PDF
This slide illustrates business overview and profit potential of a corporation. It includes group revenue shares, business revenue, EBITDA, volume growth, profit growth and operating margins etc. Showcasing this set of slides titled Business Overview Of Mid Term Earning Potential And Expectations Slides PDF. The topics addressed in these templates are Value Growth, Profit Growth, Operating Margin. All the content presented in this PPT design is completely editable. Download it and make adjustments in color, background, font etc. as per your unique business setting.

Corporate Earning Potential With Key Drivers Summary PDF
This slide illustrates profit earnings of a corporation with expected profit in the current year. It includes yearly profit earned for five years and key drivers working behind that profit. Pitch your topic with ease and precision using this Corporate Earning Potential With Key Drivers Summary PDF. This layout presents information on Working Capital, Improved Profits, Capital. It is also available for immediate download and adjustment. So, changes can be made in the color, design, graphics or any other component to create a unique layout.

Dashboard Showing Earning Potential From Corporate Trends Demonstration PDF
This slide illustrates facts and figures related to five years of corporate financial figures for evaluation of expected profit. It includes yearly revenue and EBITDA, PAT and PAT margin, net worth and return on net worth etc. Showcasing this set of slides titled Dashboard Showing Earning Potential From Corporate Trends Demonstration PDF. The topics addressed in these templates are Potential From Corporate Trends, Dashboard Showing Earning. All the content presented in this PPT design is completely editable. Download it and make adjustments in color, background, font etc. as per your unique business setting.

Evaluation Of Earning Potential From Gross Earning And Ebit Dashboard Professional PDF
This slide illustrates finding profit potential of a corporation while studying gross profit margin and EBITDA. It includes key operating expenditure and gross profit margin, EBITDA dollar MM and EBITDA percent margin etc. Showcasing this set of slides titled Evaluation Of Earning Potential From Gross Earning And Ebit Dashboard Professional PDF. The topics addressed in these templates are Evaluation Of Earning Potential, Gross Earning, Ebit Dashboard. All the content presented in this PPT design is completely editable. Download it and make adjustments in color, background, font etc. as per your unique business setting.

International Business Revenue And Earning Potential Guidelines PDF
This slide illustrates finding profit potential from evaluation of international business done by the corporation. It includes international business revenue share percent, international business revenue in USD BB, share of group revenues etc. Pitch your topic with ease and precision using this International Business Revenue And Earning Potential Guidelines PDF. This layout presents information on Potential Organic Growth, Supply Chain. It is also available for immediate download and adjustment. So, changes can be made in the color, design, graphics or any other component to create a unique layout.
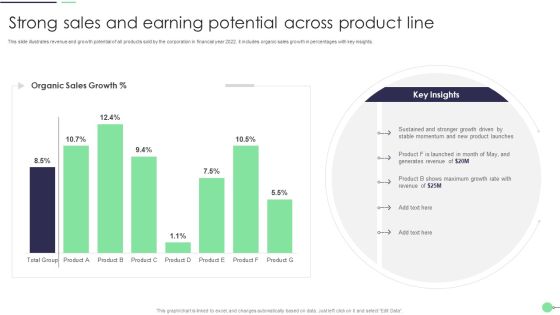
Strong Sales And Earning Potential Across Product Line Professional PDF
This slide illustrates revenue and growth potential of all products sold by the corporation in financial year 2022. it includes organic sales growth in percentages with key insights. Showcasing this set of slides titled Strong Sales And Earning Potential Across Product Line Professional PDF. The topics addressed in these templates are Product Launches, Generates Revenue, Growth Rate. All the content presented in this PPT design is completely editable. Download it and make adjustments in color, background, font etc. as per your unique business setting.

Sustained Sales Growth And Earning Potential During Covid 19 Pandemic Demonstration PDF
This slide illustrates sustained revenue and profit growth during consistent lockdowns in pandemic. It includes graphical representation of retail and out of home business with key insights etc. Pitch your topic with ease and precision using this Sustained Sales Growth And Earning Potential During Covid 19 Pandemic Demonstration PDF. This layout presents information on Revenue Growth, Business, Retail. It is also available for immediate download and adjustment. So, changes can be made in the color, design, graphics or any other component to create a unique layout.

Audit Firm Market Share By Company Earnings Stats Formats PDF
This slide depicts market share of audit firms in a graph. It also includes companies total revenue range and total number of audit firm along with a trend line. Showcasing this set of slides titled Audit Firm Market Share By Company Earnings Stats Formats PDF. The topics addressed in these templates are Company Earnings Stats, Audit Firm Market Share. All the content presented in this PPT design is completely editable. Download it and make adjustments in color, background, font etc. as per your unique business setting.

Global Fast Food Market Earnings Share By Brand With Key Insights Structure PDF
This slide covers market share of fast food market globally. It includes leading brand in the fast food restaurants industry based on revenue earned. Showcasing this set of slides titled Global Fast Food Market Earnings Share By Brand With Key Insights Structure PDF. The topics addressed in these templates are Global, Market Earnings Share, Brand With Key Insights. All the content presented in this PPT design is completely editable. Download it and make adjustments in color, background, font etc. as per your unique business setting.

Real Estate Property Management Dashboard Introduction PDF
This slide covers dashboard depicting waterfront and renovation status for various properties along with total bedrooms and properties floors. It also included elements such as properties current conditions, properties built years and total properties buil. Pitch your topic with ease and precision using this Real Estate Property Management Dashboard Introduction PDF. This layout presents information on Real Estate Property, Management Dashboard. It is also available for immediate download and adjustment. So, changes can be made in the color, design, graphics or any other component to create a unique layout.
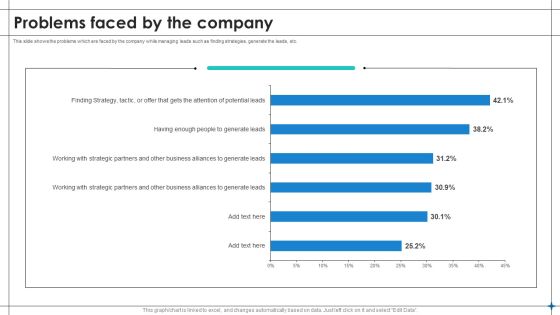
Increase Sales By Lead Generation Problems Faced By The Company Pictures PDF
This slide shows the problems which are faced by the company while managing leads such as finding strategies, generate the leads, etc. This Increase Sales By Lead Generation Problems Faced By The Company Pictures PDF is perfect for any presentation, be it in front of clients or colleagues. It is a versatile and stylish solution for organizing your meetings. The product features a modern design for your presentation meetings. The adjustable and customizable slides provide unlimited possibilities for acing up your presentation. Slidegeeks has done all the homework before launching the product for you. So, dont wait, grab the presentation templates today.
Stress Management Dashboard With Wellness Tracking And Heart Rate Variability Ideas PDF
This slide highlights the stress management dashboard which showcases the perceived stress scale, heart rate, blood pressure, sleep quality and employee wellness. This Stress Management Dashboard With Wellness Tracking And Heart Rate Variability Ideas PDF is perfect for any presentation, be it in front of clients or colleagues. It is a versatile and stylish solution for organizing your meetings. The product features a modern design for your presentation meetings. The adjustable and customizable slides provide unlimited possibilities for acing up your presentation. Slidegeeks has done all the homework before launching the product for you. So, dont wait, grab the presentation templates today.

Statistics Showing Annual Comparison Of Multiple Beauty Care Products Ppt Infographics Objects PDF
This slide contains graph which can be used by cosmetic manufacturing organizations to represent difference between annual sales of various products. It includes products such as skin care, hair care, oral care and others. Showcasing this set of slides titled Statistics Showing Annual Comparison Of Multiple Beauty Care Products Ppt Infographics Objects PDF. The topics addressed in these templates are Skin Care, Hair Care, 2022 To 2023. All the content presented in this PPT design is completely editable. Download it and make adjustments in color, background, font etc. as per your unique business setting.

Call Center Communication Kpis Performance Dashboard With First Call Resolution Rate Graphics PDF
This slide showcases dashboard that can help organization to analyze the performance of call center agents communication KPIs and take necessary actions in case of high abandonment rate. Its key components are average response time, first call resolution and top performing call agents. Showcasing this set of slides titled Call Center Communication Kpis Performance Dashboard With First Call Resolution Rate Graphics PDF. The topics addressed in these templates are Overall Average, Response Time, First Call Resolution, Daily Abandonment Rate. All the content presented in this PPT design is completely editable. Download it and make adjustments in color, background, font etc. as per your unique business setting.

Communication Kpis Performance Dashboard Of Social Media Channels Mockup PDF
This slide showcases dashboard that can help organization to analyze the effectiveness of communication KPIs campaign by studying channel views and number of likes. Its key components are youtube channel views, linkedin shares, linked in clicks and facebook daily reach. Pitch your topic with ease and precision using this Communication Kpis Performance Dashboard Of Social Media Channels Mockup PDF. This layout presents information on Linkedin Shares, Facebook Page likes, Facebook Daily Reach. It is also available for immediate download and adjustment. So, changes can be made in the color, design, graphics or any other component to create a unique layout.

Dashboard For Email Communication Kpis Metrics Topics PDF
This slide showcases email communication KPIs and dashboard that can help to keep track of performance of email marketing campaign. Its key elements are number of campaign, total recipients, average open percent and average click percent. Showcasing this set of slides titled Dashboard For Email Communication Kpis Metrics Topics PDF. The topics addressed in these templates are Number Campaigns, Total Recipients, Engagement Distribution. All the content presented in this PPT design is completely editable. Download it and make adjustments in color, background, font etc. as per your unique business setting.
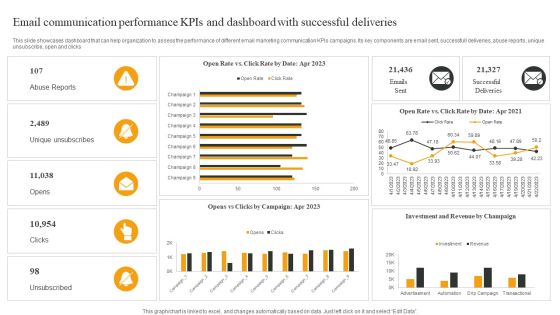
Email Communication Performance Kpis And Dashboard With Successful Deliveries Elements PDF
This slide showcases dashboard that can help organization to assess the performance of different email marketing communication KPIs campaigns. Its key components are email sent, successfull deliveries, abuse reports, unique unsubscribe, open and clicks. Showcasing this set of slides titled Email Communication Performance Kpis And Dashboard With Successful Deliveries Elements PDF. The topics addressed in these templates are Abuse Reports, Unique Unsubscribes, Opens. All the content presented in this PPT design is completely editable. Download it and make adjustments in color, background, font etc. as per your unique business setting.

Internal Organizational Communication Kpis And Dashboard With Channels Infographics PDF
This slide showcases dashboard that can help organization to assess the performance of internal communication and analyzing the user participation. Its key components are message success, channels and user engagement. Pitch your topic with ease and precision using this Internal Organizational Communication Kpis And Dashboard With Channels Infographics PDF. This layout presents information on User Participation, User Engagement, Message Success. It is also available for immediate download and adjustment. So, changes can be made in the color, design, graphics or any other component to create a unique layout.

Internal Organizational Communication Kpis And Dashboard With Delivered Results Designs PDF
This slide showcases internal communication KPIs and dashboard that can help organization to identify the reach of messages and most discussed topics in company. Its key components are delivered results and message type. Showcasing this set of slides titled Internal Organizational Communication Kpis And Dashboard With Delivered Results Designs PDF. The topics addressed in these templates are Most Discussed Topics, All Time, Last Week. All the content presented in this PPT design is completely editable. Download it and make adjustments in color, background, font etc. as per your unique business setting.

Monthly Email Communication Kpis And Dashboard Download PDF
This slide showcases dashboard for email communication KPIs that can help organization to analyze the reach and average response time of customers. Its key elements are send messages, recipients, received messages, senders and monthly email distribution. Pitch your topic with ease and precision using this Monthly Email Communication Kpis And Dashboard Download PDF. This layout presents information on Sent Messages, Recipients, Average Response Time, Received Message. It is also available for immediate download and adjustment. So, changes can be made in the color, design, graphics or any other component to create a unique layout.
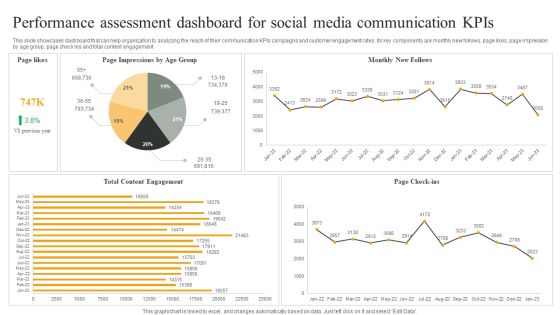
Performance Assessment Dashboard For Social Media Communication Kpis Graphics PDF
This slide showcases dashboard that can help organization to analyzing the reach of their communication KPIs campaigns and customer engagement rates. Its key components are monthly new follows, page likes, page impression by age group, page check ins and total content engagement. Pitch your topic with ease and precision using this Performance Assessment Dashboard For Social Media Communication Kpis Graphics PDF. This layout presents information on Monthly New Follows, Page Check ins, Total Content Engagement. It is also available for immediate download and adjustment. So, changes can be made in the color, design, graphics or any other component to create a unique layout.

Five Element Disaster Threat Recovery Status Ppt Outline Inspiration PDF
The below slide presents the disaster risk recovery plan status to have quick insight of vulnerabilities. It includes elements such as systems, services, staff, supplier, sites along with the disruptions and corrective actions. Pitch your topic with ease and precision using this Five Element Disaster Threat Recovery Status Ppt Outline Inspiration PDF. This layout presents information on Health Status, Disruptions, Gaps. It is also available for immediate download and adjustment. So, changes can be made in the color, design, graphics or any other component to create a unique layout.

30 60 90 Days Sales And Promotion Planning Valuation Icon Summary PDF
The given below slide showcases the required actions to improve companys sales and achieve the set targets. It also includes KPIs such as product, projection, and quality standards etc. Showcasing this set of slides titled 30 60 90 Days Sales And Promotion Planning Valuation Icon Summary PDF. The topics addressed in these templates are Quality Standards, Products, Projection. All the content presented in this PPT design is completely editable. Download it and make adjustments in color, background, font etc. as per your unique business setting.
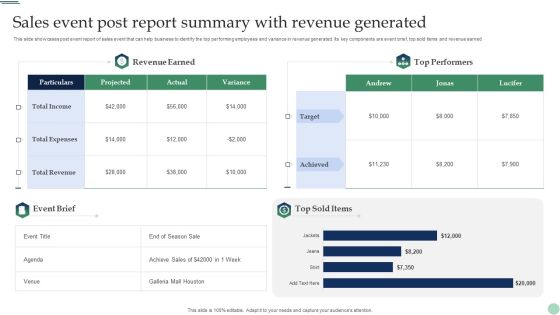
Sales Event Post Report Summary With Revenue Generated Portrait PDF
This slide showcases post event report of sales event that can help business to identify the top performing employees and variance in revenue generated. Its key components are event brief, top sold items and revenue earned. Showcasing this set of slides titled Sales Event Post Report Summary With Revenue Generated Portrait PDF. The topics addressed in these templates are Revenue Earned, Top Performers, Revenue Generated. All the content presented in this PPT design is completely editable. Download it and make adjustments in color, background, font etc. as per your unique business setting.

KPI Dashboard To Assess Facebook Business Marketing Approach Performance Portrait PDF
This slide covers KPI dashboard to assess Facebook marketing strategy performance. It involves details such as audience engagement, page engagement, page likes and post shares. Pitch your topic with ease and precision using this KPI Dashboard To Assess Facebook Business Marketing Approach Performance Portrait PDF. This layout presents information on Audience Engagement, Page Engagement, Post Comments. It is also available for immediate download and adjustment. So, changes can be made in the color, design, graphics or any other component to create a unique layout.

Business To Business Model Lead Management Dashboard Ppt Portfolio Backgrounds PDF
This slide showcases business to business b2b lead management dashboard. It provides information about lead funnel, pipeline, sales, opportunities, campaign, status, primary offer, etc. Pitch your topic with ease and precision using this Business To Business Model Lead Management Dashboard Ppt Portfolio Backgrounds PDF. This layout presents information on Leads Generated, Pipeline Generated, Sales Generated, Opportunities. It is also available for immediate download and adjustment. So, changes can be made in the color, design, graphics or any other component to create a unique layout.

Business To Business Model Marketing Dashboard With Total Deals Ppt Professional Inspiration PDF
This slide b2b business marketing and deal management dashboard. It provides information about spend per office, monthly recurring revenue MRR, revenue on ad spend ROAS, demos, deals, closed, won, etc. Showcasing this set of slides titled Business To Business Model Marketing Dashboard With Total Deals Ppt Professional Inspiration PDF. The topics addressed in these templates are Demos Requested, Demos Delivered, Deals Created. All the content presented in this PPT design is completely editable. Download it and make adjustments in color, background, font etc. as per your unique business setting.

30 60 90 Days Sales And Promotion Planning Achievement Infographics PDF
The below slide depicts the assessment of sales and marketing plan execution to track the deviations. It includes the success rate of sales in previous three months and product wise projections for coming days. Showcasing this set of slides titled 30 60 90 Days Sales And Promotion Planning Achievement Infographics PDF. The topics addressed in these templates are 30 60 90 Days, Sales Promotion Planning, Achievement. All the content presented in this PPT design is completely editable. Download it and make adjustments in color, background, font etc. as per your unique business setting.

B2C Content Marketing Statistics Indicating Usage Of Techniques Sample PDF
This slide showcases business to consumer B2C content marketing figures highlighting usage of key strategies. It provides information about targeting, editorial calendar, promotion, website UI, social media, service development, etc. Pitch your topic with ease and precision using this B2C Content Marketing Statistics Indicating Usage Of Techniques Sample PDF. This layout presents information on Strategies, Marketers, Content Team. It is also available for immediate download and adjustment. So, changes can be made in the color, design, graphics or any other component to create a unique layout.

Departmental Tracking Goals Progress Dashboard Diagrams PDF
This slide depicts a progress chart for maintaining transparency and alignment in tracking cross-functional goals. It also includes organizational objective details such as total on track objectives, recently updated, overall progress, etc. Showcasing this set of slides titled Departmental Tracking Goals Progress Dashboard Diagrams PDF. The topics addressed in these templates are Departmental Tracking Goals, Progress Dashboard . All the content presented in this PPT design is completely editable. Download it and make adjustments in color, background, font etc. as per your unique business setting.
Tracking Goals Achievement Status Dashboard Themes PDF
This slide showcases the objective status report, which helps track current the percentage of the targets achieved and left. It also includes the number of overdue targets and unachieved departmental goals. Pitch your topic with ease and precision using this Tracking Goals Achievement Status Dashboard Themes PDF. This layout presents information on Achieved Objectives, Unachieved Objectives, Overdue. It is also available for immediate download and adjustment. So, changes can be made in the color, design, graphics or any other component to create a unique layout.
Tracking Goals Alignment And Analytical Chart Slides PDF
This slide showcases a visual depiction of the organizations goals, overall progress, and goal alignment. It also includes enlisted objectives tracking details such as end date, assigner, progress, and performance rating. Showcasing this set of slides titled Tracking Goals Alignment And Analytical Chart Slides PDF. The topics addressed in these templates are Develop Process Improvement Plan, Increase Customer Retention Rate. All the content presented in this PPT design is completely editable. Download it and make adjustments in color, background, font etc. as per your unique business setting.
Tracking Goals Alignment KPI Dashboard Guidelines PDF
This slide showcases a tracking dashboard for determining the alignment and progress percentage of the assigned objectives. It also includes the objective evaluation KPIs such as active objectives, overall progress, total employees, objective as per employees, aligned, organizational and departmental objectives. Pitch your topic with ease and precision using this Tracking Goals Alignment KPI Dashboard Guidelines PDF. This layout presents information on Employee, Organizational Objectives, Departmental Objectives. It is also available for immediate download and adjustment. So, changes can be made in the color, design, graphics or any other component to create a unique layout.
Tracking Goals Dashboard With Progress Report Rules PDF
This slide showcases the progress report which helps to determine gaps in the objective achievement process and take corrective actions. It also includes objective details such as contributor, due date, and progress percentage. Showcasing this set of slides titled Tracking Goals Dashboard With Progress Report Rules PDF. The topics addressed in these templates are Immediate Action Required, Progress Update Required, Concise Goal Outcome Required. All the content presented in this PPT design is completely editable. Download it and make adjustments in color, background, font etc. as per your unique business setting.
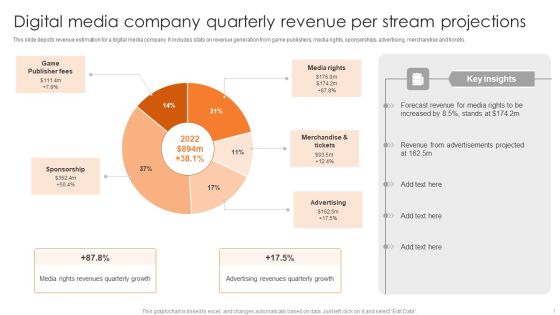
Digital Media Company Quarterly Revenue Per Stream Projections Elements PDF
This slide depicts revenue estimation for a digital media company. It includes stats on revenue generation from game publishers, media rights, sponsorships, advertising, merchandise and tickets. Pitch your topic with ease and precision using this Digital Media Company Quarterly Revenue Per Stream Projections Elements PDF. This layout presents information on Game Publisher Fees, Media Rights, Merchandise And Tickets. It is also available for immediate download and adjustment. So, changes can be made in the color, design, graphics or any other component to create a unique layout.

Contact Strategy Impact On Consumer Response Rate Ppt Icon Templates PDF
This slide covers positive customer insights on contact strategy. It enhances customer experience and increases the response and retention rates along with customer engagement. Pitch your topic with ease and precision using this Contact Strategy Impact On Consumer Response Rate Ppt Icon Templates PDF. This layout presents information on Customer Retention Rates, Quick Response Rate, Enhances Customer Experience. It is also available for immediate download and adjustment. So, changes can be made in the color, design, graphics or any other component to create a unique layout.
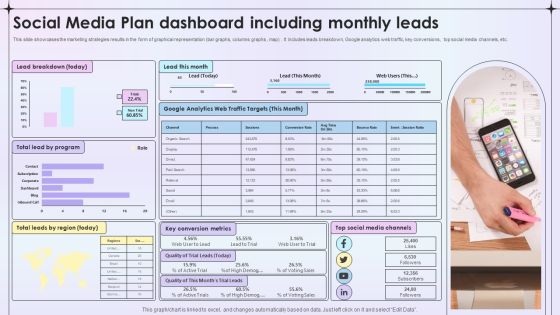
Social Media Plan Dashboard Including Monthly Leads Ppt File Slides PDF
This slide showcases the marketing strategies results in the form of graphical representation bar graphs, columns graphs , map. It includes leads breakdown, Google analytics web traffic, key conversions , top social media channels, etc. Showcasing this set of slides titled Social Media Plan Dashboard Including Monthly Leads Ppt File Slides PDF. The topics addressed in these templates are Lead Breakdown, Key Conversion Metrics, Social Media Channels. All the content presented in this PPT design is completely editable. Download it and make adjustments in color, background, font etc. as per your unique business setting.
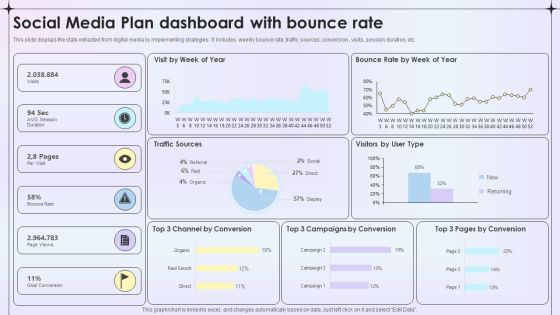
Social Media Plan Dashboard With Bounce Rate Ppt Ideas Graphics Template PDF
This slide displays the stats extracted from digital media by implementing strategies . It includes weekly bounce rate, traffic sources, conversion , visits, session duration, etc. Pitch your topic with ease and precision using this Social Media Plan Dashboard With Bounce Rate Ppt Ideas Graphics Template PDF. This layout presents information on Traffic Sources, Visitors User Type, Goal Conversion. It is also available for immediate download and adjustment. So, changes can be made in the color, design, graphics or any other component to create a unique layout.
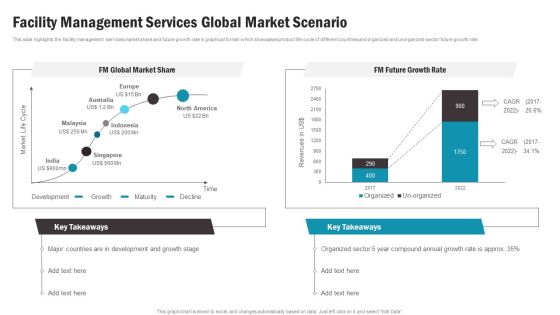
Facility Management Services Global Market Scenario Topics PDF
This slide highlights the facility management services market share and future growth rate in graphical format which showcases product life cycle of different countries and organized and unorganized sector future growth rate. This Facility Management Services Global Market Scenario Topics PDF is perfect for any presentation, be it in front of clients or colleagues. It is a versatile and stylish solution for organizing your meetings. The product features a modern design for your presentation meetings. The adjustable and customizable slides provide unlimited possibilities for acing up your presentation. Slidegeeks has done all the homework before launching the product for you. So, do not wait, grab the presentation templates today.
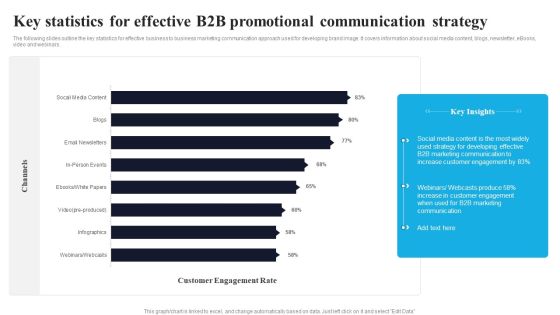
Key Statistics For Effective B2B Promotional Communication Strategy Information PDF
The following slides outline the key statistics for effective business to business marketing communication approach used for developing brand image. It covers information about social media content, blogs, newsletter, eBooks, video and webinars. Showcasing this set of slides titled Key Statistics For Effective B2B Promotional Communication Strategy Information PDF. The topics addressed in these templates are Customer Engagement Rate, Social Media Content, Customer Engagement. All the content presented in this PPT design is completely editable. Download it and make adjustments in color, background, font etc. as per your unique business setting.

KPI Dashboard To Measure Performance Of B2B Promotional Communication Strategy Mockup PDF
The following slides outline the key performance indicator dashboard to track performance of B2B marketing communication approach. It covers information about pipeline deals, revenue by campaign, email engagement and landing page completion. Pitch your topic with ease and precision using this KPI Dashboard To Measure Performance Of B2B Promotional Communication Strategy Mockup PDF. This layout presents information on Pipeline Deals, Engagement Health, Email Engagement. It is also available for immediate download and adjustment. So, changes can be made in the color, design, graphics or any other component to create a unique layout.

KPI Dashboard To Manage Various Risks In Project Administration Sample PDF
This slide signifies the key performance indicator dashboard to manage various threats in company project. It covers information about corporate risk, control performance, open issues and map. Showcasing this set of slides titled KPI Dashboard To Manage Various Risks In Project Administration Sample PDF. The topics addressed in these templates are Control Performance, Open Issues, Corporate Risk. All the content presented in this PPT design is completely editable. Download it and make adjustments in color, background, font etc. as per your unique business setting.
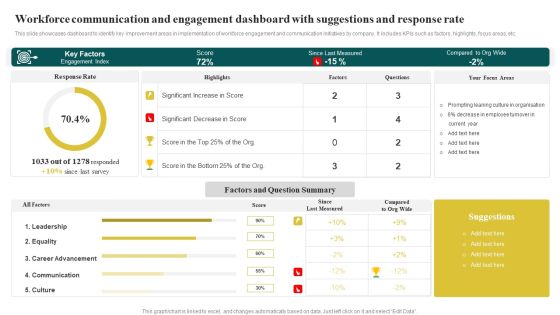
Workforce Communication And Engagement Dashboard With Suggestions And Response Rate Microsoft PDF
This slide showcases dashboard to identify key improvement areas in implementation of workforce engagement and communication initiatives by company. It includes KPIs such as factors, highlights, focus areas, etc. Pitch your topic with ease and precision using this Workforce Communication And Engagement Dashboard With Suggestions And Response Rate Microsoft PDF. This layout presents information on Key Factors, Since Last Measured, Factors And Que. It is also available for immediate download and adjustment. So, changes can be made in the color, design, graphics or any other component to create a unique layout.
Workforce Engagement And Communication Dashboard With Net Promoter Score Icons PDF
The following slide displays KPI dashboard to keep track of workforce engagement and communication at workplace to help company increase employee productivity. It includes elements such as monthly score, passive, promoters, detractors, etc. Showcasing this set of slides titled Workforce Engagement And Communication Dashboard With Net Promoter Score Icons PDF. The topics addressed in these templates are Participation Rate, Engagement Score, Overall Score. All the content presented in this PPT design is completely editable. Download it and make adjustments in color, background, font etc. as per your unique business setting.
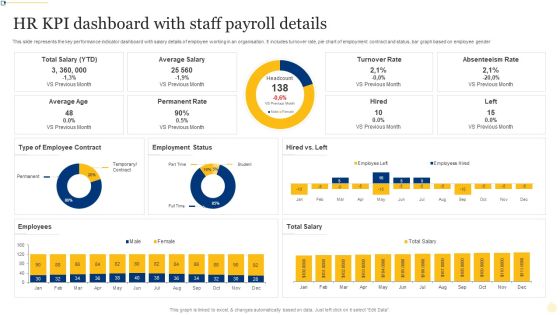
HR KPI Dashboard With Staff Payroll Details Ppt PowerPoint Presentation File Layout Ideas PDF
This slide represents the key performance indicator dashboard with salary details of employee working in an organisation. It includes turnover rate, pie chart of employment contract and status, bar graph based on employee gender. Showcasing this set of slides titled HR KPI Dashboard With Staff Payroll Details Ppt PowerPoint Presentation File Layout Ideas PDF. The topics addressed in these templates are Turnover Rate, Absenteeism Rate, Permanent Rate. All the content presented in this PPT design is completely editable. Download it and make adjustments in color, background, font etc. as per your unique business setting.

KPI Dashboard To Track Process Products Sold By Insurance Topics PDF
This slide shows dashboard which can be used to compare insurance sales of current and previous year. It includes metrics such as monthly policy status, quarterly premium revenue, overall policy status, etc. Pitch your topic with ease and precision using this KPI Dashboard To Track Process Products Sold By Insurance Topics PDF. This layout presents information on Overall Policy Status, Quarterly Premium Revenue, Monthly Policy Status. It is also available for immediate download and adjustment. So, changes can be made in the color, design, graphics or any other component to create a unique layout.
Stock Performance Dashboard For Metrics Team Management Ppt Outline Icons PDF
This slide represents the dashboard for tracking the management team member, manager, and teams ability to ensure inventory accuracy over time. It includes KPIs such as inventory, average result area scores and result areas. Pitch your topic with ease and precision using this Stock Performance Dashboard For Metrics Team Management Ppt Outline Icons PDF. This layout presents information on Result areas, Metrics Team, Needs Help. It is also available for immediate download and adjustment. So, changes can be made in the color, design, graphics or any other component to create a unique layout.

Stock Performance Metrics Dashboard For FMCG Company Ppt Ideas Design Inspiration PDF
This slide showcases the metrics for analyzing inventory turnover. It includes KPIs such as product sold within freshness date, out of stock rate, on time in full deliveries, etc. Showcasing this set of slides titled Stock Performance Metrics Dashboard For FMCG Company Ppt Ideas Design Inspiration PDF. The topics addressed in these templates are Inventory Turnover, Overview 2015, Inventory Turnover. All the content presented in this PPT design is completely editable. Download it and make adjustments in color, background, font etc. as per your unique business setting.

Customer Service KPI Dashboard For Technical Support Ppt Model Vector PDF
This slide covers customer service KPI dashboard for technical support. It involves details such as total number of issues arise daily, overall average response time, number of issues by channel and top performing technical engineers. Pitch your topic with ease and precision using this Customer Service KPI Dashboard For Technical Support Ppt Model Vector PDF. This layout presents information on Overall Average, Response Time, Total Number, Issues Arise Daily. It is also available for immediate download and adjustment. So, changes can be made in the color, design, graphics or any other component to create a unique layout.

KPI Dashboard Of Technical Customer Support Service Ppt Layouts Professional PDF
This slide covers KPI dashboard of technical customer support service. It involves KPIs such as overdue tickets, problem types, tickets by customer types and detail about technical support engineers. Showcasing this set of slides titled KPI Dashboard Of Technical Customer Support Service Ppt Layouts Professional PDF. The topics addressed in these templates are Overdue Tickets, Problems Types, Technical Support Engineers. All the content presented in this PPT design is completely editable. Download it and make adjustments in color, background, font etc. as per your unique business setting.
Retail Assortment Dashboard Depicting Store Performance Ppt Icon Structure PDF
This slide shows product assortment dashboard depicting store performance which can benefit managers in reviewing the current situation of outlets and make decisions according to reached benchmarks. It includes details about achieved sales, rate of conversion, weekday vs. Weekend sales, daily trend, etc. Showcasing this set of slides titled Retail Assortment Dashboard Depicting Store Performance Ppt Icon Structure PDF. The topics addressed in these templates are Achieved Sales, Rate Of Conversion, Daily Trend, Outlet Sales. All the content presented in this PPT design is completely editable. Download it and make adjustments in color, background, font etc. as per your unique business setting.
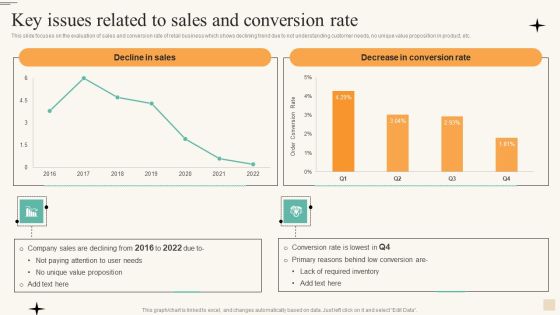
Retail Merchandise Management To Improve Buyer Engagement Key Issues Related Download PDF
This slide focuses on the evaluation of sales and conversion rate of retail business which shows declining trend due to not understanding customer needs, no unique value proposition in product, etc. This Retail Merchandise Management To Improve Buyer Engagement Key Issues Related Download PDF is perfect for any presentation, be it in front of clients or colleagues. It is a versatile and stylish solution for organizing your meetings. The product features a modern design for your presentation meetings. The adjustable and customizable slides provide unlimited possibilities for acing up your presentation. Slidegeeks has done all the homework before launching the product for you. So, do not wait, grab the presentation templates today.
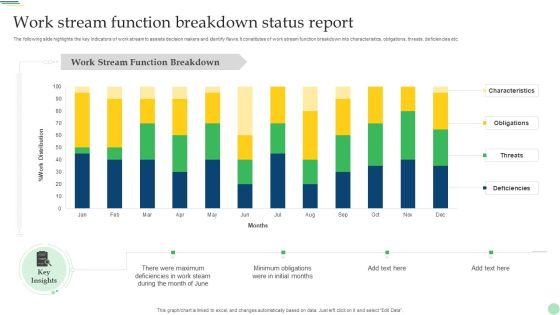
Work Stream Function Breakdown Status Report Demonstration PDF
The following slide highlights the key indicators of work stream to assists decision makers and identify flaws. It constitutes of work stream function breakdown into characteristics, obligations, threats, deficiencies etc. Pitch your topic with ease and precision using this Work Stream Function Breakdown Status Report Demonstration PDF. This layout presents information on Characteristics, Obligations, Threats, Deficiencies. It is also available for immediate download and adjustment. So, changes can be made in the color, design, graphics or any other component to create a unique layout.

Managing Cyber Security Incident Response KPI Dashboard Ppt Layouts Shapes PDF
This slide covers cyber security incident response KPI dashboard. It involves details such as intent alarm, event trend sources, event trend, sensor activity, major operating systems and asset information. Pitch your topic with ease and precision using this Managing Cyber Security Incident Response KPI Dashboard Ppt Layouts Shapes PDF. This layout presents information on Top Alarms Method, Alarms Intent, Timely Event Trend. It is also available for immediate download and adjustment. So, changes can be made in the color, design, graphics or any other component to create a unique layout.
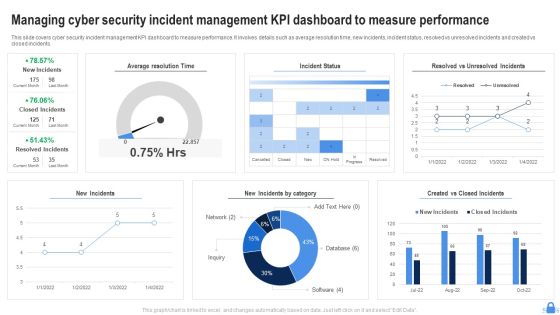
Managing Cyber Security Incident Management KPI Dashboard To Measure Performance Download PDF
This slide covers cyber security incident management KPI dashboard to measure performance. It involves details such as average resolution time, new incidents, incident status, resolved vs unresolved incidents and created vs closed incidents. Showcasing this set of slides titled Managing Cyber Security Incident Management KPI Dashboard To Measure Performance Download PDF. The topics addressed in these templates are Average Resolution Time, Incident Status, New Incidents. All the content presented in this PPT design is completely editable. Download it and make adjustments in color, background, font etc. as per your unique business setting.
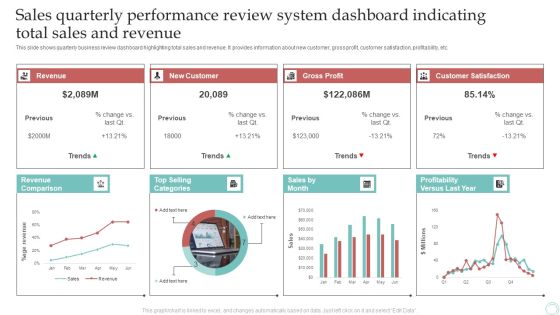
Sales Quarterly Performance Review System Dashboard Indicating Total Sales And Revenue Download PDF
This slide shows quarterly business review dashboard highlighting total sales and revenue. It provides information about new customer, gross profit, customer satisfaction, profitability, etc. Pitch your topic with ease and precision using this Sales Quarterly Performance Review System Dashboard Indicating Total Sales And Revenue Download PDF. This layout presents information on Revenue, New Customer, Gross Profit. It is also available for immediate download and adjustment. So, changes can be made in the color, design, graphics or any other component to create a unique layout.

Change Order Administration Dashboard With Priority Assessment Ppt Portfolio Inspiration PDF
This slide showcases change order management dashboard with priority assessment. It provides information about order stats, summary, latest change orders and priority according to rank. Pitch your topic with ease and precision using this Change Order Administration Dashboard With Priority Assessment Ppt Portfolio Inspiration PDF. This layout presents information on Change Orders Priority, Change Order Stats, Change Orders Summary. It is also available for immediate download and adjustment. So, changes can be made in the color, design, graphics or any other component to create a unique layout.

Inbound Leads Generation And Conversion Analytics Ppt Summary Show PDF
This slide covers record of prospects visits and leads generated using different sources. It includes sources such as organic search, referrals, social media, email marketing, paid search, direct traffic, etc. along with total visits, conversion rates, contacts generated, customers count, conversion rates and graph depicting monthly visits using these sources. Showcasing this set of slides titled Inbound Leads Generation And Conversion Analytics Ppt Summary Show PDF. The topics addressed in these templates are Organic Search, Referrals, Social Media. All the content presented in this PPT design is completely editable. Download it and make adjustments in color, background, font etc. as per your unique business setting.

Evaluation Survey Outcomes For Managerial Performance Assessment Ppt Gallery Graphics PDF
This slide states that managers in small business are less communicative than enterprise counterparts. It includes survey report on job fulfilment based on effective managers feedback. Showcasing this set of slides titled Evaluation Survey Outcomes For Managerial Performance Assessment Ppt Gallery Graphics PDF. The topics addressed in these templates are Employees Receiving Evaluations, Feedback From Managers, Performance Evaluation. All the content presented in this PPT design is completely editable. Download it and make adjustments in color, background, font etc. as per your unique business setting.

Brand Extension Positioning Example Projected Market Share Demonstration PDF
Mentioned graphs forecast the companys market share of PQR company. It depicts the company acquiring 15 precent of its competitors market share by FY23.Welcome to our selection of the Brand Extension Positioning Example Projected Market Share Demonstration PDF. These are designed to help you showcase your creativity and bring your sphere to life. Planning and Innovation are essential for any business that is just starting out. This collection contains the designs that you need for your everyday presentations. All of our PowerPoints are 100precent editable, so you can customize them to suit your needs. This multi-purpose template can be used in various situations. Grab these presentation templates today.

Construction Industry Market Share Chart Comparison Of Big Players Ppt Portfolio Shapes PDF
This slide shows the year over year market share comparison of major construction firms. It also illustrates that market share of brand B has increased by slight margin. Pitch your topic with ease and precision using this Construction Industry Market Share Chart Comparison Of Big Players Ppt Portfolio Shapes PDF. This layout presents information on Market Share Percentage, 2022 To 2023, Market Share. It is also available for immediate download and adjustment. So, changes can be made in the color, design, graphics or any other component to create a unique layout.

Usage Trend Chart Of Skincare Product Market Ppt Slides Graphics Download PDF
This slide shows market trend graph of skincare product usage in four quarters. It also indicates that product A is most preferred by the customers. Pitch your topic with ease and precision using this Usage Trend Chart Of Skincare Product Market Ppt Slides Graphics Download PDF. This layout presents information on Trend Product, Skincare Product, Quarter Due. It is also available for immediate download and adjustment. So, changes can be made in the color, design, graphics or any other component to create a unique layout.
Key Blocks For Project Management Dashboard Ppt Icon Tips PDF
This slide illustrates graphical representations of facts and figures related to project drivers. It includes stakeholders engagement, feedback and response rate, business units performance etc. Showcasing this set of slides titled Key Blocks For Project Management Dashboard Ppt Icon Tips PDF. The topics addressed in these templates are Stakeholders Engagement Score, Business Units Performance, Effective Communication Score. All the content presented in this PPT design is completely editable. Download it and make adjustments in color, background, font etc. as per your unique business setting.

Customer Lead Development Management Strategies Problems Faced By The Company Designs PDF
This slide shows the problems which are faced by the company while managing leads such as finding strategies, generate the leads, etc. This Customer Lead Development Management Strategies Problems Faced By The Company Designs PDF is perfect for any presentation, be it in front of clients or colleagues. It is a versatile and stylish solution for organizing your meetings. The product features a modern design for your presentation meetings. The adjustable and customizable slides provide unlimited possibilities for acing up your presentation. Slidegeeks has done all the homework before launching the product for you. So, do not wait, grab the presentation templates today.

Automobile Company Actual And Forecasted Monthly Sales Dashboard Ppt Infographic Template Aids PDF
This slide shows the dashboard for forecasting the sales of an automobile company for the current month. It represents details related to revenue by pipeline, new deals, sales forecast, revenue goal attainment by owner for the current month and pipeline coverage by next month. Showcasing this set of slides titled Automobile Company Actual And Forecasted Monthly Sales Dashboard Ppt Infographic Template Aids PDF. The topics addressed in these templates are Forecast Month, Revenue Goal Attainment, Revenue Goal Attainment. All the content presented in this PPT design is completely editable. Download it and make adjustments in color, background, font etc. as per your unique business setting.

Application Of Artificial Intelligence AI Driven Dashboard With Website Kpis Formats PDF
This slide shows AI driven dashboard with website KPIs. It provides information such as total visits, traffic sources, geography, bounce rate, monthly visits, average visit time, etc. Showcasing this set of slides titled Application Of Artificial Intelligence AI Driven Dashboard With Website Kpis Formats PDF. The topics addressed in these templates are Bounce Rate, Monthly Visits, Traffic Sources. All the content presented in this PPT design is completely editable. Download it and make adjustments in color, background, font etc. as per your unique business setting.
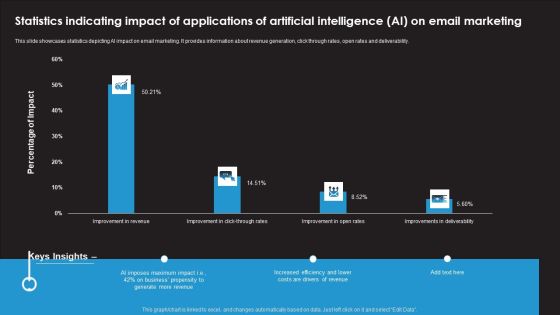
Statistics Indicating Impact Of Applications Of Artificial Intelligence AI On Email Marketing Inspiration PDF
This slide showcases statistics depicting AI impact on email marketing. It provides information about revenue generation, click through rates, open rates and deliverability. Showcasing this set of slides titled Statistics Indicating Impact Of Applications Of Artificial Intelligence AI On Email Marketing Inspiration PDF. The topics addressed in these templates are AI Imposes Maximum Impact, Business Propensity, Increased Efficiency. All the content presented in this PPT design is completely editable. Download it and make adjustments in color, background, font etc. as per your unique business setting.

Network Risks Management And Barriers Dashboard Ppt PowerPoint Presentation Gallery Graphic Tips PDF
This slide represents a dashboard of network risk management. It also includes problem servers , workstations and their status, unmonitored network devices. Pitch your topic with ease and precision using this Network Risks Management And Barriers Dashboard Ppt PowerPoint Presentation Gallery Graphic Tips PDF. This layout presents information on Problem Servers, Server Status, Problem Workstations, Workstation Status. It is also available for immediate download and adjustment. So, changes can be made in the color, design, graphics or any other component to create a unique layout.

Attain Production Goals And Objectives Graph And Table Ppt Infographic Template Visuals PDF
This slide displays graphical representation of targeted and achieved production variance. It also includes critical insights such as target units, achieved production, achieved percentage, overachieved percentage, etc. Pitch your topic with ease and precision using this Attain Production Goals And Objectives Graph And Table Ppt Infographic Template Visuals PDF. This layout presents information on Target Vs Achieved, Key insight Table, Quarterly. It is also available for immediate download and adjustment. So, changes can be made in the color, design, graphics or any other component to create a unique layout.

Continuous Integration Dashboard For Automated Testing Framework Ppt Layouts Layout Ideas PDF
This slide shows continuous integration dashboard for test automation framework which can be referred by authors to review their testing performance. It contains information about weekly change volume by author, monthly change volume by author, repository, etc. Pitch your topic with ease and precision using this Continuous Integration Dashboard For Automated Testing Framework Ppt Layouts Layout Ideas PDF. This layout presents information on Total Changes Volume, Monthly Change Volume, Weekly Change Volume. It is also available for immediate download and adjustment. So, changes can be made in the color, design, graphics or any other component to create a unique layout.

Customer NPS Metric Dashboard For Call Centers Ppt Inspiration Smartart PDF
This slide shows net promoter score dashboard for call centers which contains occupancy rate, tickets unassigned, opened tickets, completed tickets and raised tickets. It also has details on resolution rate on first call, enquiries, etc. Pitch your topic with ease and precision using this Customer NPS Metric Dashboard For Call Centers Ppt Inspiration Smartart PDF. This layout presents information on Occupancy Rate, Resolution Rate, Net Promoter Score. It is also available for immediate download and adjustment. So, changes can be made in the color, design, graphics or any other component to create a unique layout.

Dashboard Depicting Client And Employee Customer NPS Metric Ppt Gallery Deck PDF
This slide shows dashboard depicting client and employee net promoter score NPS. It contains information about customer refer probability, recent service review and repeated use of service. Showcasing this set of slides titled Dashboard Depicting Client And Employee Customer NPS Metric Ppt Gallery Deck PDF. The topics addressed in these templates are Client NPS, Employee NPS, Customer Probability. All the content presented in this PPT design is completely editable. Download it and make adjustments in color, background, font etc. as per your unique business setting.
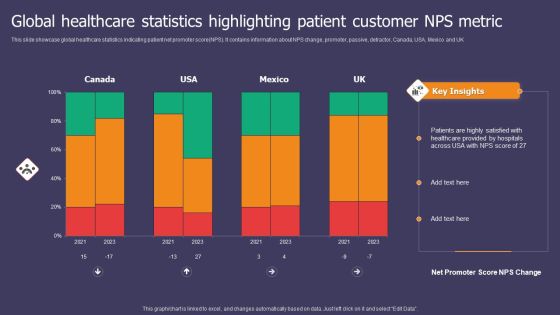
Global Healthcare Statistics Highlighting Patient Customer NPS Metric Ppt Summary Graphics Pictures PDF
This slide showcase global healthcare statistics indicating patient net promoter score NPS. It contains information about NPS change, promoter, passive, detractor, Canada, USA, Mexico and UK. Showcasing this set of slides titled Global Healthcare Statistics Highlighting Patient Customer NPS Metric Ppt Summary Graphics Pictures PDF. The topics addressed in these templates are Healthcare Provided, Hospitals Across, NPS Score. All the content presented in this PPT design is completely editable. Download it and make adjustments in color, background, font etc. as per your unique business setting.

Content Format Statistics For Influencer Marketing Strategy Paln Mockup PDF
This slide plans key statistics of that can help organization to select the format of content for influencer marketing strategy. Its key components are content format and percentage of marketers.Showcasing this set of slides titled Content Format Statistics For Influencer Marketing Strategy Paln Mockup PDF. The topics addressed in these templates are Marketers Prefer, Instagram Post, Easy Produce. All the content presented in this PPT design is completely editable. Download it and make adjustments in color, background, font etc. as per your unique business setting.

Sales Performance Monitoring Dashboard With Customer Details Ppt Infographics Themes PDF
This slide illustrates sales performance tracking dashboard with critical information. It provides information about customer details, invoice, earnings, leads, pending delivery, revenue, etc. Pitch your topic with ease and precision using this Sales Performance Monitoring Dashboard With Customer Details Ppt Infographics Themes PDF. This layout presents information on Todays Revenue, Today Delivered, Pending Delivery, Total Leads. It is also available for immediate download and adjustment. So, changes can be made in the color, design, graphics or any other component to create a unique layout.
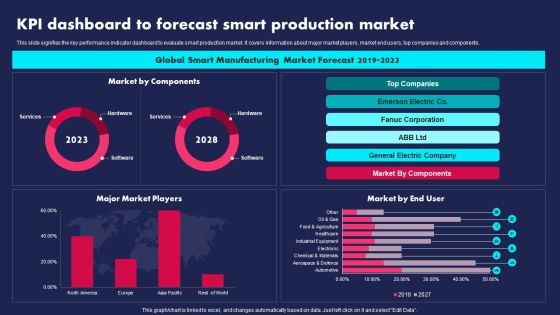
KPI Dashboard To Forecast Smart Production Market Ppt PowerPoint Presentation Gallery Visual Aids PDF
This slide signifies the key performance indicator dashboard to evaluate smart production market. It covers information about major market players, market end users, top companies and components. Pitch your topic with ease and precision using this KPI Dashboard To Forecast Smart Production Market Ppt PowerPoint Presentation Gallery Visual Aids PDF. This layout presents information on Global Smart Manufacturing, Market Forecast, 2019 To 2023. It is also available for immediate download and adjustment. So, changes can be made in the color, design, graphics or any other component to create a unique layout.
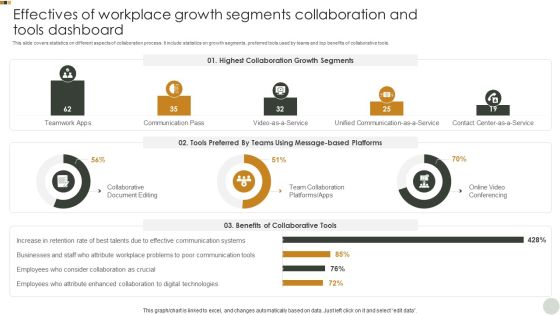
Effectives Of Workplace Growth Segments Collaboration And Tools Dashboard Graphics PDF
This slide covers statistics on different aspects of collaboration process. It include statistics on growth segments, preferred tools used by teams and top benefits of collaborative tools. Pitch your topic with ease and precision using this Effectives Of Workplace Growth Segments Collaboration And Tools Dashboard Graphics PDF. This layout presents information on Highest Collaboration, Growth Segments, Tools Preferred. It is also available for immediate download and adjustment. So, changes can be made in the color, design, graphics or any other component to create a unique layout.
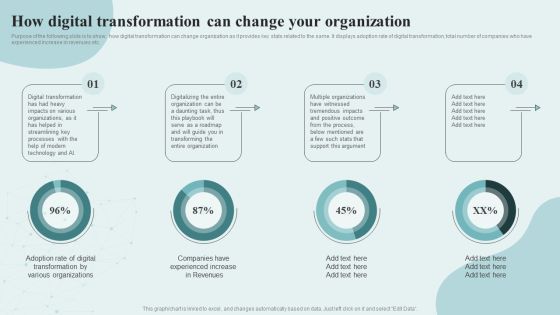
Digital Competency Evaluation And Modification How Digital Transformation Can Change Your Formats PDF
Purpose of the following slide is to show, how digital transformation can change organization as it provides key stats related to the same. It displays adoption rate of digital transformation, total number of companies who have experienced increase in revenues etc. There are so many reasons you need a Digital Competency Evaluation And Modification How Digital Transformation Can Change Your Formats PDF. The first reason is you cant spend time making everything from scratch, Thus, Slidegeeks has made presentation templates for you too. You can easily download these templates from our website easily.
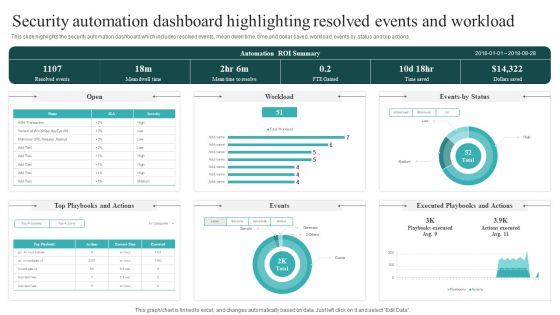
Security Automation Dashboard Highlighting Resolved Events And Workload Guidelines PDF
This slide highlights the security automation dashboard which includes resolved events, mean dwell time, time and dollar saved, workload, events by status and top actions. This Security Automation Dashboard Highlighting Resolved Events And Workload Guidelines PDF is perfect for any presentation, be it in front of clients or colleagues. It is a versatile and stylish solution for organizing your meetings. The Security Automation Dashboard Highlighting Resolved Events And Workload Guidelines PDF features a modern design for your presentation meetings. The adjustable and customizable slides provide unlimited possibilities for acing up your presentation. Slidegeeks has done all the homework before launching the product for you. So, don not wait, grab the presentation templates today.

Clustered Column Dual Branding Campaign For Product Promotion And Recognition Inspiration PDF
Get a simple yet stunning designed Clustered Column Dual Branding Campaign For Product Promotion And Recognition Inspiration PDF. It is the best one to establish the tone in your meetings. It is an excellent way to make your presentations highly effective. So, download this PPT today from Slidegeeks and see the positive impacts. Our easy-to-edit Clustered Column Dual Branding Campaign For Product Promotion And Recognition Inspiration PDF can be your go-to option for all upcoming conferences and meetings. So, what are you waiting for Grab this template today.

Business Strategy Consulting Solutions Company Outline Revenue Split By Geography And Business Areas Designs PDF
This slide showcases the revenue breakdown by geography such as Asia, North America, Australia, etc. It also covers business areas revenue split such as management consulting, IT consulting, etc. Take your projects to the next level with our ultimate collection of Business Strategy Consulting Solutions Company Outline Revenue Split By Geography And Business Areas Designs PDF. Slidegeeks has designed a range of layouts that are perfect for representing task or activity duration, keeping track of all your deadlines at a glance. Tailor these designs to your exact needs and give them a truly corporate look with your own brand colors they will make your projects stand out from the rest.

Effectiveness Of Online Media Channels Digital Marketing Strategy Deployment Graphics PDF
This slide focuses on the effectiveness of online media channels which covers email marketing, social PPC, content marketing, direct mail, etc.Get a simple yet stunning designed Effectiveness Of Online Media Channels Digital Marketing Strategy Deployment Graphics PDF. It is the best one to establish the tone in your meetings. It is an excellent way to make your presentations highly effective. So, download this PPT today from Slidegeeks and see the positive impacts. Our easy-to-edit Effectiveness Of Online Media Channels Digital Marketing Strategy Deployment Graphics PDF can be your go-to option for all upcoming conferences and meetings. So, what are you waiting for Grab this template today.

Emotional Marketing Strategy To Nurture Empowerment Branding Overview Elements Elements PDF
This Emotional Marketing Strategy To Nurture Empowerment Branding Overview Elements Elements PDF is perfect for any presentation, be it in front of clients or colleagues. It is a versatile and stylish solution for organizing your meetings. The Emotional Marketing Strategy To Nurture Empowerment Branding Overview Elements Elements PDF features a modern design for your presentation meetings. The adjustable and customizable slides provide unlimited possibilities for acing up your presentation. Slidegeeks has done all the homework before launching the product for you. So, dont wait, grab the presentation templates today.

IP Strategic Management Dashboard Ppt PowerPoint Presentation File Example PDF
This slide provides glimpse about facts and figures related to IP strategic management that can help an organization to ensure IP enforcement. It includes global patent coverage, active patients, etc. Showcasing this set of slides titled IP Strategic Management Dashboard Ppt PowerPoint Presentation File Example PDF. The topics addressed in these templates are Quarterly Annuities, Workload Distribution Firm, Active Patents. All the content presented in this PPT design is completely editable. Download it and make adjustments in color, background, font etc. as per your unique business setting.

Plastic Waste Recycling Statistics Based On Compound Annual Growth Rate Inspiration PDF
This slide covers statistics based on top countries contribution in plastic recycling and waste management. It includes report from period 2019-2025 with insights based on CAGR. Pitch your topic with ease and precision using this Plastic Waste Recycling Statistics Based On Compound Annual Growth Rate Inspiration PDF. This layout presents information on Contributes Maximum, 2015 To 2025. It is also available for immediate download and adjustment. So, changes can be made in the color, design, graphics or any other component to create a unique layout.

Post Consumer Recycled Plastic Waste Market Statistics With Growth Rate Elements PDF
This slide covers a report on plastic recycling based on future projections. It includes CAGR rate, incremental growth from 2019-2023, annual growth rate, etc. Showcasing this set of slides titled Post Consumer Recycled Plastic Waste Market Statistics With Growth Rate Elements PDF. The topics addressed in these templates are Market Acceleration, Growth CAGR, Incremental Growth, 2021 To 2023. All the content presented in this PPT design is completely editable. Download it and make adjustments in color, background, font etc. as per your unique business setting.

Customer Support Team Web Based Platform Dashboard Demonstration PDF
This slide showcases consumer service team web panel dashboard. It provides information about average customer health, churn rate, lifetime value, net promoter score, first call resolution FCR, etc. Pitch your topic with ease and precision using this Customer Support Team Web Based Platform Dashboard Demonstration PDF. This layout presents information on Churn Rate, Lifetime Value, Customer Health Score. It is also available for immediate download and adjustment. So, changes can be made in the color, design, graphics or any other component to create a unique layout.

Real Estate Firm Web Based Platform Dashboard Background PDF
This slide shows realtor service web panel dashboard. It provides information about properties for sale, sites for rent, total customers, cities, revenue, sites viewed, listings, reviews, etc. Pitch your topic with ease and precision using this Real Estate Firm Web Based Platform Dashboard Background PDF. This layout presents information on Total Revenue, Rental Locations, Properties For Sale. It is also available for immediate download and adjustment. So, changes can be made in the color, design, graphics or any other component to create a unique layout.

Candidate Job Search Web Based Platform Dashboard With Vacancy Status Infographics PDF
This slide candidate job search portal dashboard with vacancy status. It provides information about interviews schedule, application sent, profile viewed, unread message, vacancy stats, etc. Showcasing this set of slides titled Candidate Job Search Web Based Platform Dashboard With Vacancy Status Infographics PDF. The topics addressed in these templates are Candidate Job Search Web Based, Platform Dashboard. All the content presented in this PPT design is completely editable. Download it and make adjustments in color, background, font etc. as per your unique business setting.

Kpi Dashboard To Track Applicant Selection Process Ppt PowerPoint Presentation File Graphics Template PDF
This slide shows dashboard which can be used to monitor the progress of recruitment process. It includes metrics such as applications received, shortlisted applicant, selected candidates, etc. Pitch your topic with ease and precision using this Kpi Dashboard To Track Applicant Selection Process Ppt PowerPoint Presentation File Graphics Template PDF. This layout presents information on Applications Received, Shortlisted Candidates, Selected Candidates. It is also available for immediate download and adjustment. So, changes can be made in the color, design, graphics or any other component to create a unique layout.
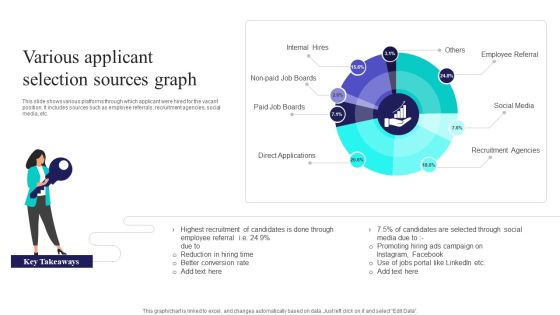
Various Applicant Selection Sources Graph Ppt PowerPoint Presentation Gallery Slide Download PDF
This slide shows various platforms through which applicant were hired for the vacant position. It includes sources such as employee referrals, recruitment agencies, social media, etc. Pitch your topic with ease and precision using this Various Applicant Selection Sources Graph Ppt PowerPoint Presentation Gallery Slide Download PDF. This layout presents information on Internal Hires, Paid Job Boards, Direct Applications. It is also available for immediate download and adjustment. So, changes can be made in the color, design, graphics or any other component to create a unique layout.

Applicant Selection Dashboard To Monitor Recruitment Process Sample PDF
This slide shows dashboard which can be used to track recruitment procedure status. It includes key performance indicators such as total open positions, total roles, selected applicant, application sources, etc. Pitch your topic with ease and precision using this Applicant Selection Dashboard To Monitor Recruitment Process Sample PDF. This layout presents information on Selection Rate, Recruitment Funnel, Application Sources. It is also available for immediate download and adjustment. So, changes can be made in the color, design, graphics or any other component to create a unique layout.
