System Architecture Diagram

Client Achievements Playbook Customer Segmentation Based On Business Type And Size Diagrams PDF
Mentioned slide shows information about the companys customer segmentation process. It shows that leads will be segmented in two phases based on business type, size, annual revenues etc. Deliver and pitch your topic in the best possible manner with this client achievements playbook customer segmentation based on business type and size diagrams pdf. Use them to share invaluable insights on number employees, annual revenues, partnership focused, service focused and impress your audience. This template can be altered and modified as per your expectations. So, grab it now.
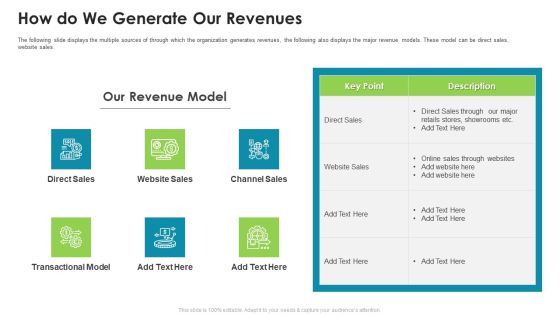
Ratan Tata Venture Capitalist Financing Pitch Deck How Do We Generate Our Revenues Diagrams PDF
The following slide displays the multiple sources of through which the organization generates revenues, the following also displays the major revenue models. These model can be direct sales, website sales.Deliver an awe-inspiring pitch with this creative ratan tata venture capitalist financing pitch deck how do we generate our revenues diagrams pdf. bundle. Topics like transactional model, channel sales, website sales, revenue model can be discussed with this completely editable template. It is available for immediate download depending on the needs and requirements of the user.

PLM Execution In Company Steps For Successful Product Phase Out Diagrams PDF
This slide represents steps for successful phase out of products that includes planning, phase out and follow-up. This is a plm execution in company steps for successful product phase out diagrams pdf template with various stages. Focus and dispense information on three stages using this creative set, that comes with editable features. It contains large content boxes to add your information on topics like obsolescence, withdraw, communicate, strategic, decision . You can also showcase facts, figures, and other relevant content using this PPT layout. Grab it now.
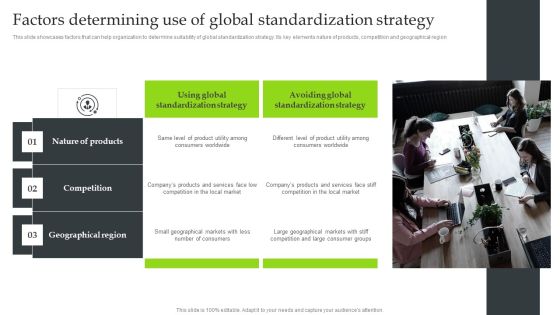
Expansion Strategic Plan Factors Determining Use Of Global Standardization Strategy Diagrams PDF
This slide showcases factors that can help organization to determine suitability of global standardization strategy. Its key elements nature of products, competition and geographical region. Present like a pro with Expansion Strategic Plan Factors Determining Use Of Global Standardization Strategy Diagrams PDF Create beautiful presentations together with your team, using our easy-to-use presentation slides. Share your ideas in real-time and make changes on the fly by downloading our templates. So whether youre in the office, on the go, or in a remote location, you can stay in sync with your team and present your ideas with confidence. With Slidegeeks presentation got a whole lot easier. Grab these presentations today.

Content Delivery And Promotion Content Marketing Channels For Product Promotion Diagrams PDF
This slide showcases evaluation of different channels that can help organization to distribute and market the content. Its key elements are media type, examples, role benefits and challenges. Present like a pro with Content Delivery And Promotion Content Marketing Channels For Product Promotion Diagrams PDF Create beautiful presentations together with your team, using our easy-to-use presentation slides. Share your ideas in real-time and make changes on the fly by downloading our templates. So whether youre in the office, on the go, or in a remote location, you can stay in sync with your team and present your ideas with confidence. With Slidegeeks presentation got a whole lot easier. Grab these presentations today.
Precooked Food Industry Analysis KPI Dashboard For Tracking Supply Chain Costs Diagrams PDF
This slide represents the KPI dashboard to track the multiple cost associated with supply chain in food manufacturing industry. It includes information regarding cash to cash cycle in days, carry cost of inventory along with details of net sales.Deliver an awe inspiring pitch with this creative Precooked Food Industry Analysis KPI Dashboard For Tracking Supply Chain Costs Diagrams PDF bundle. Topics like Processing Industry, Food Processing, Manufacturing Industry can be discussed with this completely editable template. It is available for immediate download depending on the needs and requirements of the user.
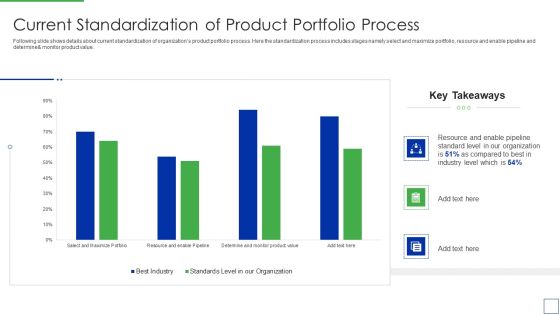
Product Portfolio Management For New Target Region Current Standardization Of Product Diagrams PDF
Following slide shows details about current standardization of organizations product portfolio process. Here the standardization process includes stages namely select and maximize portfolio, resource and enable pipeline and determine monitor product value.Deliver and pitch your topic in the best possible manner with this Product Portfolio Management For New Target Region Current Standardization Of Product Diagrams PDF Use them to share invaluable insights on Current Standardization of Product Portfolio Process and impress your audience. This template can be altered and modified as per your expectations. So, grab it now.

Supply Chain Approaches Why Do We Needsupply Chain Modelling Diagrams PDF
This slide shows the need of supply chain modelling which includes greater stock control, greater efficiency and reduces costs, greater accuracy in supply chain logistics, etc.Presenting Supply Chain Approaches Why Do We Needsupply Chain Modelling Diagrams PDF to provide visual cues and insights. Share and navigate important information on three stages that need your due attention. This template can be used to pitch topics like Determining Require, Inventory Level According, Metrics Resulting. In addtion, this PPT design contains high resolution images, graphics, etc, that are easily editable and available for immediate download.
You Tube Advertising Campaign Performance Analytics Dashboard Ppt Icon Diagrams PDF
This slide represents dashboard showing analytics of performance of you tube marketing campaign. It includes data related to no. of visitors, qualified leads, customers and annual recurring revenue, lifetime value, gross volume etc generated through the campaign. Showcasing this set of slides titled You Tube Advertising Campaign Performance Analytics Dashboard Ppt Icon Diagrams PDF. The topics addressed in these templates are Monthly Recurring Revenue, Bounce Rate, Customer Churn Rate. All the content presented in this PPT design is completely editable. Download it and make adjustments in color, background, font etc. as per your unique business setting.

Resolving Team Disputes In Organization Selecting The Best Conflict Management Strategy Diagrams PDF
The purpose of this slide is to outline various conflict management strategies which can be used to resolve issues amongst team members. The strategies highlighted in the slide are competing, avoiding, collaborating and accommodating. If your project calls for a presentation, then Slidegeeks is your go to partner because we have professionally designed, easy to edit templates that are perfect for any presentation. After downloading, you can easily edit Resolving Team Disputes In Organization Selecting The Best Conflict Management Strategy Diagrams PDF and make the changes accordingly. You can rearrange slides or fill them with different images. Check out all the handy templates
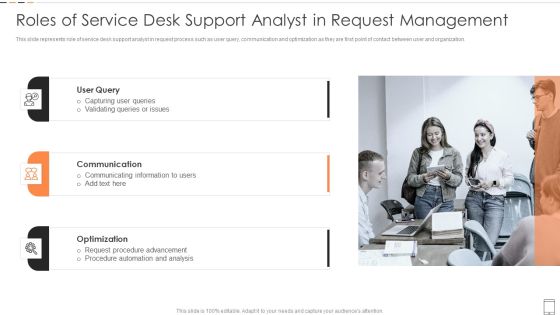
Roles Of Service Desk Support Analyst In Request Management Diagrams PDF
This slide represents role of service desk support analyst in request process such as user query, communication and optimization as they are first point of contact between user and organization.Persuade your audience using this Roles Of Service Desk Support Analyst In Request Management Diagrams PDF This PPT design covers three stages, thus making it a great tool to use. It also caters to a variety of topics including Communication, Optimization, Procedure Advancement Download this PPT design now to present a convincing pitch that not only emphasizes the topic but also showcases your presentation skills.
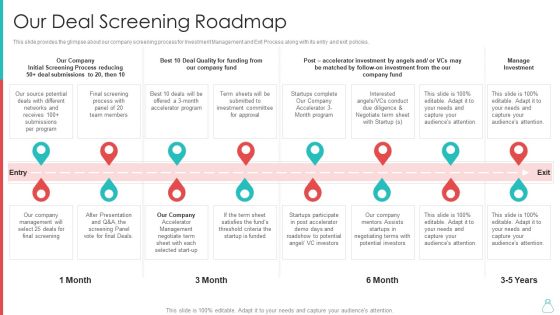
Raising Funds From Venture Capitalist Our Deal Screening Roadmap Diagrams PDF
This slide provides the glimpse about our company screening process for Investment Management and Exit Process along with its entry and exit policies. Presenting raising funds from venture capitalist our deal screening roadmap diagrams pdf to provide visual cues and insights. Share and navigate important information on four stages that need your due attention. This template can be used to pitch topics like process, investment, potential, management. In addtion, this PPT design contains high resolution images, graphics, etc, that are easily editable and available for immediate download.

Employee Engagement And Satisfaction Strategies Positive Employee Experience Summary Diagrams PDF
Here are the factors that contribute to a positive employee experience and create the best working culture in the organization. Presenting Employee Engagement And Satisfaction Strategies Positive Employee Experience Summary Diagrams PDF to provide visual cues and insights. Share and navigate important information on five stages that need your due attention. This template can be used to pitch topics like Meaningfull Work, Supportive Management, Positive Work Environment, Growth Opportunity. In addtion, this PPT design contains high resolution images, graphics, etc, that are easily editable and available for immediate download.

Client Acquisition Journey Plan Benefits Of Customer Onboarding Journey Diagrams PDF
This slide showcases the advantages of client onboarding to the company. Major benefits covered are increased efficiency, word-of-mouth referrals and revenue, reduced customer service load and churn rate. Find a pre-designed and impeccable Client Acquisition Journey Plan Benefits Of Customer Onboarding Journey Diagrams PDF. The templates can ace your presentation without additional effort. You can download these easy-to-edit presentation templates to make your presentation stand out from others. So, what are you waiting for Download the template from Slidegeeks today and give a unique touch to your presentation.
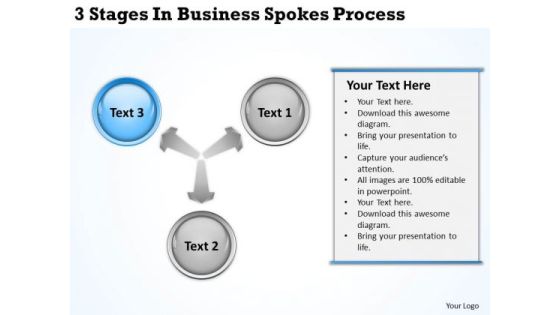
Business Context Diagrams 3 Stages Businerss Spokes Process Ppt PowerPoint Templates
We present our business context diagrams 3 stages businerss spokes process ppt PowerPoint templates.Use our Arrows PowerPoint Templates because Our PowerPoint Templates and Slides will let Your superior ideas hit the target always and everytime. Use our Ring Charts PowerPoint Templates because Our PowerPoint Templates and Slides are effectively colour coded to prioritise your plans They automatically highlight the sequence of events you desire. Download our Process and Flows PowerPoint Templates because You can Inspire your team with our PowerPoint Templates and Slides. Let the force of your ideas flow into their minds. Use our Circle Charts PowerPoint Templates because Our PowerPoint Templates and Slides will bullet point your ideas. See them fall into place one by one. Use our Business PowerPoint Templates because Watching this your Audience will Grab their eyeballs, they wont even blink.Use these PowerPoint slides for presentations relating to Arrows, blank, business, central, centralized, chart, circle, circular,circulation, concept, conceptual, converging, design, diagram, executive,icon, idea, management, map, mapping, mba, model, numbers,organization, outwards, pointing, procedure, process, radial, radiating,relationship, resource, sequence, sequential, square, strategy. The prominent colors used in the PowerPoint template are Blue light, Gray, White.
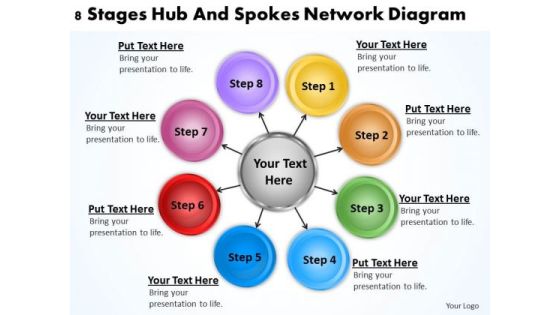
Business Process Diagrams Examples Stages Hub And Spokes Network PowerPoint Templates
We present our business process diagrams examples stages hub and spokes network PowerPoint templates.Present our Circle Charts PowerPoint Templates because You are an avid believer in ethical practices. Highlight the benefits that accrue with our PowerPoint Templates and Slides. Download and present our Arrows PowerPoint Templates because Our PowerPoint Templates and Slides help you pinpoint your timelines. Highlight the reasons for your deadlines with their use. Download our Process and Flows PowerPoint Templates because Our PowerPoint Templates and Slides will provide you the cutting edge. Slice through the doubts in the minds of your listeners. Download and present our Business PowerPoint Templates because Our PowerPoint Templates and Slides will let you Illuminate the road ahead to Pinpoint the important landmarks along the way. Download our Flow Charts PowerPoint Templates because Our PowerPoint Templates and Slides will Embellish your thoughts. They will help you illustrate the brilliance of your ideas.Use these PowerPoint slides for presentations relating to Abstract, arrows, blank, business, centralized, chart, circle, circular, circulation, concept, conceptual, converging, design, diagram, executive, icon, idea, illustration, management, model, pointing, procedure, process, radial, radiating, relationship, resource, sequence,eight, strategy, template. The prominent colors used in the PowerPoint template are Purple, Yellow, Gray.

Quarterly Non Profit Marketing Strategy For Fundraising Campaign Performance Chart Diagrams PDF
This slide depicts different strategies applied annually to gain investment for non profit organizations. It includes direct mail, event, e-mail, social media and content marketing tactics. Pitch your topic with ease and precision using this Quarterly Non Profit Marketing Strategy For Fundraising Campaign Performance Chart Diagrams PDF. This layout presents information on Marketing Strategies, Event Marketing, Social Media. It is also available for immediate download and adjustment. So, changes can be made in the color, design, graphics or any other component to create a unique layout.

Introducing AI Tools Survey Form To Measure The Effectiveness Of Online Training Course Diagrams PDF
The following slide outlines a post-training evaluation form. It covers various questions related to trainer knowledge with business process automation BPA, user interface of the training program, audio guide of the course, etc. Slidegeeks is one of the best resources for PowerPoint templates. You can download easily and regulate Introducing AI Tools Survey Form To Measure The Effectiveness Of Online Training Course Diagrams PDF for your personal presentations from our wonderful collection. A few clicks is all it takes to discover and get the most relevant and appropriate templates. Use our Templates to add a unique zing and appeal to your presentation and meetings. All the slides are easy to edit and you can use them even for advertisement purposes.

Business Services Marketing Business Case With Approach Ppt Gallery Diagrams PDF
This slide shows case study of organization that had a goal to create awareness and impress as many users as possible. It includes overview of the case, approach and end result. Persuade your audience using this Business Services Marketing Business Case With Approach Ppt Gallery Diagrams PDF. This PPT design covers three stages, thus making it a great tool to use. It also caters to a variety of topics including Overview, Result, Approach. Download this PPT design now to present a convincing pitch that not only emphasizes the topic but also showcases your presentation skills.

Client Onboarding Journey Impact On Business Impact Of Efficient Customer Onboarding Diagrams PDF
This slide showcases positive impact of proper customer onboarding process. It includes reduced customer churn rate and onboarding support tickets. Slidegeeks is one of the best resources for PowerPoint templates. You can download easily and regulate Client Onboarding Journey Impact On Business Impact Of Efficient Customer Onboarding Diagrams PDF for your personal presentations from our wonderful collection. A few clicks is all it takes to discover and get the most relevant and appropriate templates. Use our Templates to add a unique zing and appeal to your presentation and meetings. All the slides are easy to edit and you can use them even for advertisement purposes.

Approaches To Measure Brand Equity Development On Customer Model Diagrams PDF
The following slide showcase the major approaches to measuring the brand equity model which includes the brand evaluation, brand strength, output and competitive metrics. Presenting Approaches To Measure Brand Equity Development On Customer Model Diagrams PDF to dispense important information. This template comprises four stages. It also presents valuable insights into the topics including Brand Evaluation, Brand Strength, Competitive Metrics, Output Metrics. This is a completely customizable PowerPoint theme that can be put to use immediately. So, download it and address the topic impactfully.

Business Intelligence And Big Data Analytics Change Management Communication Plan Diagrams PDF
Here, we are describing the communication plan of implementing the change in data analytics project. It includes sections such as designated leader who support the change, respective departments and key actions for rationalizing the change in the process. Deliver and pitch your topic in the best possible manner with this business intelligence and big data analytics change management communication plan diagrams pdf. Use them to share invaluable insights on change management model, organization, apply data analytics and impress your audience. This template can be altered and modified as per your expectations. So, grab it now.
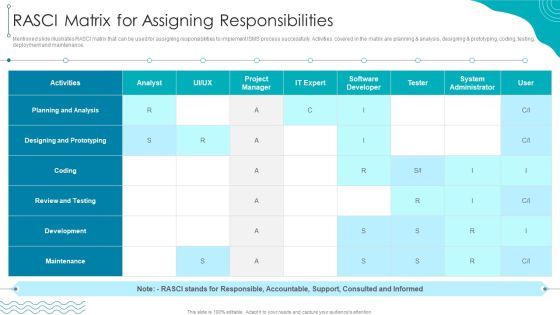
ISO 27001 Organizational Qualifying Procedure RASCI Matrix For Assigning Responsibilities Diagrams PDF
Mentioned slide illustrates RASCI matrix that can be used for assigning responsibilities to implement ISMS process successfully. Activities covered in the matrix are planning analysis, designing prototyping, coding, testing, deployment and maintenance.Deliver and pitch your topic in the best possible manner with this ISO 27001 Organizational Qualifying Procedure RASCI Matrix For Assigning Responsibilities Diagrams PDF. Use them to share invaluable insights on Designing Prototyping, Review Testing, Planning Analysis and impress your audience. This template can be altered and modified as per your expectations. So, grab it now.

E Commerce Business Return Merchandise Authorization Reply Flow Chart Diagrams PDF
This slide shows e-commerce flow chart for return material authorization. It includes steps such as RMA request from buyer, RMA generation from seller, products returned from buyer, etc. Presenting E Commerce Business Return Merchandise Authorization Reply Flow Chart Diagrams PDF to dispense important information. This template comprises one stages. It also presents valuable insights into the topics including RMA Request Buyer, Products Returned Buyer, Update Order Status. This is a completely customizable PowerPoint theme that can be put to use immediately. So, download it and address the topic impactfully.
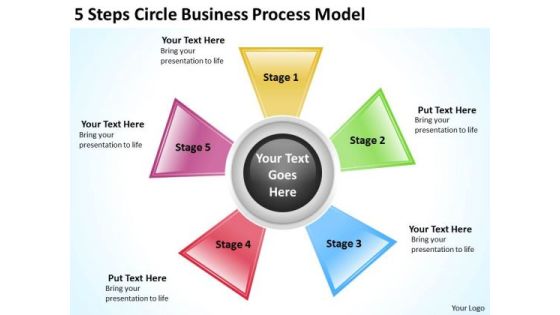
Business Process Flow Diagrams Model PowerPoint Templates Ppt Backgrounds For Slides
We present our business process flow diagrams model PowerPoint templates PPT backgrounds for slides.Use our Circle Charts PowerPoint Templates because our PowerPoint Templates and Slides are the string of your bow. Fire of your ideas and conquer the podium. Present our Business PowerPoint Templates because Our PowerPoint Templates and Slides are innately eco-friendly. Their high recall value negate the need for paper handouts. Present our Shapes PowerPoint Templates because Our PowerPoint Templates and Slides will generate and maintain the level of interest you desire. They will create the impression you want to imprint on your audience. Download and present our Process and Flows PowerPoint Templates because They will Put your wonderful verbal artistry on display. Our PowerPoint Templates and Slides will provide you the necessary glam and glitter. Present our Arrows PowerPoint Templates because Our PowerPoint Templates and Slides are aesthetically designed to attract attention. We gaurantee that they will grab all the eyeballs you need.Use these PowerPoint slides for presentations relating to Abstract, Background, Blue, Brochure, Business, Catalog, Chart, Circle, Concept, Cross, Description, Development, Diagram, Goals, Green, Guide, Illustration, Item, Management, Marketing, Model, Navigation, Parts, Pie, Plans, Presentation, Red, Reports, Round, Six, Template, Text, Title, Vector, Website, Wheel. The prominent colors used in the PowerPoint template are Pink, Yellow, Green.

Facebook Marketing Goals To Increase Brand Awareness Ppt PowerPoint Presentation File Diagrams PDF
The following slide outlines different Facebook marketing objectives that can assist companies in prioritizing their marketing activities. The goals are associated with brand awareness, website visitors, qualified leads, and customer loyalty. Take your projects to the next level with our ultimate collection of Facebook Marketing Goals To Increase Brand Awareness Ppt PowerPoint Presentation File Diagrams PDF. Slidegeeks has designed a range of layouts that are perfect for representing task or activity duration, keeping track of all your deadlines at a glance. Tailor these designs to your exact needs and give them a truly corporate look with your own brand colors they will make your projects stand out from the rest.
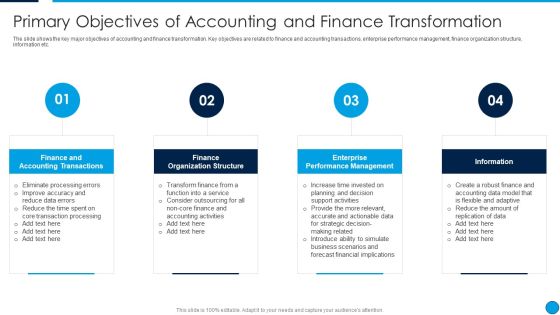
Summary Financial Primary Objectives Of Accounting And Finance Transformation Diagrams PDF
The slide shows the key major objectives of accounting and finance transformation. Key objectives are related to finance and accounting transactions, enterprise performance management, finance organization structure, information etc. This is a Summary Financial Primary Objectives Of Accounting And Finance Transformation Diagrams PDF template with various stages. Focus and dispense information on four stages using this creative set, that comes with editable features. It contains large content boxes to add your information on topics like Finance And Accounting Transaction, Finance Organization Structure, Enterprise Performance Management, Information. You can also showcase facts, figures, and other relevant content using this PPT layout. Grab it now.

Legal And Law Assistance LLP Business Commercial Conveyancing And Family Diagrams PDF
This slide highlights the law firm company legal and advisory services which includes commercial law, family law and conveyancing solution and services. This is a Legal And Law Assistance LLP Business Commercial Conveyancing And Family Diagrams PDF template with various stages. Focus and dispense information on three stages using this creative set, that comes with editable features. It contains large content boxes to add your information on topics like Commercial Law, Family Law, Conveyancing. You can also showcase facts, figures, and other relevant content using this PPT layout. Grab it now.
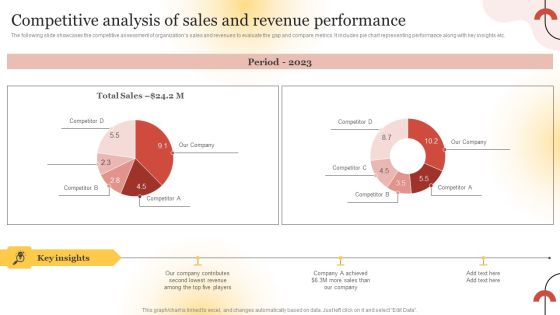
Executing Sales Risk Reduction Plan Competitive Analysis Of Sales And Revenue Performance Diagrams PDF
The following slide showcases the competitive assessment of organizations sales and revenues to evaluate the gap and compare metrics. It includes pie chart representing performance along with key insights etc. Take your projects to the next level with our ultimate collection of Executing Sales Risk Reduction Plan Competitive Analysis Of Sales And Revenue Performance Diagrams PDF. Slidegeeks has designed a range of layouts that are perfect for representing task or activity duration, keeping track of all your deadlines at a glance. Tailor these designs to your exact needs and give them a truly corporate look with your own brand colors they will make your projects stand out from the rest.

Digital Media Streaming Platform Company Profile Disney User Demographics US Diagrams PDF
The following slide highlights the segregation of Disney users based on the individual age and ethnicity for US population. It help streaming platform to develop future strategies based on demographics data analysis Take your projects to the next level with our ultimate collection of Digital Media Streaming Platform Company Profile Disney User Demographics US Diagrams PDF. Slidegeeks has designed a range of layouts that are perfect for representing task or activity duration, keeping track of all your deadlines at a glance. Tailor these designs to your exact needs and give them a truly corporate look with your own brand colors they will make your projects stand out from the rest.

Service Level Agreement KPI Dashboard Indicating Violation Count And Overdue Requests Diagrams PDF
This graph or chart is linked to excel, and changes automatically based on data. Just left click on it and select Edit Data. Showcasing this set of slides titled Service Level Agreement KPI Dashboard Indicating Violation Count And Overdue Requests Diagrams PDF. The topics addressed in these templates are Total Requests Category, Total Requests Status, Urgent Requests. All the content presented in this PPT design is completely editable. Download it and make adjustments in color, background, font etc. as per your unique business setting.
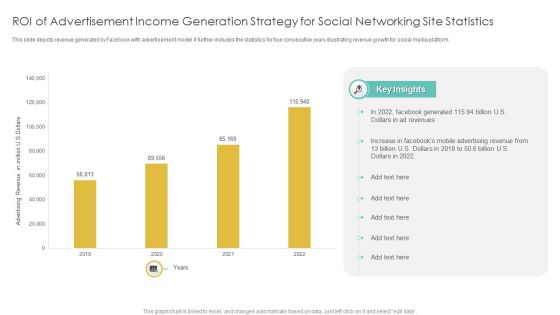
Roi Of Advertisement Income Generation Strategy For Social Networking Site Statistics Diagrams PDF
This slide depicts revenue generated by Facebook with advertisement model. It further includes the statistics for four consecutive years illustrating revenue growth for social media platform. Pitch your topic with ease and precision using this Roi Of Advertisement Income Generation Strategy For Social Networking Site Statistics Diagrams PDF. This layout presents information on Advertisement Income, Generation Strategy, Social Networking Site Statistics. It is also available for immediate download and adjustment. So, changes can be made in the color, design, graphics or any other component to create a unique layout.
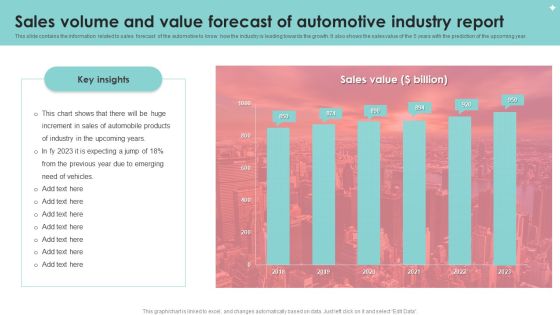
Sales Volume And Value Forecast Of Automotive Industry Report Diagrams PDF
This slide contains the information related to sales forecast of the automotive to know how the industry is leading towards the growth. It also shows the sales value of the 5 years with the prediction of the upcoming year. Showcasing this set of slides titled Sales Volume And Value Forecast Of Automotive Industry Report Diagrams PDF. The topics addressed in these templates are Sales Volume, Value Forecast, Automotive Industry Report. All the content presented in this PPT design is completely editable. Download it and make adjustments in color, background, font etc. as per your unique business setting.

Insider Threat In Cyber Security Detection And Prevention Dashboard Diagrams PDF
This slide shows dashboard for detecting and preventing insider threats. It provides details about antivirus, vector detection, patch, admin access, email security, network and endpoint threat, etc. Pitch your topic with ease and precision using this Insider Threat In Cyber Security Detection And Prevention Dashboard Diagrams PDF. This layout presents information on Active Clients, Network Threat Prevention, Endpoint Threat Prevention. It is also available for immediate download and adjustment. So, changes can be made in the color, design, graphics or any other component to create a unique layout.
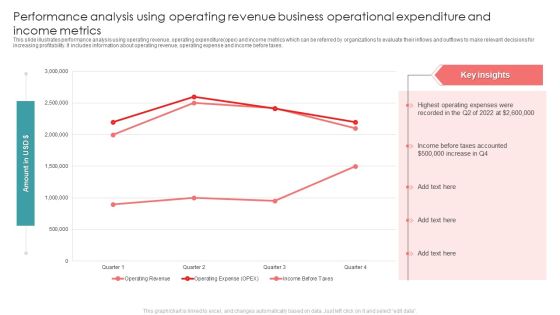
Performance Analysis Using Operating Revenue Business Operational Expenditure And Income Metrics Diagrams PDF
This slide illustrates performance analysis using operating revenue, operating expenditure opex and income metrics which can be referred by organizations to evaluate their inflows and outflows to make relevant decisions for increasing profitability. It includes information about operating revenue, operating expense and income before taxes. Pitch your topic with ease and precision using this Performance Analysis Using Operating Revenue Business Operational Expenditure And Income Metrics Diagrams PDF. This layout presents information on Taxes, Highest Operating, Recorded. It is also available for immediate download and adjustment. So, changes can be made in the color, design, graphics or any other component to create a unique layout.

COVID Impact Analysis On Food And Transportation Industry Ppt Infographic Template Diagrams PDF
This slide depicts impact of COVID-19 on multiple services of travel and tourism industry. It includes operations such as food services, lodging, air transportation, retail, recreation and amusement. Showcasing this set of slides titled COVID Impact Analysis On Food And Transportation Industry Ppt Infographic Template Diagrams PDF. The topics addressed in these templates are Food Services, Air Transportation Faced, Restrictions Travel Policy. All the content presented in this PPT design is completely editable. Download it and make adjustments in color, background, font etc. as per your unique business setting.

Social Media Team Organizational Chart Customer Group Engagement Through Social Media Channels Diagrams PDF
The following slide showcases social media team hierarchal structure. It provides information about chief marketing officer CMO, social media manager, community manager, content creator, social media analyst, campaign manager, subject matter expert, etc. This is a Social Media Team Organizational Chart Customer Group Engagement Through Social Media Channels Diagrams PDF template with various stages. Focus and dispense information on two stages using this creative set, that comes with editable features. It contains large content boxes to add your information on topics like Social Media Manager, Chief Marketing Officer, Community Manager. You can also showcase facts, figures, and other relevant content using this PPT layout. Grab it now.

Funneled Focus Marketing Strategies Action Plan Playbook For Influencer Reel Marketing Diagrams PDF
The following slide displays funneled focus strategy as a marketing tool for organization, as it provides an overview of the entire strategic process and highlights key customer journey touch points.Presenting Funneled Focus Marketing Strategies Action Plan Playbook For Influencer Reel Marketing Diagrams PDF to provide visual cues and insights. Share and navigate important information on three stages that need your due attention. This template can be used to pitch topics like Awareness, Consideration, Decision Stage. In addtion, this PPT design contains high resolution images, graphics, etc, that are easily editable and available for immediate download.

Introduction To Corporate Business Playbook Guide To Enhance Organic Growth By Advancing Diagrams PDF
Purpose of the following slide is to provide an overview of the corporate business playbook as it displays an introduction to the same. The tabular representation displayed below highlights various parts of the playbook, description and page number.Presenting Introduction To Corporate Business Playbook Guide To Enhance Organic Growth By Advancing Diagrams PDF to provide visual cues and insights. Share and navigate important information on one stage that need your due attention. This template can be used to pitch topics like Governance Structure, Organization Process, Canvas Policies. In addtion, this PPT design contains high resolution images, graphics, etc, that are easily editable and available for immediate download.
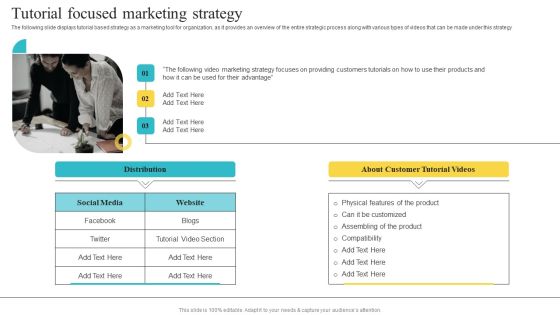
Tutorial Focused Marketing Strategy Playbook For Social Media Platform Video Marketing Diagrams PDF
The following slide displays tutorial based strategy as a marketing tool for organization, as it provides an overview of the entire strategic process along with various types of videos that can be made under this strategy. Presenting Tutorial Focused Marketing Strategy Playbook For Social Media Platform Video Marketing Diagrams PDF to provide visual cues and insights. Share and navigate important information on three stages that need your due attention. This template can be used to pitch topics like Marketing Strategy, Providing Customers, Their Advantage. In addtion, this PPT design contains high resolution images, graphics, etc, that are easily editable and available for immediate download.

Business Process Diagrams And Roles Ppt PowerPoint Templates Backgrounds For Slides
We present our business process diagrams and roles ppt PowerPoint templates backgrounds for slides.Download and present our Advertising PowerPoint Templates because you can Set pulses racing with our PowerPoint Templates and Slides. They will raise the expectations of your team. Download our Arrows PowerPoint Templates because Our PowerPoint Templates and Slides offer you the needful to organise your thoughts. Use them to list out your views in a logical sequence. Present our Circle Charts PowerPoint Templates because Our PowerPoint Templates and Slides will weave a web of your great ideas. They are gauranteed to attract even the most critical of your colleagues. Use our Business PowerPoint Templates because Our PowerPoint Templates and Slides ensures Effective communication. They help you put across your views with precision and clarity. Download and present our Shapes PowerPoint Templates because Our PowerPoint Templates and Slides will give good value for money. They also have respect for the value of your time.Use these PowerPoint slides for presentations relating to Arrow, box, brochure, business, button, catalog, chart, circle, company, cross, data, design, diagram, direction, document, financial, glossy, goals, graph, junction, management, market, marketing, model, multiple, navigation, network, options, pie, plan, presentation, process, results, shiny, six, sphere, statistics, stock, structure, template, vector, website. The prominent colors used in the PowerPoint template are Blue, Gray, Black.
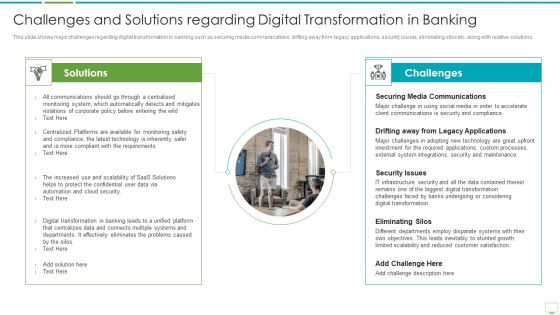
Major Advantages Of Banking Industry Revolution Challenges And Solutions Regarding Diagrams PDF
This slide shows the benefits of mobile banking that improves and enhances the banking services and leads to a positive digital banking transformation such as 24 7 service availability, paperless transactions, facilitation of location-based services, increased efficiency and compliance etc. Presenting major advantages of banking industry revolution challenges and solutions regarding diagrams pdf to provide visual cues and insights. Share and navigate important information on two stages that need your due attention. This template can be used to pitch topics like securing media communications, drifting away from legacy applications, security issues In addtion, this PPT design contains high resolution images, graphics, etc, that are easily editable and available for immediate download.
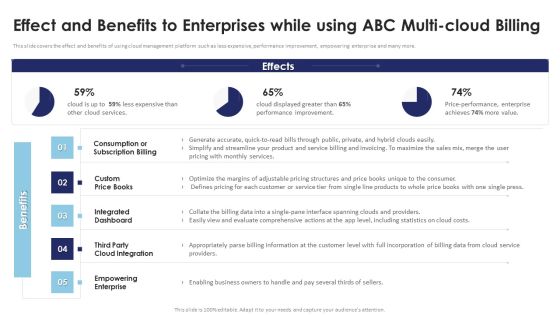
Multi Cloud Infrastructure Management Effect And Benefits To Enterprises While Using ABC Diagrams PDF
This slide covers the effect and benefits of using cloud management platform such as less expensive, performance improvement, empowering enterprise and many more. If your project calls for a presentation, then Slidegeeks is your go-to partner because we have professionally designed, easy-to-edit templates that are perfect for any presentation. After downloading, you can easily edit Multi Cloud Infrastructure Management Effect And Benefits To Enterprises While Using ABC Diagrams PDF and make the changes accordingly. You can rearrange slides or fill them with different images. Check out all the handy templates

Quantum Key Distribution Artificial Intelligence And Machine Learning With Quantum Computing Diagrams PDF
This slide depicts how quantum computing would be beneficial when using artificial intelligence and machine learning. It also shows that how data is processed in classic machine learning and quantum machine learning. Deliver an awe inspiring pitch with this creative Quantum Key Distribution Artificial Intelligence And Machine Learning With Quantum Computing Diagrams PDF bundle. Topics like Machine Learning, Quantum Machine, Processing Methods can be discussed with this completely editable template. It is available for immediate download depending on the needs and requirements of the user.

Tactical Brand Extension Launching Determining The Characteristics Of A Good Brand Diagrams PDF
This slide provides information about the characteristics that helps brand in developing an effective positioning strategy. Characteristics covered are relevant, unique, clear and recognizable. Slidegeeks is one of the best resources for PowerPoint templates. You can download easily and regulate Tactical Brand Extension Launching Determining The Characteristics Of A Good Brand Diagrams PDF for your personal presentations from our wonderful collection. A few clicks is all it takes to discover and get the most relevant and appropriate templates. Use our Templates to add a unique zing and appeal to your presentation and meetings. All the slides are easy to edit and you can use them even for advertisement purposes.

Executing Private Label Strategy 4 Prioritize Innovation In Product Development Diagrams PDF
This slide represents prioritization of product innovation in product lifecycle. It covers 5 stages such as development, introduction, growth, maturity and decline. Make sure to capture your audiences attention in your business displays with our gratis customizable Executing Private Label Strategy 4 Prioritize Innovation In Product Development Diagrams PDF. These are great for business strategies, office conferences, capital raising or task suggestions. If you desire to acquire more customers for your tech business and ensure they stay satisfied, create your own sales presentation with these plain slides.

Editable Layers 3d Business Pyramid PowerPoint Slides And Ppt Diagrams Templates
Editable Layers 3D Business Pyramid PowerPoint Slides And PPT Diagrams Templates-These high quality powerpoint pre-designed slides and powerpoint templates have been carefully created by our professional team to help you impress your audience. All slides have been created and are 100% editable in powerpoint. Each and every property of any graphic - color, size, orientation, shading, outline etc. can be modified to help you build an effective powerpoint presentation. Any text can be entered at any point in the powerpoint template or slide. Simply DOWNLOAD, TYPE and PRESENT!

Find Solution Rubiks Cube PowerPoint Slides And Ppt Diagrams Ppt Templates
Find Solution Rubiks Cube PowerPoint Slides and PPT Diagrams PPT TemplatesThese high quality powerpoint pre-designed slides and powerpoint templates have been carefully created by our professional team to help you impress your audience. All slides have been created and are 100% editable in powerpoint. Each and every property of any graphic - color, size, orientation, shading, outline etc. can be modified to help you build an effective powerpoint presentation. Any text can be entered at any point in the powerpoint template or slide. Simply DOWNLOAD, TYPE and PRESENT!

Deploying AI To Enhance Employee Awareness Training Budget For FY2023 Diagrams PDF
This slide outlines the employee awareness training budget for the financial year 2023. The budget details include the training provider name, training date, duration of the training, budget, qualification, capability level, and refresh or renewal. If your project calls for a presentation, then Slidegeeks is your go-to partner because we have professionally designed, easy-to-edit templates that are perfect for any presentation. After downloading, you can easily edit Deploying AI To Enhance Employee Awareness Training Budget For FY2023 Diagrams PDF and make the changes accordingly. You can rearrange slides or fill them with different images. Check out all the handy templates

Introducing New Food Commodity Deciding The Right Pricing Strategy For Product Diagrams PDF
The following slide outlines various pricing strategies which can be used to determine the right price of new product. The strategies are skimming, premium, economy and penetration. Find a pre-designed and impeccable Introducing New Food Commodity Deciding The Right Pricing Strategy For Product Diagrams PDF. The templates can ace your presentation without additional effort. You can download these easy-to-edit presentation templates to make your presentation stand out from others. So, what are you waiting for Download the template from Slidegeeks today and give a unique touch to your presentation.

Strategic Database Accessibility Management Objectives On Multiple Domain Icon Diagrams PDF
This slide covers 3 main goals of data lifecycle management to organise large data volumes . It includes objectives such as data confidentiality , data availability and long-term structural integrity.Pitch your topic with ease and precision using this Strategic Database Accessibility Management Objectives On Multiple Domain Icon Diagrams PDF. This layout presents information on Strategic Database, Accessibility Management, Objectives On Multiple. It is also available for immediate download and adjustment. So, changes can be made in the color, design, graphics or any other component to create a unique layout.

Customer Support Services Company Profile Mission Vision And Core Values Diagrams PDF
This slide highlights the customer care companys long and short-term goals along with the core values connected, committed and creative. This is a Customer Support Services Company Profile Mission Vision And Core Values Diagrams PDF template with various stages. Focus and dispense information on three stages using this creative set, that comes with editable features. It contains large content boxes to add your information on topics like Mission, Vision, Core Values. You can also showcase facts, figures, and other relevant content using this PPT layout. Grab it now.

Company Top Consulting Projects Progress Status Report Comparison Summary Diagrams PDF
The following slide showcases the status of two projects of a consulting services firm. The slide covers new, opened, in progress, completed and projects kept on hold. Pitch your topic with ease and precision using this Company Top Consulting Projects Progress Status Report Comparison Summary Diagrams PDF. This layout presents information on Company Top Consulting Projects Progress, Status Report Comparison Summary. It is also available for immediate download and adjustment. So, changes can be made in the color, design, graphics or any other component to create a unique layout.

Brand Engagement Promotional Campaign Implementation Key Impact Of Promotional Event For Brand Awareness Diagrams PDF
This slide represents key impacts for promotional event. It covers site traffic, ROAS, customer lifetime value, engaged visit rate, page value etc. Find a pre designed and impeccable Brand Engagement Promotional Campaign Implementation Key Impact Of Promotional Event For Brand Awareness Diagrams PDF. The templates can ace your presentation without additional effort. You can download these easy to edit presentation templates to make your presentation stand out from others. So, what are you waiting for Download the template from Slidegeeks today and give a unique touch to your presentation.

B2B And B2C Startups Marketing Mix Strategies 70 20 10 Rule Social Media Marketing Diagrams PDF
Purpose of the following slide is to display the best practices of utilizing social media marketing. It displays the 70 20 10 rule which defines the type of content to be posted on various social media platforms. Find a pre designed and impeccable B2B And B2C Startups Marketing Mix Strategies 70 20 10 Rule Social Media Marketing Diagrams PDF. The templates can ace your presentation without additional effort. You can download these easy to edit presentation templates to make your presentation stand out from others. So, what are you waiting for Download the template from Slidegeeks today and give a unique touch to your presentation.
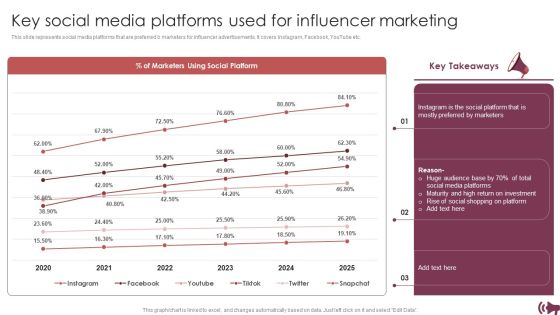
Guide Digital Advertising Optimize Lead Targeting Key Social Media Platforms Used For Influencer Marketing Diagrams PDF
This slide represents social media platforms that are preferred b marketers for influencer advertisements. It covers Instagram, Facebook, YouTube etc. Find a pre designed and impeccable Guide Digital Advertising Optimize Lead Targeting Key Social Media Platforms Used For Influencer Marketing Diagrams PDF. The templates can ace your presentation without additional effort. You can download these easy to edit presentation templates to make your presentation stand out from others. So, what are you waiting for Download the template from Slidegeeks today and give a unique touch to your presentation.
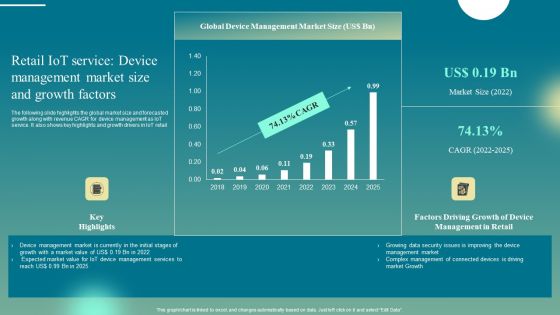
Retail Iot Service Device Management Market Size And Growth Factors Diagrams PDF
The following slide highlights the global market size and forecasted growth along with revenue CAGR for device management as IoT service. It also shows key highlights and growth drivers in IoT retail. If your project calls for a presentation, then Slidegeeks is your go-to partner because we have professionally designed, easy-to-edit templates that are perfect for any presentation. After downloading, you can easily edit Retail Iot Service Device Management Market Size And Growth Factors Diagrams PDF and make the changes accordingly. You can rearrange slides or fill them with different images. Check out all the handy templates

Corporate Financial KPI Dashboard To Statement Cash Flow Of Company Diagrams PDF
This slide presents a financial dashboard of an enterprise which is being used to report the total spending power of a company. Key performing indicators include cash burn rate, monthly expenses, solvency etc. Showcasing this set of slides titled Corporate Financial KPI Dashboard To Statement Cash Flow Of Company Diagrams PDF. The topics addressed in these templates are Solvency, Debtors, Monthly Expenses. All the content presented in this PPT design is completely editable. Download it and make adjustments in color, background, font etc. as per your unique business setting.

Deploying AI To Enhance Comparison Between 3D Printing And Traditional Diagrams PDF
This slide talks about the comparison between 3D printing technology and traditional manufacturing based on cost, design, speed, and quality of the product. It also includes how 3D printing can save energy consumption compared to conventional logistical processes. Present like a pro with Deploying AI To Enhance Comparison Between 3D Printing And Traditional Diagrams PDF Create beautiful presentations together with your team, using our easy-to-use presentation slides. Share your ideas in real-time and make changes on the fly by downloading our templates. So whether youre in the office, on the go, or in a remote location, you can stay in sync with your team and present your ideas with confidence. With Slidegeeks presentation got a whole lot easier. Grab these presentations today.
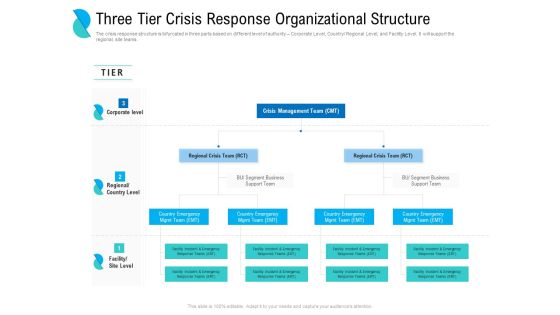
Determining Crisis Management BCP Three Tier Crisis Response Organizational Structure Diagrams PDF
The crisis response structure is bifurcated in three parts based on different level of authority Corporate Level, Country or Regional Level, and Facility Level. It will support the regional, site teams. Presenting determining crisis management bcp three tier crisis response organizational structure diagrams pdf. to provide visual cues and insights. Share and navigate important information on three stages that need your due attention. This template can be used to pitch topics like corporate level, regional country level, crisis management team cmt, regional crisis team rct regional crisis team rct. In addtion, this PPT design contains high resolution images, graphics, etc, that are easily editable and available for immediate download.

Effective Positioning Strategy Plan Coca Cola Mind Map For Understanding Companygcos Diagrams PDF
This slide covers a perpetual road map for the Coca-Cola brand. It includes various components of the map such as market segmentation, targeting, positioning, etc. Presenting Effective Positioning Strategy Plan Coca Cola Mind Map For Understanding Companygcos Diagrams PDF to provide visual cues and insights. Share and navigate important information on seven stages that need your due attention. This template can be used to pitch topics like Market segmentation, Targeting, Positioning. In addtion, this PPT design contains high resolution images, graphics, etc, that are easily editable and available for immediate download.

Impact Of Product Development Strategies Post Implementation Product Development Diagrams PDF
This slide represents impact of product development strategies. It highlights sales percentage, product headcount, product sales, patent generation etc.Do you know about Slidesgeeks Impact Of Product Development Strategies Post Implementation Product Development Diagrams PDF These are perfect for delivering any kind od presentation. Using it, create PowerPoint presentations that communicate your ideas and engage audiences. Save time and effort by using our pre-designed presentation templates that are perfect for a wide range of topic. Our vast selection of designs covers a range of styles, from creative to business, and are all highly customizable and easy to edit. Download as a PowerPoint template or use them as Google Slides themes.

Raise Funding From Pre Seed Capital Exit Strategy For The Pre Seed Investors Diagrams PDF
The slide provides most profitable or feasible ways for investors to exit from their investment in the company. It includes IPO, merger, private offerings, acquisition by venture capital firm etc. Persuade your audience using this raise funding from pre seed capital exit strategy for the pre seed investors diagrams pdf. This PPT design covers five stages, thus making it a great tool to use. It also caters to a variety of topics including initial public offer, private offerings, acquisition by venture capital. Download this PPT design now to present a convincing pitch that not only emphasizes the topic but also showcases your presentation skills.
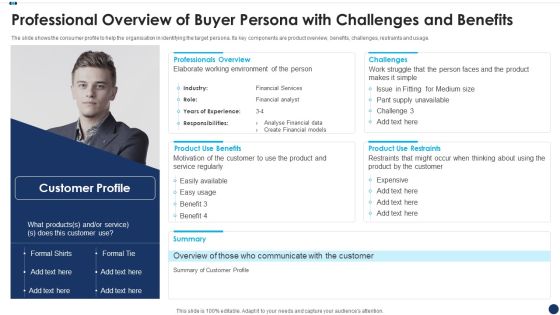
Professional Overview Of Buyer Persona With Challenges And Benefits Diagrams PDF
The slide shows the consumer profile to help the organisation in identifying the target persona. Its key components are product overview, benefits, challenges, restraints and usage. Persuade your audience using this Professional Overview Of Buyer Persona With Challenges And Benefits Diagrams PDF. This PPT design covers one stages, thus making it a great tool to use. It also caters to a variety of topics including Product Use Benefits, Professionals Overview, Product Use Restraints. Download this PPT design now to present a convincing pitch that not only emphasizes the topic but also showcases your presentation skills.
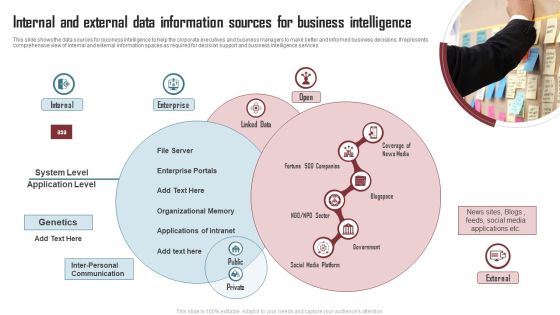
Internal And External Data Information Sources For Business Intelligence Diagrams PDF
This slide shows the data sources for business intelligence to help the corporate executives and business managers to make better and informed business decisions. It represents comprehensive view of internal and external information spaces as required for decision support and business intelligence services. Persuade your audience using this Internal And External Data Information Sources For Business Intelligence Diagrams PDF. This PPT design covers One stage, thus making it a great tool to use. It also caters to a variety of topics including File Server, Enterprise Portals, Organizational Memory. Download this PPT design now to present a convincing pitch that not only emphasizes the topic but also showcases your presentation skills.

Procedure For Conducting Crisis Response Evacuation Drill At Workplace Diagrams PDF
This slide mentions the procedure for conducting emergency evacuation drill at workplace. It includes activities to perform prior, during and after the drill is completed. Persuade your audience using this Procedure For Conducting Crisis Response Evacuation Drill At Workplace Diagrams PDF. This PPT design covers Three stages, thus making it a great tool to use. It also caters to a variety of topics including Prior Drill, Conducting The Drill, After The Drill. Download this PPT design now to present a convincing pitch that not only emphasizes the topic but also showcases your presentation skills.

Strategies Of Launching New Strategies Of Product To Market Diagrams PDF
This slide showcases different tactics of launching a product into the market i.e before launch,launch and after launch. It includes strategies like planning social media, advance outreach, launch events, measure impact, sustain buzz etc. Persuade your audience using this Strategies Of Launching New Strategies Of Product To Market Diagrams PDF. This PPT design covers Three stages, thus making it a great tool to use. It also caters to a variety of topics including Before Launch, Launch, After Launch. Download this PPT design now to present a convincing pitch that not only emphasizes the topic but also showcases your presentation skills.

Best Practices For Successful Mergers And Acquisitions Strategy Deals Diagrams PDF
Following slide exhibits best practices for mergers and acquisitions that increase market share. It presents information related to creating team, seeking quality, etc. Persuade your audience using this Best Practices For Successful Mergers And Acquisitions Strategy Deals Diagrams PDF. This PPT design covers five stages, thus making it a great tool to use. It also caters to a variety of topics including Create Dedicated, Seek Quality, Strategy. Download this PPT design now to present a convincing pitch that not only emphasizes the topic but also showcases your presentation skills.
Digital Marketing Advisory Project Timeline Ppt PowerPoint Presentation Icon Diagrams PDF
Following slide showcase consulting project digital marketing campaign timeline which includes multiple tasks and activities such as- need assessment, target market assessment, content writing and email campaign. Pitch your topic with ease and precision using this digital marketing advisory project timeline ppt powerpoint presentation icon diagrams pdf. This layout presents information on digital marketing advisory project timeline . It is also available for immediate download and adjustment. So, changes can be made in the color, design, graphics or any other component to create a unique layout.

Streamlining Manufacturing Processes With Workflow Automation Members Involved In Workflow Automation Project Team Diagrams PDF
This slide provide information about the workflow automation project team. It provide information about subject matter expert, automation engineer, project lead, data analyst, IT ops, machine learning engineer, delivery manager. Coming up with a presentation necessitates that the majority of the effort goes into the content and the message you intend to convey. The visuals of a PowerPoint presentation can only be effective if it supplements and supports the story that is being told. Keeping this in mind our experts created Streamlining Manufacturing Processes With Workflow Automation Members Involved In Workflow Automation Project Team Diagrams PDF to reduce the time that goes into designing the presentation. This way, you can concentrate on the message while our designers take care of providing you with the right template for the situation.

Security Information And Event Management Strategies For Financial Audit And Compliance Cloud SIEM Model Diagrams PDF
This slide covers the cloud SIEM and self managed model wherein the client take care of mostly all the security incident and event management process on its own except aggregation and collection. Deliver and pitch your topic in the best possible manner with this security information and event management strategies for financial audit and compliance cloud siem model diagrams pdf. Use them to share invaluable insights on visualization, alerting, analytics, reporting, retention and impress your audience. This template can be altered and modified as per your expectations. So, grab it now.

Commercial Bank Financial Services Company Profile Financial Banking Group Case Study Diagrams PDF
This slide shows the case study which includes challenge faced by client in document processing resulting in shipping delays and inefficiencies our bank provided eDocs and cross bank integration solutions. This is a Commercial Bank Financial Services Company Profile Financial Banking Group Case Study Diagrams PDF template with various stages. Focus and dispense information on three stages using this creative set, that comes with editable features. It contains large content boxes to add your information on topics like Challenge, Solution, Result. You can also showcase facts, figures, and other relevant content using this PPT layout. Grab it now.

Virtual Currency Investment Guide For Companies Dashboard To Effectively Track Bitcoin Diagrams PDF
The following dashboard highlights key parameters that can be used by the organization to track the performance of their bitcoin investment, it enlists major KPIs such as price of bitcoin, transaction chart and its historical performance. Deliver an awe inspiring pitch with this creative Virtual Currency Investment Guide For Companies Dashboard To Effectively Track Bitcoin Diagrams PDF bundle. Topics like Prediction Meter, Todays Market Activity, Transaction Chart can be discussed with this completely editable template. It is available for immediate download depending on the needs and requirements of the user.

Strategic Toolkit For Brand Performance Enhancement Vision Mission And Goals Associated With Brand Diagrams PDF
This slide provides information regarding effective brand building strategy that includes key elements such as vision, purpose, values, goals in terms of sales, market share, distribution, market penetration percent, etc. If your project calls for a presentation, then Slidegeeks is your go to partner because we have professionally designed, easy to edit templates that are perfect for any presentation. After downloading, you can easily edit Strategic Toolkit For Brand Performance Enhancement Vision Mission And Goals Associated With Brand Diagrams PDF and make the changes accordingly. You can rearrange slides or fill them with different images. Check out all the handy templates

Table Of Contents Estimating Business Overall Health With Financial Planning And Assessment Diagrams PDF
This Table Of Contents Estimating Business Overall Health With Financial Planning And Assessment Diagrams PDF from Slidegeeks makes it easy to present information on your topic with precision. It provides customization options, so you can make changes to the colors, design, graphics, or any other component to create a unique layout. It is also available for immediate download, so you can begin using it right away. Slidegeeks has done good research to ensure that you have everything you need to make your presentation stand out. Make a name out there for a brilliant performance.

Business Analyst Diagrams 3d Man Walking On Puzzle Pieces PowerPoint Slides
We present our business analyst diagrams 3d man walking on puzzle pieces PowerPoint Slides.Present our Game PowerPoint Templates because Our PowerPoint Templates and Slides help you pinpoint your timelines. Highlight the reasons for your deadlines with their use. Present our Success PowerPoint Templates because Our PowerPoint Templates and Slides are endowed to endure. Ideas conveyed through them will pass the test of time. Present our Business PowerPoint Templates because You have the co-ordinates for your destination of success. Let our PowerPoint Templates and Slides map out your journey. Use our Puzzles or Jigsaws PowerPoint Templates because You can Inspire your team with our PowerPoint Templates and Slides. Let the force of your ideas flow into their minds. Present our Game Pieces PowerPoint Templates because You are an avid believer in ethical practices. Highlight the benefits that accrue with our PowerPoint Templates and Slides.Use these PowerPoint slides for presentations relating to 3d, Background, Blue, Business, Career, Color, Colorful, Complete, Connection, Employment, Entrance, Figure, Game, Graphic, Green, Guy, Human, Illustration, Image, Isolated, Life, Lifestyle, Male, Man, Match, Motion, Moving, Passage, Path, People, Person, Piece, Play, Purpose, Puzzle, Red, Render, Rendered, Schedule, Step, Success, Three-Dimensional, Walk, Way, White, Yellow. The prominent colors used in the PowerPoint template are Blue, Yellow, Green. PowerPoint presentation experts tell us our business analyst diagrams 3d man walking on puzzle pieces PowerPoint Slides are designed by professionals Use our Blue PowerPoint templates and PPT Slides are aesthetically designed to attract attention. We guarantee that they will grab all the eyeballs you need. You can be sure our business analyst diagrams 3d man walking on puzzle pieces PowerPoint Slides provide great value for your money. Be assured of finding the best projection to highlight your words. Presenters tell us our Colorful PowerPoint templates and PPT Slides are designed to make your presentations professional. You can be sure our business analyst diagrams 3d man walking on puzzle pieces PowerPoint Slides are visually appealing. Professionals tell us our Business PowerPoint templates and PPT Slides will help you be quick off the draw. Just enter your specific text and see your points hit home.

Sequoia Company Capital Raising Elevator What Does The Market Competition Looks Like Diagrams PDF
The following slide displays the market competition as it highlights the Industry by its application along with the market share and the name of the market competitors. Deliver and pitch your topic in the best possible manner with this sequoia company capital raising elevator what does the market competition looks like diagrams pdf. Use them to share invaluable insights on enterprise, commercial, consumer, market share and impress your audience. This template can be altered and modified as per your expectations. So, grab it now.

Strategic Management Consultancy Business Profile Revenue Split By Geography And Business Areas Diagrams PDF
This slide showcases the revenue breakdown by geography such as Asia, North America, Australia, etc. It also covers business areas revenue split such as management consulting, IT consulting, etc. Deliver and pitch your topic in the best possible manner with this Strategic Management Consultancy Business Profile Revenue Split By Geography And Business Areas Diagrams PDF. Use them to share invaluable insights on Demand For Management, Consulting Services, Revenue and impress your audience. This template can be altered and modified as per your expectations. So, grab it now.

Mitigation Plan For Resolving Encountered Threat Information Security Risk Administration Diagrams PDF
Mentioned slide shows mitigation plan for resolving encountered threat. It covers details about encountered threat, its description, risk level, mitigation plan, resources required, responsible person, expected resolution time and communication mode.Slidegeeks has constructed Mitigation Plan For Resolving Encountered Threat Information Security Risk Administration Diagrams PDF after conducting extensive research and examination. These presentation templates are constantly being generated and modified based on user preferences and critiques from editors. Here, you will find the most attractive templates for a range of purposes while taking into account ratings and remarks from users regarding the content. This is an excellent jumping-off point to explore our content and will give new users an insight into our top-notch PowerPoint Templates.
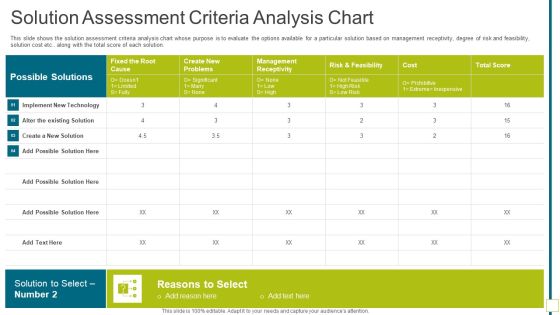
Solution Assessment Criteria Analysis Chart Solution Evaluation Validation Meet Organizational Needs Diagrams PDF
This slide shows the solution assessment criteria analysis chart whose purpose is to evaluate the options available for a particular solution based on management receptivity, degree of risk and feasibility, solution cost etc.. along with the total score of each solution. Deliver and pitch your topic in the best possible manner with this solution assessment criteria analysis chart solution evaluation validation meet organizational needs diagrams pdf. Use them to share invaluable insights on solution assessment criteria analysis chart and impress your audience. This template can be altered and modified as per your expectations. So, grab it now.
Business Model Diagrams 3d Men Giving Gift To Other Events PowerPoint Slides
We present our business model diagrams 3d men giving gift to other events PowerPoint Slides.Present our People PowerPoint Templates because Our PowerPoint Templates and Slides will give good value for money. They also have respect for the value of your time. Download our Holidays PowerPoint Templates because You can Bait your audience with our PowerPoint Templates and Slides. They will bite the hook of your ideas in large numbers. Present our Boxes PowerPoint Templates because Our PowerPoint Templates and Slides offer you the widest possible range of options. Download and present our Christmas PowerPoint Templates because Our PowerPoint Templates and Slides come in all colours, shades and hues. They help highlight every nuance of your views. Present our Festival PowerPoint Templates because Our PowerPoint Templates and Slides are like the strings of a tennis racquet. Well strung to help you serve aces.Use these PowerPoint slides for presentations relating to 3d, anniversary, birthday, blank, bow, box, cardboard, celebration, character, christmas, event, figure, gift, greeting, guy, hands, happy, holiday, human, icon, idea, illustration, legs, love, men, new, package, packaging, party, people, person, present, puppet, red, ribbon, seasonal, shiny, shopping, single, studio, surprise, tag, to give, valentine's day, walk, warp, wedding, white, xmas, year. The prominent colors used in the PowerPoint template are Green, Gray, Yellow. Professionals tell us our business model diagrams 3d men giving gift to other events PowerPoint Slides will impress their bosses and teams. The feedback we get is that our birthday PowerPoint templates and PPT Slides will make you look like a winner. PowerPoint presentation experts tell us our business model diagrams 3d men giving gift to other events PowerPoint Slides are the best it can get when it comes to presenting. You can be sure our box PowerPoint templates and PPT Slides will make the presenter look like a pro even if they are not computer savvy. People tell us our business model diagrams 3d men giving gift to other events PowerPoint Slides effectively help you save your valuable time. You can be sure our character PowerPoint templates and PPT Slides help you meet deadlines which are an element of today's workplace. Just browse and pick the slides that appeal to your intuitive senses.

Life Cycle Driven Business Models To Increase Environment Friendly Impact Diagrams PDF
This slide signifies life cycle driven of a business to increase sustainability impact in the market. It include product design, distribution, marketing ,sales and end of life. Showcasing this set of slides titled Life Cycle Driven Business Models To Increase Environment Friendly Impact Diagrams PDF. The topics addressed in these templates are Production, Marketing, Sustainable Supply Chain. All the content presented in this PPT design is completely editable. Download it and make adjustments in color, background, font etc. as per your unique business setting.
Services Marketing Sales What Business Challenges Are Faced By Prospect Ppt Icon Diagrams PDF
This slide caters details about key business challenges are faced by prospects in context to services such as high IT cost, poor business agility, regulatory compliances, etc. This is a services marketing sales what business challenges are faced by prospect ppt icon diagrams pdf template with various stages. Focus and dispense information on five stages using this creative set, that comes with editable features. It contains large content boxes to add your information on topics like humongous it cost, infrastructure silos, security threats, regulatory compliances, poor business agility. You can also showcase facts, figures, and other relevant content using this PPT layout. Grab it now.

Deployment Of Process Automation To Increase Organisational Performance Monthly Timeline For Implementation Diagrams PDF
This slide presents the action plan of sequential events and activities to execute workflow automation in period of time. It includes activates such as planning , gap analysis, training session, identify approach, meetings, implementation, monitoring and tracking etc. Coming up with a presentation necessitates that the majority of the effort goes into the content and the message you intend to convey. The visuals of a PowerPoint presentation can only be effective if it supplements and supports the story that is being told. Keeping this in mind our experts created Deployment Of Process Automation To Increase Organisational Performance Monthly Timeline For Implementation Diagrams PDF to reduce the time that goes into designing the presentation. This way, you can concentrate on the message while our designers take care of providing you with the right template for the situation.

Cyberspace Simulation Platform Fundraising Elevator Providing An Insight Into Our Team Name Diagrams PDF
Purpose of the following slide is to show the team management of the organization as it displays the details of the team members such as name, designation image etc. This is a cyberspace simulation platform fundraising elevator providing an insight into our team name diagrams pdf template with various stages. Focus and dispense information on three stages using this creative set, that comes with editable features. It contains large content boxes to add your information on topics like providing an insight into our team. You can also showcase facts, figures, and other relevant content using this PPT layout. Grab it now.

Employer Branding Playbook One Color Use Guideline For Company Logo Brand Playbook Diagrams PDF
This template covers the company logos colour usage guidelines of different colour backgrounds and pictures. It also depicts that company should utilize the full-color logo while using an aubergine backdrop. This is a Employer Branding Playbook One Color Use Guideline For Company Logo Brand Playbook Diagrams PDF template with various stages. Focus and dispense information on three stages using this creative set, that comes with editable features. It contains large content boxes to add your information on topics like ABC Color Palette, Design Constraints Restrict, Aubergine Backdrop. You can also showcase facts, figures, and other relevant content using this PPT layout. Grab it now.
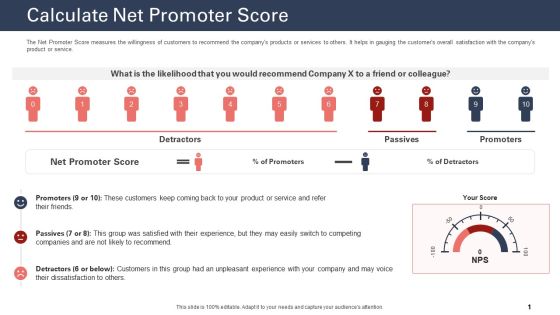
Techniques To Increase Customer Satisfaction Calculate Net Promoter Score Diagrams PDF
The Net Promoter Score measures the willingness of customers to recommend the companys products or services to others. It helps in gauging the customers overall satisfaction with the companys product or service. Deliver an awe inspiring pitch with this creative techniques to increase customer satisfaction calculate net promoter score diagrams pdf bundle. Topics like calculate net promoter score, product or service, net promoter score can be discussed with this completely editable template. It is available for immediate download depending on the needs and requirements of the user.

Total Numbers Of Visitor In The Zoo After Implementing Strategies Ppt Summary Diagrams PDF
This slide shows the forecasted total number of visitors in the ABC Zoo from the years 2020 to 2024. It shows the increase in the total visitors due to the successful implementation of the strategies.Deliver an awe-inspiring pitch with this creative total numbers of visitor in the zoo after implementing strategies ppt summary diagrams pdf. bundle. Topics like total number of visitors, 2020 to 2024 can be discussed with this completely editable template. It is available for immediate download depending on the needs and requirements of the user.

Customer Relationship Strategy For Building Loyalty Identifying Customer Touch Points Diagrams PDF
This slide aims to identify key customer touch points to be optimized in order to gain leverage on company service delivery message. It alos covers key insights related to preferred customer touch points. Deliver an awe inspiring pitch with this creative customer relationship strategy for building loyalty identifying customer touch points diagrams pdf bundle. Topics like retailer website, internet search, brand website, social media can be discussed with this completely editable template. It is available for immediate download depending on the needs and requirements of the user.

Examination Of Buyer Mindset Towards Dairy Products Total Sales Of Dairy Products Worldwide Diagrams PDF
This slide shows total worldwide sales of dairy products, from the years 2018 to 2022. It shows the increase in sales of all dairy products Milk, Cheese, Yogurt, Flavored milk drinks, Other dairy products. Deliver and pitch your topic in the best possible manner with this examination of buyer mindset towards dairy products total sales of dairy products worldwide diagrams pdf. Use them to share invaluable insights on total sales of dairy products worldwide and impress your audience. This template can be altered and modified as per your expectations. So, grab it now.

Financing Catalogue For Security Underwriting Agreement IPO Deals Count In Different Sectors Diagrams PDF
The slide provides the graph of number of IPO deals by sector which the company has handled in last five years. It also covers key facts CAGR growth, raised amount etc. related to IPO deals of the company. Deliver an awe inspiring pitch with this creative financing catalogue for security underwriting agreement ipo deals count in different sectors diagrams pdf bundle. Topics like manufacturing, financial services, automobile, food and beverages can be discussed with this completely editable template. It is available for immediate download depending on the needs and requirements of the user.
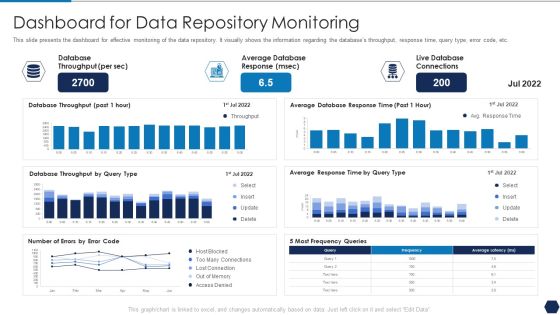
Tactical Plan For Upgrading DBMS Dashboard For Data Repository Monitoring Diagrams PDF
This slide presents the dashboard for effective monitoring of the data repository. It visually shows the information regarding the databases throughput, response time, query type, error code, etc. Deliver and pitch your topic in the best possible manner with this tactical plan for upgrading dbms dashboard for data repository monitoring diagrams pdf. Use them to share invaluable insights on database throughput, average database response, live database connections and impress your audience. This template can be altered and modified as per your expectations. So, grab it now.
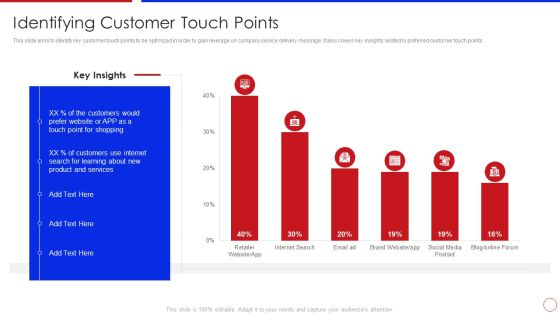
Strategy To Enhance Buyer Intimacy Identifying Customer Touch Points Ppt Infographics Diagrams PDF
This slide aims to identify key customer touch points to be optimized in order to gain leverage on company service delivery message. It alos covers key insights related to preferred customer touch points. Deliver and pitch your topic in the best possible manner with this strategy to enhance buyer intimacy identifying customer touch points ppt infographics diagrams pdf. Use them to share invaluable insights on identifying customer touch points and impress your audience. This template can be altered and modified as per your expectations. So, grab it now.

Enhancing Stp Strategies For A Successful Market Promotion Kpi Dashboard To Monitor Diagrams PDF
Mentioned slide shows the KPI dashboard that can be used to track win and lost sales opportunities. It includes metrics namely won opportunities, lost opportunities, pipeline by territory, total opportunities. Deliver and pitch your topic in the best possible manner with this enhancing stp strategies for a successful market promotion kpi dashboard to monitor diagrams pdf. Use them to share invaluable insights on kpi dashboard to monitor sales opportunities and impress your audience. This template can be altered and modified as per your expectations. So, grab it now.

Facebook Original Capital Funding User Base Demographics Students And Faculty Diagrams PDF
The purpose of the following slide is to highlight the user base demographics of the Facebook site. It includes information regarding the segregation of site users based on students, alumni, and faculty staff. Deliver an awe inspiring pitch with this creative facebook original capital funding user base demographics students and faculty diagrams pdf bundle. Topics like user base demographics students and faculty can be discussed with this completely editable template. It is available for immediate download depending on the needs and requirements of the user.

Customer Rapport Strategy To Build Loyal Client Base Customer Service Dashboard Diagrams PDF
This slide majorly aims to provide insights about the impact of customer intimacy strategy on customer service quality. It shows complaint ticket status, customer happiness ratings, and average traffic analysis etc. Deliver and pitch your topic in the best possible manner with this customer rapport strategy to build loyal client base customer service dashboard diagrams pdf. Use them to share invaluable insights on customer service dashboard and impress your audience. This template can be altered and modified as per your expectations. So, grab it now.

Analyzing The Impact Of Russia Ukraine Conflict On Gas Sector Russian Invasion Impact Diagrams PDF
The following slide represents impact of Russian Ukrainian gas war tensions on USA. It provides information about gasoline prices, gas production, demands, sanctions, ban, etc. Deliver and pitch your topic in the best possible manner with this analyzing the impact of russia ukraine conflict on gas sector russian invasion impact diagrams pdf. Use them to share invaluable insights on russian invasion impact on united states of america and impress your audience. This template can be altered and modified as per your expectations. So, grab it now.
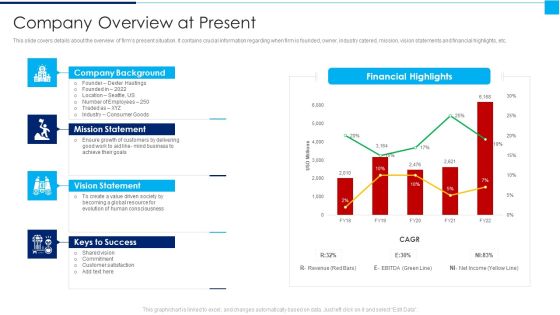
Ways To Enhance Organizations Profitability Company Overview At Present Diagrams PDF
This slide covers details about the overview of firms present situation. It contains crucial information regarding when firm is founded, owner, industry catered, mission, vision statements and financial highlights, etc. Deliver and pitch your topic in the best possible manner with this ways to enhance organizations profitability company overview at present diagrams pdf Use them to share invaluable insights on mission statement, vision statement, keys to success and impress your audience. This template can be altered and modified as per your expectations. So, grab it now.
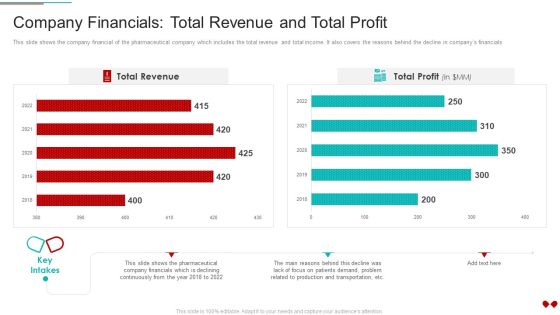
Environmental Impact Analysis For A Pharmaceutical Company Financials Total Revenue And Total Profit Diagrams PDF
This slide shows the company financial of the pharmaceutical company which includes the total revenue and total income. It also covers the reasons behind the decline in companys financialsDeliver an awe inspiring pitch with this creative Environmental Impact Analysis For A Pharmaceutical Company Financials Total Revenue And Total Profit Diagrams PDF bundle. Topics like Company Financials Total Revenue And Total Profit can be discussed with this completely editable template. It is available for immediate download depending on the needs and requirements of the user.
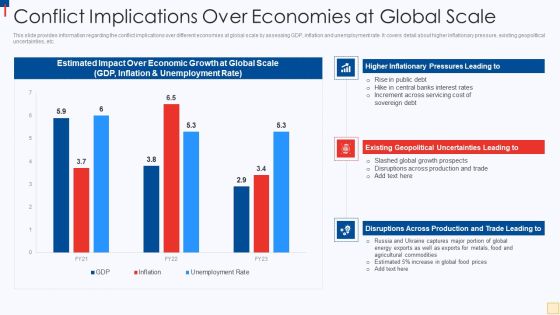
Ukraine Vs Russia Examining Conflict Implications Over Economies At Global Scale Diagrams PDF
This slide provides information regarding the conflict implications over different economies at global scale by assessing GDP, inflation and unemployment rate. It covers detail about higher inflationary pressure, existing geopolitical uncertainties, etc. Deliver and pitch your topic in the best possible manner with this Ukraine Vs Russia Examining Conflict Implications Over Economies At Global Scale Diagrams PDF. Use them to share invaluable insights on Estimated Impact Over, Economic Growth, Global Scale, GDP, Inflation And Unemployment Rate and impress your audience. This template can be altered and modified as per your expectations. So, grab it now.
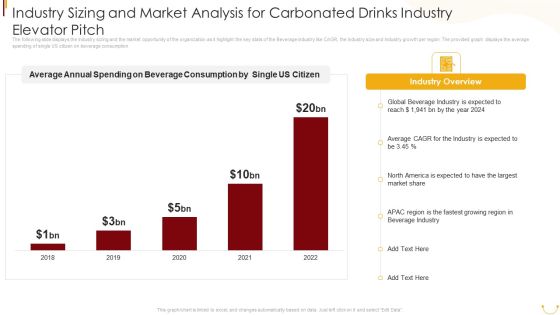
Industry Sizing And Market Analysis For Carbonated Drinks Industry Elevator Pitch Diagrams PDF
The following slide displays the Industry sizing and the market opportunity of the organization as it highlight the key stats of the Beverage industry like CAGR, the Industry size and Industry growth per region. The provided graph displays the average spending of single US citizen on beverage consumption. Deliver and pitch your topic in the best possible manner with this Industry Sizing And Market Analysis For Carbonated Drinks Industry Elevator Pitch Diagrams PDF. Use them to share invaluable insights on Average Annual Spending, Beverage Consumption, Single US Citizen, Global Beverage Industry, 2018 To 2022 and impress your audience. This template can be altered and modified as per your expectations. So, grab it now.

Insurance Company Business Plan Addressing Market Assessment For Insurance Business Diagrams PDF
This slide covers information regarding market assessment of insurance business with high competition existing. It covers details about key players and market share associated to top players. Deliver and pitch your topic in the best possible manner with this Insurance Company Business Plan Addressing Market Assessment For Insurance Business Diagrams PDF Use them to share invaluable insights on America Insurance, General Insurance, Local Competition Includes and impress your audience. This template can be altered and modified as per your expectations. So, grab it now.

How To Implement Cloud Collaboration Impact Of Cloud Computing Post Implementation Diagrams PDF
The mentioned slide illustrates effect on project management after implementing cloud computing. It provides information about on time completion rate, schedule performance index SPI, cost performance index CPI, resource utilization, etc. Deliver an awe inspiring pitch with this creative How To Implement Cloud Collaboration Impact Of Cloud Computing Post Implementation Diagrams PDF bundle. Topics like Overdue Tasks, Resource Utilization, CPI And SPI can be discussed with this completely editable template. It is available for immediate download depending on the needs and requirements of the user.

Digital Marketing Agency Business Profile Revenue And Net Profit Diagrams PDF
This slide highlights the revenue and net profit of digital marketing agency through bar graph and tabular format. It covers three years data of revenue, gross margin and net profit. Deliver and pitch your topic in the best possible manner with this Digital Marketing Agency Business Profile Revenue And Net Profit Diagrams PDF. Use them to share invaluable insights on Increase In Revenue, Growth Rate, Net Profit and impress your audience. This template can be altered and modified as per your expectations. So, grab it now.

Strategic Brand Management Brand Asset Valuator Power Grid To Assess Overall Health Diagrams PDF
This slide provides information regarding brand asset valuator power grid to analyze overall brand health. It caters details about new, unfocused, eroding, power, declining or niche brands. Deliver and pitch your topic in the best possible manner with this Strategic Brand Management Brand Asset Valuator Power Grid To Assess Overall Health Diagrams PDF. Use them to share invaluable insights on Brand Vitality, Brand Stature, Declining Brands, Eroding Brands and impress your audience. This template can be altered and modified as per your expectations. So, grab it now.
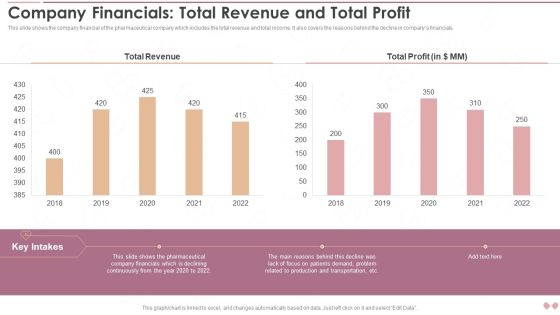
Innovative Business Model Of Pharmaceutical Company Financials Total Revenue And Total Profit Diagrams PDF
This slide shows the key impacts of the strategies on companys operations. It includes operational and environmental impacts such as accurate demand forecasting, reward research and development etc.Deliver and pitch your topic in the best possible manner with this Innovative Business Model Of Pharmaceutical Company Financials Total Revenue And Total Profit Diagrams PDF. Use them to share invaluable insights on Total Revenue, Total Profit, Related Production and impress your audience. This template can be altered and modified as per your expectations. So, grab it now.
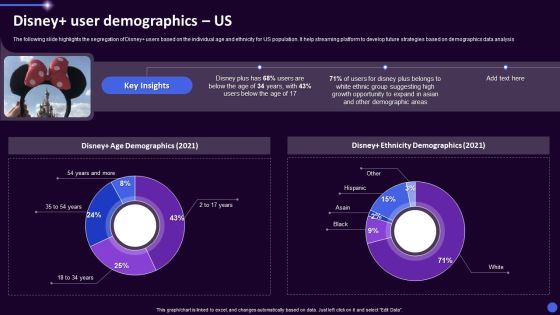
Disney Plus OTT Platform Company Summary Disney User Demographics Us Ppt Gallery Diagrams PDF
The following slide highlights the segregation of Disney users based on the individual age and ethnicity for US population. It help streaming platform to develop future strategies based on demographics data analysis. Deliver an awe inspiring pitch with this creative Disney Plus OTT Platform Company Summary Disney User Demographics Us Ppt Gallery Diagrams PDF bundle. Topics like Disney Ethnicity Demographics, Disney Age Demographics, 2021 can be discussed with this completely editable template. It is available for immediate download depending on the needs and requirements of the user.

SAC Planning And Implementation Major Users Of SAP Analytics Cloud Suite Diagrams PDF
The following slide illustrates the major user of SAP Analytics Cloud suite which are business users and business intelligence seekers. It also contains details regarding the usage statistics of both the users. Deliver an awe inspiring pitch with this creative SAC Planning And Implementation Major Users Of SAP Analytics Cloud Suite Diagrams PDF bundle. Topics like Executives, Casuals, Business Intelligence Seekers, Data Scientist can be discussed with this completely editable template. It is available for immediate download depending on the needs and requirements of the user.
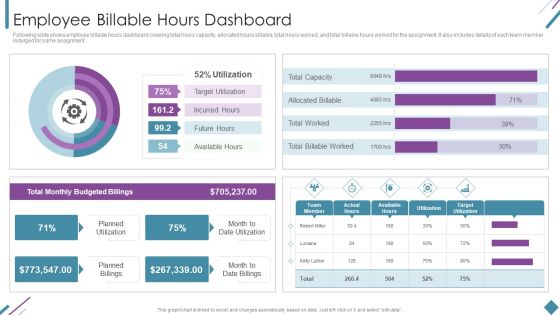
Metrics To Measure Business Performance Employee Billable Hours Dashboard Diagrams PDF
Following slide shows employee billable hours dashboard covering total hours capacity, allocated hours billable, total hours worked, and total billable hours worked for the assignment. It also includes details of each team member indulged for same assignment. Deliver an awe inspiring pitch with this creative Metrics To Measure Business Performance Employee Billable Hours Dashboard Diagrams PDF bundle. Topics like Total Monthly, Budgeted Billings, Planned Utilization can be discussed with this completely editable template. It is available for immediate download depending on the needs and requirements of the user.
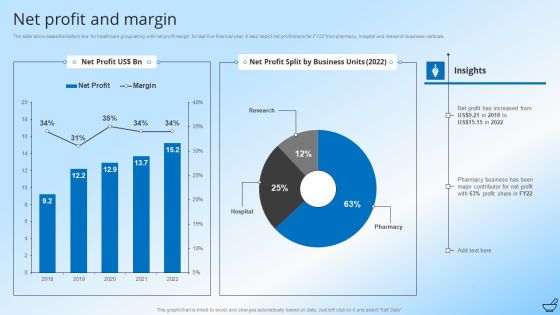
Pharmaceutical And Clinical Research Summary Net Profit And Margin Diagrams PDF
The slide showcases the bottom line for healthcare group along with net profit margin for last five financial year. It also depict net profit share for FY22 from pharmacy, hospital and research business verticals. Deliver an awe inspiring pitch with this creative Pharmaceutical And Clinical Research Summary Net Profit And Margin Diagrams PDF bundle. Topics like Pharmacy Business, Profit Share, Business Units can be discussed with this completely editable template. It is available for immediate download depending on the needs and requirements of the user.

Overview Of Holistic Marketing For Creating Positive Brand Image Ppt PowerPoint Presentation File Diagrams PDF
This slide provides glimpse about summary of holistic marketing that can help a business to increase brand awareness and value. It includes features such as common goal, aligned activities, integrated activities, etc. Slidegeeks has constructed Overview Of Holistic Marketing For Creating Positive Brand Image Ppt PowerPoint Presentation File Diagrams PDF after conducting extensive research and examination. These presentation templates are constantly being generated and modified based on user preferences and critiques from editors. Here, you will find the most attractive templates for a range of purposes while taking into account ratings and remarks from users regarding the content. This is an excellent jumping off point to explore our content and will give new users an insight into our top notch PowerPoint Templates.

Use Generative Adversarial Networks Gan For Detecting AI Generated Image Diagrams PDF
This slide represents best practices to identify image prepared by AI tool used to generated realistic images from texts. It includes details related to best practice of using GAN for detecting AI generated image. Slidegeeks has constructed Use Generative Adversarial Networks Gan For Detecting AI Generated Image Diagrams PDF after conducting extensive research and examination. These presentation templates are constantly being generated and modified based on user preferences and critiques from editors. Here, you will find the most attractive templates for a range of purposes while taking into account ratings and remarks from users regarding the content. This is an excellent jumping off point to explore our content and will give new users an insight into our top notch PowerPoint Templates.

Stakeholder Mapping Matrix With Level Of Importance Ppt File Diagrams PDF
This slide shows the stakeholder mapping matrix with level of importance which includes high importance, low importance, high influence, low influence, etc. This is a stakeholder mapping matrix with level of importance ppt file diagrams pdf. template with various stages. Focus and dispense information on four stages using this creative set, that comes with editable features. It contains large content boxes to add your information on topics like high importance low influence, high importance high influence, low importance low influence, low importance high influence. You can also showcase facts, figures, and other relevant content using this PPT layout. Grab it now.
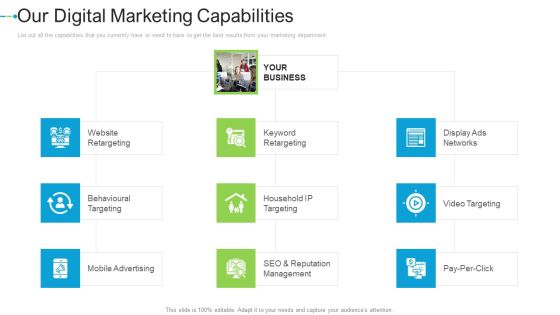
Our Digital Marketing Capabilities Internet Marketing Strategies To Grow Your Business Diagrams PDF
List out all the capabilities that you currently have or need to have to get the best results from your marketing department. This is a our digital marketing capabilities internet marketing strategies to grow your business diagrams pdf template with various stages. Focus and dispense information on three stages using this creative set, that comes with editable features. It contains large content boxes to add your information on topics like website retargeting, behavioural targeting, mobile advertising, keyword retargeting, video targeting. You can also showcase facts, figures, and other relevant content using this PPT layout. Grab it now.
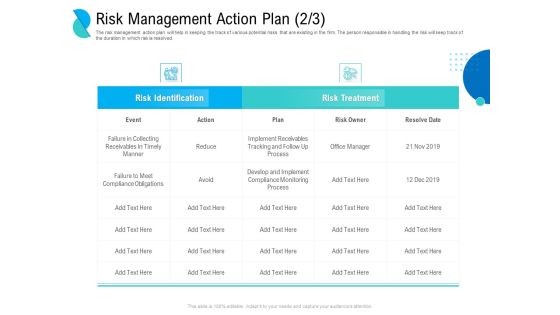
Determining Crisis Management BCP Risk Management Action Plan Event Ppt PowerPoint Presentation Portfolio Diagrams PDF
The risk management action plan will help in keeping the track of various potential risks that are existing in the firm. The person responsible in handling the risk will keep track of the duration in which risk is resolved. Deliver and pitch your topic in the best possible manner with thisdetermining crisis management bcp risk management action plan event ppt powerpoint presentation portfolio diagrams pdf. Use them to share invaluable insights onevent, reduce, failure in collecting receivables in timely manner, failure to meet compliance obligations, develop and implement compliance monitoring process. and impress your audience. This template can be altered and modified as per your expectations. So, grab it now.
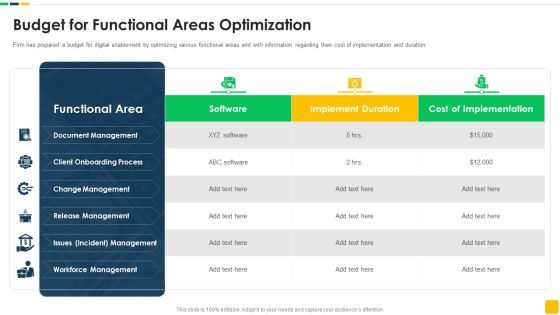
Strawman Proposal For Enterprise Critical Thinking Budget For Functional Areas Optimization Diagrams PDF
Firm has prepared a budget for digital enablement by optimizing various functional areas and with information regarding their cost of implementation and duration. Deliver and pitch your topic in the best possible manner with this strawman proposal for enterprise critical thinking budget for functional areas optimization diagrams pdf. Use them to share invaluable insights on document management, client onboarding process, change management, release management, workforce management and impress your audience. This template can be altered and modified as per your expectations. So, grab it now.

Project Time Management To Enhance Productivity Parameters To Measure Timeliness Of Project Activities Diagrams PDF
This slide shows the parameters to measure timeliness of project activities which includes cycle time, time spent, on-time completion percentage, number of adjustments, planned hours vs. actual time spent, etc.Deliver an awe inspiring pitch with this creative Project Time Management To Enhance Productivity Parameters To Measure Timeliness Of Project Activities Diagrams PDF bundle. Topics like Development Process, Completion Percentage, Completion Allocated can be discussed with this completely editable template. It is available for immediate download depending on the needs and requirements of the user.
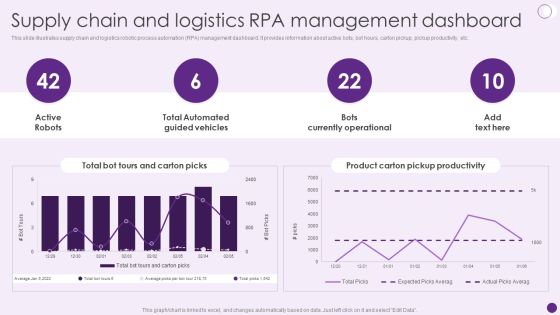
Supply Chain And Logistics Rpa Management Dashboard Deploying Automation To Enhance Diagrams PDF
This slide illustrates supply chain and logistics robotic process automation RPA management dashboard. It provides information about active bots, bot hours, carton pickup, pickup productivity, etc. Boost your pitch with our creative Supply Chain And Logistics Rpa Management Dashboard Deploying Automation To Enhance Diagrams PDF. Deliver an awe-inspiring pitch that will mesmerize everyone. Using these presentation templates you will surely catch everyones attention. You can browse the ppts collection on our website. We have researchers who are experts at creating the right content for the templates. So you do not have to invest time in any additional work. Just grab the template now and use them.

Guide To Business Customer Acquisition Steps For Developing Effective Customer Acquisition Plan Diagrams PDF
This slide covers the process of getting potential customers to buy the companys products. It includes steps such as identifying target customers, determining business goals, choosing right marketing platform, setting a budget, analyzing and optimizing. There are so many reasons you need a Guide To Business Customer Acquisition Steps For Developing Effective Customer Acquisition Plan Diagrams PDF. The first reason is you can not spend time making everything from scratch, Thus, Slidegeeks has made presentation templates for you too. You can easily download these templates from our website easily.

Organizing Security Awareness Pricing Plan Of Security Awareness Packages Diagrams PDF
The purpose of this slide is to showcase the pricing plan of cyber security awareness package. It covers information about the total number of employees along with different packages such as silver, gold, platinum and diamond. Take your projects to the next level with our ultimate collection of Organizing Security Awareness Pricing Plan Of Security Awareness Packages Diagrams PDF. Slidegeeks has designed a range of layouts that are perfect for representing task or activity duration, keeping track of all your deadlines at a glance. Tailor these designs to your exact needs and give them a truly corporate look with your own brand colors theyll make your projects stand out from the rest.
 Home
Home