AI PPT Maker
Templates
PPT Bundles
Design Services
Business PPTs
Business Plan
Management
Strategy
Introduction PPT
Roadmap
Self Introduction
Timelines
Process
Marketing
Agenda
Technology
Medical
Startup Business Plan
Cyber Security
Dashboards
SWOT
Proposals
Education
Pitch Deck
Digital Marketing
KPIs
Project Management
Product Management
Artificial Intelligence
Target Market
Communication
Supply Chain
Google Slides
Research Services
 One Pagers
All Categories
-
Home
- Customer Favorites
- System Architecture Diagram
System Architecture Diagram
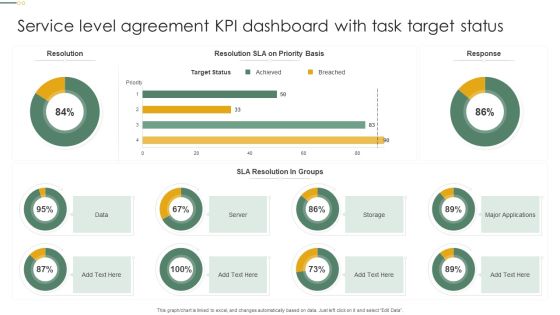
Service Level Agreement KPI Dashboard With Task Target Status Microsoft PDF
This graph or chart is linked to excel, and changes automatically based on data. Just left click on it and select Edit Data. Pitch your topic with ease and precision using this Service Level Agreement KPI Dashboard With Task Target Status Microsoft PDF. This layout presents information on Target Status, Sla Resolution, Groups, Server. It is also available for immediate download and adjustment. So, changes can be made in the color, design, graphics or any other component to create a unique layout.

Financial Problem Analysis And Mitigation Planning Portrait PDF
The following slide depicts some financial issues in business. It also includes a pie chart showing the percentage of issue occurring from each category. Showcasing this set of slides titled Financial Problem Analysis And Mitigation Planning Portrait PDF. The topics addressed in these templates are Raw Material Price, International Markets, Production Incapability. All the content presented in this PPT design is completely editable. Download it and make adjustments in color, background, font etc. as per your unique business setting.

Employee Hiring Action Plan For Outsourcing Candidates Template PDF
This slide signifies the pie chart on employee recruitment action plan by HR. It includes sources like employee referral, social media, direct applications, paid job boards, internal hires. Showcasing this set of slides titled Employee Hiring Action Plan For Outsourcing Candidates Template PDF. The topics addressed in these templates are Employee Hiring Action Plan, Outsourcing Candidates. All the content presented in this PPT design is completely editable. Download it and make adjustments in color, background, font etc. as per your unique business setting.
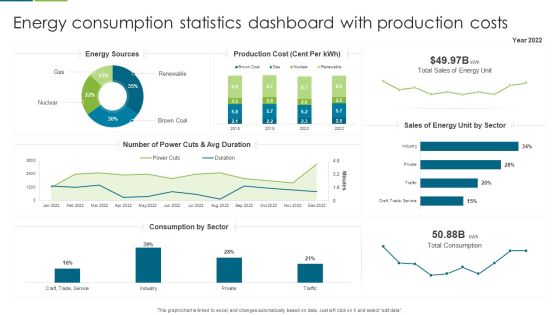
Energy Consumption Statistics Dashboard With Production Costs Slides PDF
This graph or chart is linked to excel, and changes automatically based on data. Just left click on it and select edit data. Showcasing this set of slides titled Energy Consumption Statistics Dashboard With Production Costs Slides PDF. The topics addressed in these templates are Production Cost, Sales Energy, Number Power. All the content presented in this PPT design is completely editable. Download it and make adjustments in color, background, font etc. as per your unique business setting.
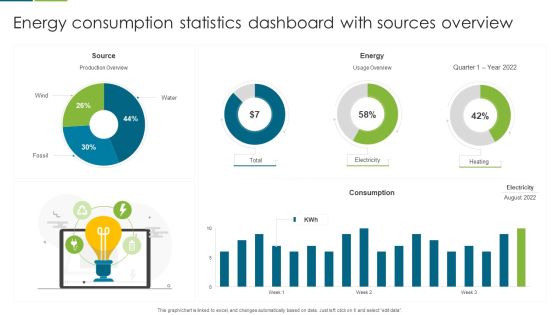
Energy Consumption Statistics Dashboard With Sources Overview Template PDF
This graph or chart is linked to excel, and changes automatically based on data. Just left click on it and select edit data. Pitch your topic with ease and precision using this Energy Consumption Statistics Dashboard With Sources Overview Template PDF. This layout presents information on Source, Energy, Consumption. It is also available for immediate download and adjustment. So, changes can be made in the color, design, graphics or any other component to create a unique layout.

Energy Consumption Statistics Dashboard With Yearly Savings Guidelines PDF
This graph or chart is linked to excel, and changes automatically based on data. Just left click on it and select edit data. Showcasing this set of slides titled Energy Consumption Statistics Dashboard With Yearly Savings Guidelines PDF. The topics addressed in these templates are Production Consumption, Energy Savings, Performance Ratio. All the content presented in this PPT design is completely editable. Download it and make adjustments in color, background, font etc. as per your unique business setting.

5 Year Gender Based Group Demographics Of Organization Background PDF
This graph or chart is linked to excel, and changes automatically based on data. Just left click on it and select Edit Data. Showcasing this set of slides titled 5 Year Gender Based Group Demographics Of Organization Background PDF. The topics addressed in these templates are Total Employees, Male, Female. All the content presented in this PPT design is completely editable. Download it and make adjustments in color, background, font etc. as per your unique business setting.

Business Hiring Group Diversity Demographics Dashboard Guidelines PDF
This graph or chart is linked to excel, and changes automatically based on data. Just left click on it and select Edit Data. Showcasing this set of slides titled Business Hiring Group Diversity Demographics Dashboard Guidelines PDF. The topics addressed in these templates are Hiring Trends, Current Period, Previous Period. All the content presented in this PPT design is completely editable. Download it and make adjustments in color, background, font etc. as per your unique business setting.

Company Group Members Demographics Dashboard Overview Clipart PDF
This graph or chart is linked to excel, and changes automatically based on data. Just left click on it and select Edit Data. Pitch your topic with ease and precision using this Company Group Members Demographics Dashboard Overview Clipart PDF. This layout presents information on Headcount Office, Headcount Tenure Range, Headcount Age Range. It is also available for immediate download and adjustment. So, changes can be made in the color, design, graphics or any other component to create a unique layout.

Group Diversity Demographics Based On Salary Range Portrait PDF
This graph or chart is linked to excel, and changes automatically based on data. Just left click on it and select Edit Data. Showcasing this set of slides titled Group Diversity Demographics Based On Salary Range Portrait PDF. The topics addressed in these templates are Salary Breakdown Team, Number Employees, Per Team. All the content presented in this PPT design is completely editable. Download it and make adjustments in color, background, font etc. as per your unique business setting.

Multiple Organizational Group Demographics Based On Gender Download PDF
This graph or chart is linked to excel, and changes automatically based on data. Just left click on it and select Edit Data. Showcasing this set of slides titled Multiple Organizational Group Demographics Based On Gender Download PDF. The topics addressed in these templates are Total Employees, Team, Female. All the content presented in this PPT design is completely editable. Download it and make adjustments in color, background, font etc. as per your unique business setting.

Helpdesk SLA KPL Dashboard Illustrating Calls Details Ppt Slides Show PDF
This graph or chart is linked to excel, and changes automatically based on data. Just left click on it and select Edit Data. Showcasing this set of slides titled Helpdesk SLA KPL Dashboard Illustrating Calls Details Ppt Slides Show PDF. The topics addressed in these templates are Call Type Today, Trunk Utilization Today, Call Summery Today. All the content presented in this PPT design is completely editable. Download it and make adjustments in color, background, font etc. as per your unique business setting.

Service SLA KPL Changes And Incidents Dashboard Ppt Inspiration Infographics PDF
This graph or chart is linked to excel, and changes automatically based on data. Just left click on it and select Edit Data. Pitch your topic with ease and precision using this Service SLA KPL Changes And Incidents Dashboard Ppt Inspiration Infographics PDF. This layout presents information on Time Spent Department, Incidents Closed, Operator Group. It is also available for immediate download and adjustment. So, changes can be made in the color, design, graphics or any other component to create a unique layout.

SLA KPL Dashboard Indicating Compliance Priority With KPI Ppt File Format PDF
This graph or chart is linked to excel, and changes automatically based on data. Just left click on it and select Edit Data. Showcasing this set of slides titled SLA KPL Dashboard Indicating Compliance Priority With KPI Ppt File Format PDF. The topics addressed in these templates are KPI Graph, Insights Here, SLA Compliance Priority. All the content presented in this PPT design is completely editable. Download it and make adjustments in color, background, font etc. as per your unique business setting.
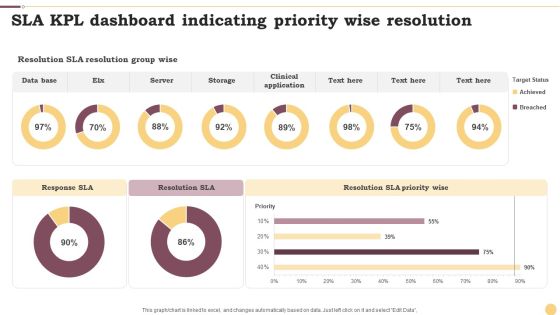
SLA KPL Dashboard Indicating Priority Wise Resolution Ppt Infographics Example File PDF
This graph or chart is linked to excel, and changes automatically based on data. Just left click on it and select Edit Data. Pitch your topic with ease and precision using this SLA KPL Dashboard Indicating Priority Wise Resolution Ppt Infographics Example File PDF. This layout presents information on Data Base, Server, Storage. It is also available for immediate download and adjustment. So, changes can be made in the color, design, graphics or any other component to create a unique layout.

SLA KPL Dashboard Indicating Top Week Performers Ppt Infographics Examples PDF
This graph or chart is linked to excel, and changes automatically based on data. Just left click on it and select Edit Data. Showcasing this set of slides titled SLA KPL Dashboard Indicating Top Week Performers Ppt Infographics Examples PDF. The topics addressed in these templates are Active Slas Risk, Active Slas Breached, Active Slas. All the content presented in this PPT design is completely editable. Download it and make adjustments in color, background, font etc. as per your unique business setting.

SLA KPL Overview Dashboard Depicting Service Targets Ppt Slides Maker PDF
This graph or chart is linked to excel, and changes automatically based on data. Just left click on it and select Edit Data. Pitch your topic with ease and precision using this SLA KPL Overview Dashboard Depicting Service Targets Ppt Slides Maker PDF. This layout presents information on Monthly Trend, Service Target, Quarterly Trend. It is also available for immediate download and adjustment. So, changes can be made in the color, design, graphics or any other component to create a unique layout.

Doughnut Graph Depicting ROI From Multiple Marketing Activities Rules PDF
This graph or chart is linked to excel, and changes automatically based on data. Just left click on it and select Edit Data. Pitch your topic with ease and precision using this Doughnut Graph Depicting ROI From Multiple Marketing Activities Rules PDF. This layout presents information on Total ROI, Field Campaigns, Print Media, Display Ads. It is also available for immediate download and adjustment. So, changes can be made in the color, design, graphics or any other component to create a unique layout.
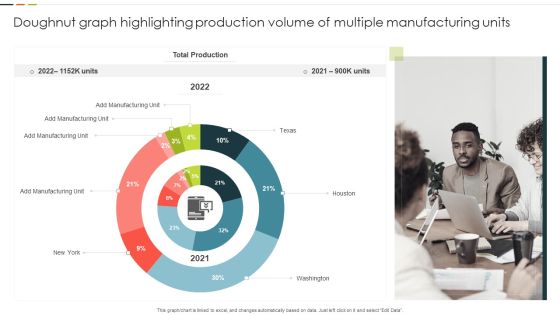
Doughnut Graph Highlighting Production Volume Of Multiple Manufacturing Units Guidelines PDF
This graph or chart is linked to excel, and changes automatically based on data. Just left click on it and select Edit Data. Showcasing this set of slides titled Doughnut Graph Highlighting Production Volume Of Multiple Manufacturing Units Guidelines PDF. The topics addressed in these templates are Total Production, Manufacturing Unit, Washington. All the content presented in this PPT design is completely editable. Download it and make adjustments in color, background, font etc. as per your unique business setting.

Doughnut Graph With Online Employee Recruitment Via Multiple Portals Mockup PDF
This graph or chart is linked to excel, and changes automatically based on data. Just left click on it and select Edit Data. Pitch your topic with ease and precision using this Doughnut Graph With Online Employee Recruitment Via Multiple Portals Mockup PDF. This layout presents information on ABC Employment, Multiple Portals, 2020 To 2022. It is also available for immediate download and adjustment. So, changes can be made in the color, design, graphics or any other component to create a unique layout.
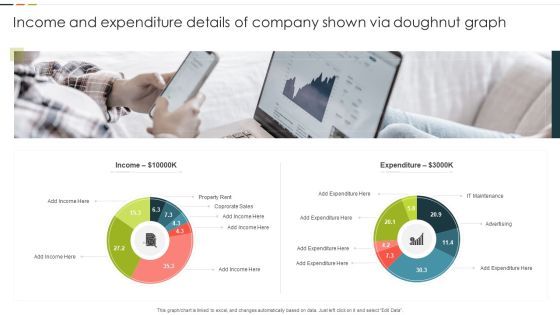
Income And Expenditure Details Of Company Shown Via Doughnut Graph Graphics PDF
This graph or chart is linked to excel, and changes automatically based on data. Just left click on it and select Edit Data. Pitch your topic with ease and precision using this Income And Expenditure Details Of Company Shown Via Doughnut Graph Graphics PDF. This layout presents information on Property Rent, Corporate Sales, Expenditure. It is also available for immediate download and adjustment. So, changes can be made in the color, design, graphics or any other component to create a unique layout.

Kanban Structure For Task Management Ppt Summary Information PDF
This graph or chart is linked to excel, and changes automatically based on data. Just left click on it and select Edit Data. Showcasing this set of slides titled Kanban Structure For Task Management Ppt Summary Information PDF. The topics addressed in these templates are Backlog, In Progress, New Epic Added. All the content presented in this PPT design is completely editable. Download it and make adjustments in color, background, font etc. as per your unique business setting.
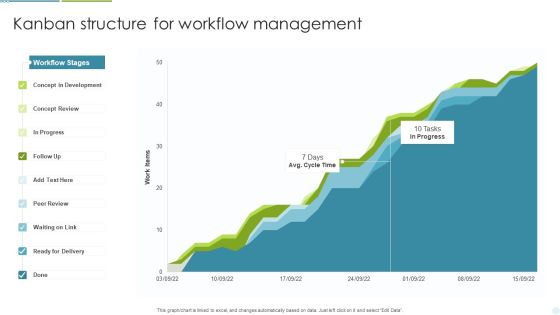
Kanban Structure For Workflow Management Ppt Inspiration Template PDF
This graph or chart is linked to excel, and changes automatically based on data. Just left click on it and select Edit Data. Pitch your topic with ease and precision using this Kanban Structure For Workflow Management Ppt Inspiration Template PDF. This layout presents information on Concept Development, Concept Review, Ready For Delivery. It is also available for immediate download and adjustment. So, changes can be made in the color, design, graphics or any other component to create a unique layout.
Kanban Structure For Yearly Project Progress Tracking Ppt File Example Introduction PDF
This graph or chart is linked to excel, and changes automatically based on data. Just left click on it and select Edit Data. Showcasing this set of slides titled Kanban Structure For Yearly Project Progress Tracking Ppt File Example Introduction PDF. The topics addressed in these templates are Number Projects, Backlog Approved, Final Review. All the content presented in this PPT design is completely editable. Download it and make adjustments in color, background, font etc. as per your unique business setting.

Kanban Structure To Manage Weekly Work Activities Ppt Professional Aids PDF
This graph or chart is linked to excel, and changes automatically based on data. Just left click on it and select Edit Data. Pitch your topic with ease and precision using this Kanban Structure To Manage Weekly Work Activities Ppt Professional Aids PDF. This layout presents information on Legend, Ready To Start, In Progress. It is also available for immediate download and adjustment. So, changes can be made in the color, design, graphics or any other component to create a unique layout.

Human Capital Metrics For New Hire Ppt Pictures Brochure PDF
This graph or chart is linked to excel, and changes automatically based on data. Just left click on it and select Edit Data. Pitch your topic with ease and precision using this Human Capital Metrics For New Hire Ppt Pictures Brochure PDF. This layout presents information on Active Employee Count, New Hire Count, New Hire. It is also available for immediate download and adjustment. So, changes can be made in the color, design, graphics or any other component to create a unique layout.

Human Capital Metrics For Proper Management Ppt Show Inspiration PDF
This graph or chart is linked to excel, and changes automatically based on data. Just left click on it and select Edit Data. Showcasing this set of slides titled Human Capital Metrics For Proper Management Ppt Show Inspiration PDF. The topics addressed in these templates are Candidates Per Position, Hired Per Source, Location. All the content presented in this PPT design is completely editable. Download it and make adjustments in color, background, font etc. as per your unique business setting.

Human Capital Metrics With Absenteeism Rate Ppt Infographic Template Ideas PDF
This graph or chart is linked to excel, and changes automatically based on data. Just left click on it and select Edit Data. Pitch your topic with ease and precision using this Human Capital Metrics With Absenteeism Rate Ppt Infographic Template Ideas PDF. This layout presents information on Overall Labor Effectiveness, OLE Department, Absenteeism. It is also available for immediate download and adjustment. So, changes can be made in the color, design, graphics or any other component to create a unique layout.
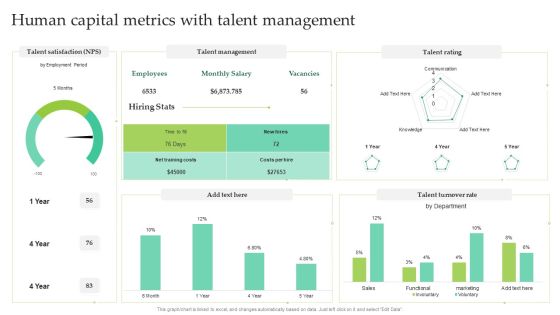
Human Capital Metrics With Talent Management Ppt Layouts Mockup PDF
This graph or chart is linked to excel, and changes automatically based on data. Just left click on it and select Edit Data. Showcasing this set of slides titled Human Capital Metrics With Talent Management Ppt Layouts Mockup PDF. The topics addressed in these templates are Talent Management, Talent Rating, Talent Turnover Rate. All the content presented in this PPT design is completely editable. Download it and make adjustments in color, background, font etc. as per your unique business setting.

Sales Funnel And Leads Performance Monitoring Sheet Ppt Professional Tips PDF
This slide illustrates leads tracking and sales funnel sheet. It provides details such as company, name, status, next action, price, taxes, discounts, total, etc. Showcasing this set of slides titled Sales Funnel And Leads Performance Monitoring Sheet Ppt Professional Tips PDF. The topics addressed in these templates are Sales Funnel Chart, Salesperson, Next Action. All the content presented in this PPT design is completely editable. Download it and make adjustments in color, background, font etc. as per your unique business setting.

Carbon Emission Rate Percentage Stacked Bar Graph Rules PDF
This slide shows emission rate percentage chart comparison of continents to determine lowest emission releasing continents. It includes continents and emission percentage Showcasing this set of slides titled Carbon Emission Rate Percentage Stacked Bar Graph Rules PDF. The topics addressed in these templates are Carbon Emission, Increase In Industrialization, New Manufacturing. All the content presented in this PPT design is completely editable. Download it and make adjustments in color, background, font etc. as per your unique business setting.

Carbon Emissions Of Countries Bar Graph Professional PDF
This slide depicts emissions chart of various countries to avoid the worst impacts of climate change. It includes countries and carbon emissions in million metric tons. Pitch your topic with ease and precision using this Carbon Emissions Of Countries Bar Graph Professional PDF. This layout presents information on Maximum Production, Consumer Goods, Carbon Emissions. It is also available for immediate download and adjustment. So, changes can be made in the color, design, graphics or any other component to create a unique layout.

Manufacturing Productivity Analysis Bar Graph Introduction PDF
This slide illustrates the productivity chart of manufacturing of a company. It includes quantity produced in million units against the time period. Pitch your topic with ease and precision using this Manufacturing Productivity Analysis Bar Graph Introduction PDF. This layout presents information on Manufacturing Productivity, Production Decreased, Closure Of Companies. It is also available for immediate download and adjustment. So, changes can be made in the color, design, graphics or any other component to create a unique layout.
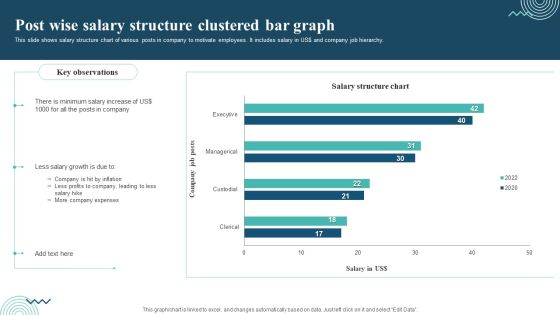
Post Wise Salary Structure Clustered Bar Graph Professional PDF
This slide shows salary structure chart of various posts in company to motivate employees. It includes salary in US dollar and company job hierarchy. Showcasing this set of slides titled Post Wise Salary Structure Clustered Bar Graph Professional PDF. The topics addressed in these templates are Minimum Salary Increase, Less Salary Growth, Company Expenses. All the content presented in this PPT design is completely editable. Download it and make adjustments in color, background, font etc. as per your unique business setting.
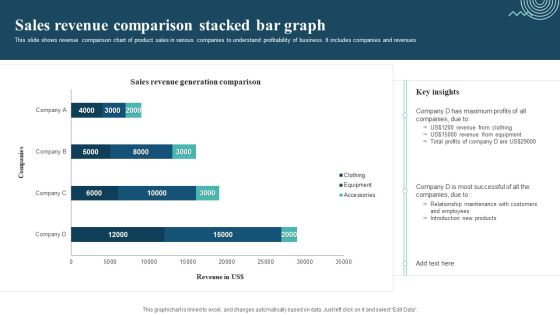
Sales Revenue Comparison Stacked Bar Graph Mockup PDF
This slide shows revenue comparison chart of product sales in various companies to understand profitability of business. It includes companies and revenues. Showcasing this set of slides titled Sales Revenue Comparison Stacked Bar Graph Mockup PDF. The topics addressed in these templates are Sales Revenue Comparison, Revenue From Clothing, Revenue From Equipment. All the content presented in this PPT design is completely editable. Download it and make adjustments in color, background, font etc. as per your unique business setting.

Annual Customer Sales Performance Comparison Graph Portrait PDF
This slide shows the annual sales comparison chart. It also includes total and monthly sales target. Pitch your topic with ease and precision using this Annual Customer Sales Performance Comparison Graph Portrait PDF. This layout presents information on Total Sales Target, Sales Target, Achievement. It is also available for immediate download and adjustment. So, changes can be made in the color, design, graphics or any other component to create a unique layout.

Annual Revenue Margin Comparison Sheet Information PDF
This slide showcases a comparison chart with monthly new customers, revenue, profits, and profit margins. It also includes the profit categorization based on set standards. Showcasing this set of slides titled Annual Revenue Margin Comparison Sheet Information PDF. The topics addressed in these templates are Customers, Revenue, Profit Margin. All the content presented in this PPT design is completely editable. Download it and make adjustments in color, background, font etc. as per your unique business setting.

Two Consecutive Years Revenue Comparison Topics PDF
This slide showcases profitability comparison with the help of a trend chart. It represents revenue, cost of goods sold, gross profit, net profit, etc. Pitch your topic with ease and precision using this Two Consecutive Years Revenue Comparison Topics PDF. This layout presents information on Revenue, Gross Profit, Net Income. It is also available for immediate download and adjustment. So, changes can be made in the color, design, graphics or any other component to create a unique layout.
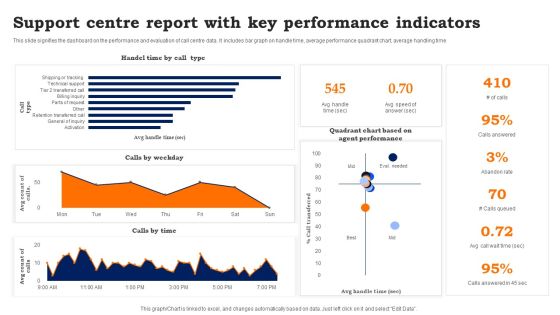
Support Centre Report With Key Performance Indicators Information PDF
This slide signifies the dashboard on the performance and evaluation of call centre data. It includes bar graph on handle time, average performance quadrant chart, average handling time. Showcasing this set of slides titled Support Centre Report With Key Performance Indicators Information PDF. The topics addressed in these templates are Support Centre Report, Key Performance Indicators. All the content presented in this PPT design is completely editable. Download it and make adjustments in color, background, font etc. as per your unique business setting.
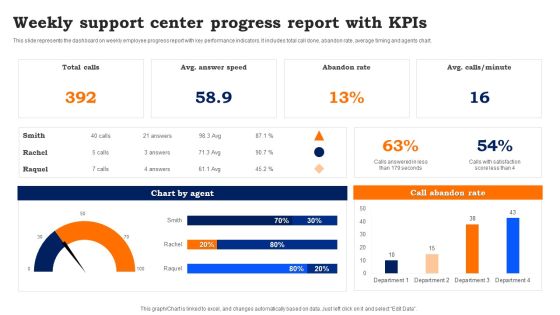
Weekly Support Center Progress Report With Kpis Template PDF
This slide represents the dashboard on weekly employee progress report with key performance indicators. It includes total call done, abandon rate, average timing and agents chart. Pitch your topic with ease and precision using this Weekly Support Center Progress Report With Kpis Template PDF. This layout presents information on Weekly Support, Center Progress Report. It is also available for immediate download and adjustment. So, changes can be made in the color, design, graphics or any other component to create a unique layout.

Marketing Financial Planning And Budgeting Ideas PDF
The slide showcases the pie chart showing budget allocation of marketing. It includes business listing, email, website, SEO, direct mail, text SMS, social PPC and videos. Showcasing this set of slides titled Marketing Financial Planning And Budgeting Ideas PDF. The topics addressed in these templates are Business Listing, Social, Direct Mail. All the content presented in this PPT design is completely editable. Download it and make adjustments in color, background, font etc. as per your unique business setting.
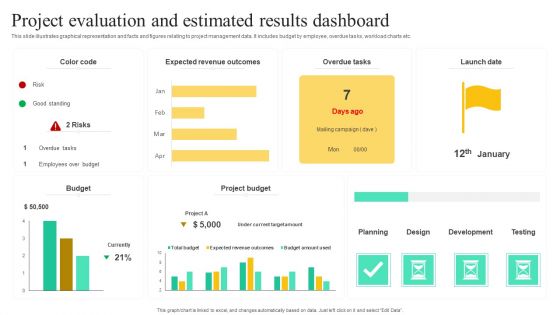
Project Evaluation And Estimated Results Dashboard Ideas PDF
This slide illustrates graphical representation and facts and figures relating to project management data. It includes budget by employee, overdue tasks, workload charts etc. Showcasing this set of slides titled Project Evaluation And Estimated Results Dashboard Ideas PDF. The topics addressed in these templates are Overdue Tasks, Project Budget, Project Evaluation. All the content presented in this PPT design is completely editable. Download it and make adjustments in color, background, font etc. as per your unique business setting.

Agile Team Member Customer Relationship Management Dashboard With Deals Funnel Mockup PDF
This slide illustrates graphical representation of CRM sales team member data. It includes pipeline, business components and activity level, categories etc. Pitch your topic with ease and precision using this Agile Team Member Customer Relationship Management Dashboard With Deals Funnel Mockup PDF. This layout presents information on Funnel Of Deals, Sent Campaigns Emails, Sales Chart. It is also available for immediate download and adjustment. So, changes can be made in the color, design, graphics or any other component to create a unique layout.

Financial Position Evaluation Of Organization Revenue And Expenses Slides PDF
This slide shows pie chart of organizational revenue and expenses. It can be used by a firm to categorize revenue and expenses sources. Showcasing this set of slides titled Financial Position Evaluation Of Organization Revenue And Expenses Slides PDF. The topics addressed in these templates are Expenses, Revenue, Commissions, Services, Products. All the content presented in this PPT design is completely editable. Download it and make adjustments in color, background, font etc. as per your unique business setting.

Summary Of Site Survey Results Survey SS
Following slide shows the complete overview of survey in graphs and pie charts which assist in setting future trends. It basically shows the result of website visitors, overall website rating, etc. Showcasing this set of slides titled Summary Of Site Survey Results Survey SS. The topics addressed in these templates are Summary, Site Survey Results. All the content presented in this PPT design is completely editable. Download it and make adjustments in color, background, font etc. as per your unique business setting.

Managing Hybrid Waterfall Business Approach Project Dashboard Summary PDF
This slide illustrates agile key performance indicators for individual sprints. It includes tasks, story points, bugs, burndown charts, statistics etc. Showcasing this set of slides titled Managing Hybrid Waterfall Business Approach Project Dashboard Summary PDF. The topics addressed in these templates are Tasks, Story Points, Bugs. All the content presented in this PPT design is completely editable. Download it and make adjustments in color, background, font etc. as per your unique business setting.
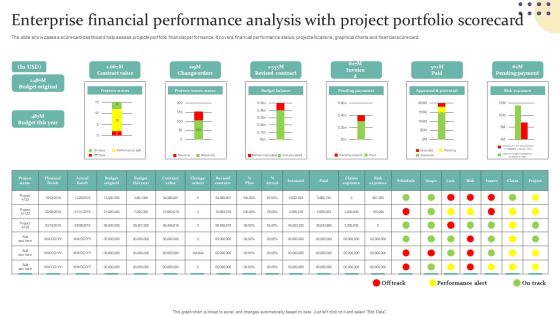
Enterprise Financial Performance Analysis With Project Portfolio Scorecard Guidelines PDF
The slide showcases a scorecard dashboard help assess projects portfolio financial performance. It covers financial performance status, projects locations, graphical charts and financial scorecard. Showcasing this set of slides titled Enterprise Financial Performance Analysis With Project Portfolio Scorecard Guidelines PDF. The topics addressed in these templates are Projects Status, Projects Issues Status, Budget Balance. All the content presented in this PPT design is completely editable. Download it and make adjustments in color, background, font etc. as per your unique business setting.
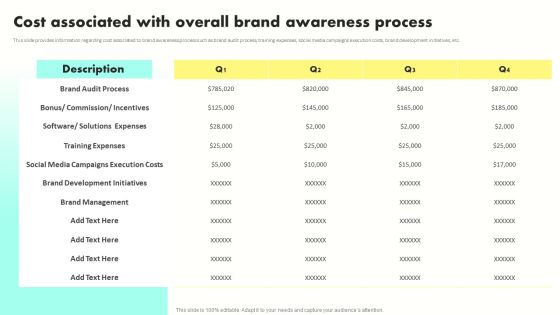
Developing Brand Awareness To Gain Customer Attention Cost Associated With Overall Brand Awareness Process Pictures PDF
This slide provides information regarding cost associated to brand awareness process such as brand audit process, training expenses, social media campaigns execution costs, brand development initiatives, etc. If you are looking for a format to display your unique thoughts, then the professionally designed Developing Brand Awareness To Gain Customer Attention Cost Associated With Overall Brand Awareness Process Pictures PDF is the one for you. You can use it as a Google Slides template or a PowerPoint template. Incorporate impressive visuals, symbols, images, and other charts. Modify or reorganize the text boxes as you desire. Experiment with shade schemes and font pairings. Alter, share or cooperate with other people on your work. Download Developing Brand Awareness To Gain Customer Attention Cost Associated With Overall Brand Awareness Process Pictures PDF and find out how to give a successful presentation. Present a perfect display to your team and make your presentation unforgettable.

Mergers And Acquisitions Synergy Dashboard Guidelines PDF
Deliver and pitch your topic in the best possible manner with this mergers and acquisitions synergy dashboard guidelines pdf. Use them to share invaluable insights on dashboard and impress your audience. This template can be altered and modified as per your expectations. So, grab it now.
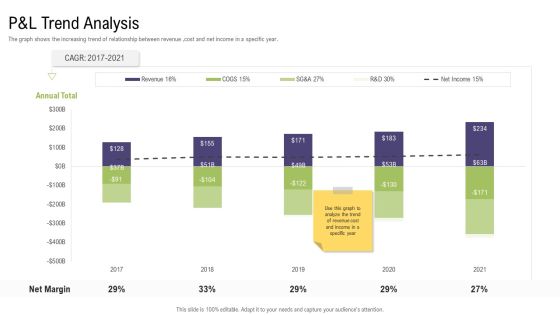
Mergers And Acquisitions Synergy Pandl Trend Analysis Portrait PDF
Deliver an awe-inspiring pitch with this creative mergers and acquisitions synergy pandl trend analysis portrait pdf. bundle. Topics like p and l trend analysis can be discussed with this completely editable template. It is available for immediate download depending on the needs and requirements of the user.
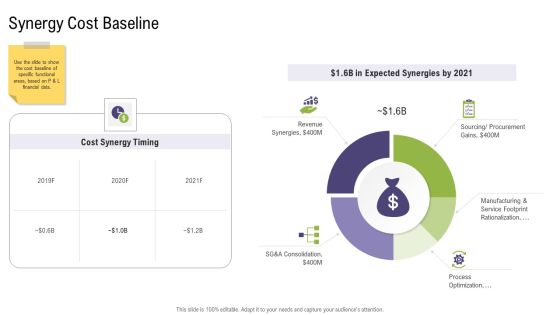
Mergers And Acquisitions Synergy Synergy Cost Baseline Introduction PDF
Deliver and pitch your topic in the best possible manner with this mergers and acquisitions synergy synergy cost baseline introduction pdf. Use them to share invaluable insights on cost synergy timing, synergy cost baseline and impress your audience. This template can be altered and modified as per your expectations. So, grab it now.

Smartphone Sales Dashboard Graphics PDF
This slide shows the dashboard related to smartphone market overview, revenue and sales of the company with top smartphones with their details.Deliver an awe inspiring pitch with this creative smartphone sales dashboard graphics pdf bundle. Topics like smartphone sales dashboard can be discussed with this completely editable template. It is available for immediate download depending on the needs and requirements of the user.
Process Flow For Quick Adoption Of Industry 4 0 In Food Manufacturing Sector Icons PDF
The purpose of this slide is to highlight the process flow for quick adoption of industry 4.0 in food manufacturing sector. The multiple steps illustrated are partner, connect, engage, analyze and decide. Welcome to our selection of the Process Flow For Quick Adoption Of Industry 4 0 In Food Manufacturing Sector Icons PDF. These are designed to help you showcase your creativity and bring your sphere to life. Planning and Innovation are essential for any business that is just starting out. This collection contains the designs that you need for your everyday presentations. All of our PowerPoints are 100 percent editable, so you can customize them to suit your needs. This multi purpose template can be used in various situations. Grab these presentation templates today.

Success Key Global Business Opportunity PowerPoint Templates Ppt Backgrounds For Slides 0313
We present our Success Key Global Business Opportunity PowerPoint Templates PPT Backgrounds For Slides 0313.Present our Marketing PowerPoint Templates because Our PowerPoint Templates and Slides are effectively colour coded to prioritise your plans They automatically highlight the sequence of events you desire. Download and present our Security PowerPoint Templates because You have the co-ordinates for your destination of success. Let our PowerPoint Templates and Slides map out your journey. Present our Global PowerPoint Templates because Our PowerPoint Templates and Slides will give good value for money. They also have respect for the value of your time. Present our Technology PowerPoint Templates because You can Raise a toast with our PowerPoint Templates and Slides. Spread good cheer amongst your audience. Present our Business PowerPoint Templates because Our PowerPoint Templates and Slides are a sure bet. Gauranteed to win against all odds. Use these PowerPoint slides for presentations relating to Global business success themes, global, security, marketing, technology, business. The prominent colors used in the PowerPoint template are Red, Yellow, Black.

Budget For Rapid Application Development Implementation Integrating RAD Model To Simplify Introduction PDF
This slide shows the budget report for rapid application development implementation in the company, including expenditure details of requirements, design, development, testing and deployment, and ongoing support and maintenance stage. Do you have an important presentation coming up Are you looking for something that will make your presentation stand out from the rest Look no further than Budget For Rapid Application Development Implementation Integrating RAD Model To Simplify Introduction PDF. With our professional designs, you can trust that your presentation will pop and make delivering it a smooth process. And with Slidegeeks, you can trust that your presentation will be unique and memorable. So why wait Grab Budget For Rapid Application Development Implementation Integrating RAD Model To Simplify Introduction PDF today and make your presentation stand out from the rest.
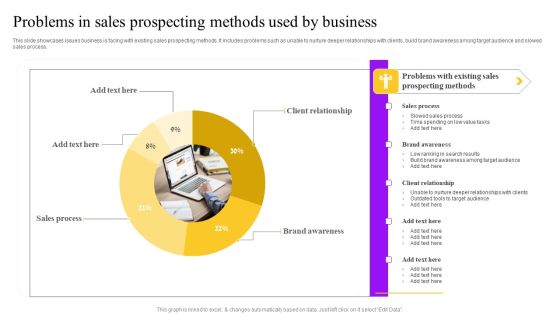
Problems In Sales Prospecting Methods Used By Business Graphics PDF
This slide showcases issues business is facing with existing sales prospecting methods. It includes problems such as unable to nurture deeper relationships with clients, build brand awareness among target audience and slowed sales process. Welcome to our selection of the Problems In Sales Prospecting Methods Used By Business Graphics PDF. These are designed to help you showcase your creativity and bring your sphere to life. Planning and Innovation are essential for any business that is just starting out. This collection contains the designs that you need for your everyday presentations. All of our PowerPoints are 100 percent editable, so you can customize them to suit your needs. This multi purpose template can be used in various situations. Grab these presentation templates today.

Ppt Linear Arrow 12 Stages PowerPoint Templates
PPT linear arrow 12 stages PowerPoint Templates-This PPT is made of Linear arrows. This graphics is of superlative quality that makes an attractive presentation. This template is quite a remedy to present any process-PPT linear arrow 12 stages PowerPoint Templates-Arrow, Background, Collection, Completed, Concept, Confirmation, Design, Flow, Graph, Graphic, Illustration, Indication, Indicator, Information, Instruction, Interface, Internet, Layout, Measurement, Order, Phase, Pointer, Process, Progress, Reflection, Scale, Shape, Sign

Digital Human Resource Business Capability Wheel Ppt Pictures Master Slide PDF
This slide defines the framework of adopting digital capabilities in human resource department of organization. It includes information related to analytics and enhanced HR human resource. Presenting Digital Human Resource Business Capability Wheel Ppt Pictures Master Slide PDF to dispense important information. This template comprises four stages. It also presents valuable insights into the topics including Engagement And Retention, Talent Acquisition, Organization Chart. This is a completely customizable PowerPoint theme that can be put to use immediately. So, download it and address the topic impactfully.
Pricing Benchmarks Ppt PowerPoint Presentation Complete Deck With Slides
If designing a presentation takes a lot of your time and resources and you are looking for a better alternative, then this Pricing Benchmarks Ppt PowerPoint Presentation Complete Deck With Slides is the right fit for you. This is a prefabricated set that can help you deliver a great presentation on the topic. All the Pricing Benchmarks, Software Analysis, IT Department slides included in this sample template can be used to present a birds-eye view of the topic. These slides are also fully editable, giving you enough freedom to add specific details to make this layout more suited to your business setting. Apart from the content, all other elements like color, design, theme are also replaceable and editable. This helps in designing a variety of presentations with a single layout. Not only this, you can use this PPT design in formats like PDF, PNG, and JPG once downloaded. Therefore, without any further ado, download and utilize this sample presentation as per your liking.
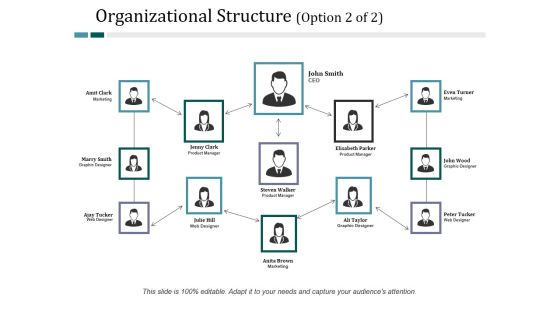
Organizational Structure Template 2 Ppt PowerPoint Presentation Gallery Example Topics
This is a organizational structure template 2 ppt powerpoint presentation gallery example topics. This is a five stage process. The stages in this process are marketing, product manager, graphic designer, ceo, product manager, web designer.
