AI PPT Maker
Templates
PPT Bundles
Design Services
Business PPTs
Business Plan
Management
Strategy
Introduction PPT
Roadmap
Self Introduction
Timelines
Process
Marketing
Agenda
Technology
Medical
Startup Business Plan
Cyber Security
Dashboards
SWOT
Proposals
Education
Pitch Deck
Digital Marketing
KPIs
Project Management
Product Management
Artificial Intelligence
Target Market
Communication
Supply Chain
Google Slides
Research Services
 One Pagers
All Categories
-
Home
- Customer Favorites
- Survey
Survey

Circle Diagram For Business Marketing Mix Powerpoint Slides
This PowerPoint template has been designed with nine steps circle chart. This PPT slide can be used to prepare presentations for profit growth report and also for financial data analysis. You can download finance PowerPoint template to prepare awesome presentations.
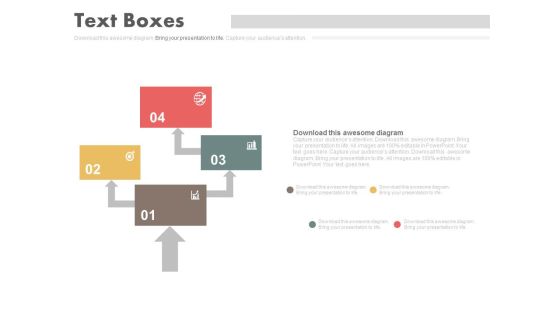
Four Steps Arrow Chart Design Powerpoint Slides
This PowerPoint template has been designed with four steps arrow chart. This PPT slide can be used to prepare presentations for marketing reports and also for financial data analysis. You can download finance PowerPoint template to prepare awesome presentations.

Pyramid For Financial Accounting Information Powerpoint Slides
This PowerPoint template has been designed with graphics of pyramid chart. This PPT slide can be used to prepare presentations for profit growth report and also for financial data analysis. You can download finance PowerPoint template to prepare awesome presentations.

Four Business Option Banner Diagram Powerpoint Template
This business slide contains four option banners with business icons. This PPT diagram is suitable to present concept of profit growth value analysis. Visual effect of this diagram provides more clarity to the subject.

Four Text Tags For Process Flow Powerpoint Template
This PPT slide contains four text tags with business icons. This PPT diagram is suitable to present concept of profit growth value analysis. Enlighten others on the process with this innovative PowerPoint template.

Seven Steps Semicircular Infographic Chart Powerpoint Template
This business slide contains four option banners with business icons. This PPT diagram is suitable to present concept of profit growth value analysis. Visual effect of this diagram provides more clarity to the subject.

Venn Business Chart With Percentage Value Powerpoint Template
This PPT slide contains Venn business chart with percentage values. This PPT diagram is suitable to present data comparison and analysis. Enlighten others on the process with this innovative PowerPoint template.
Six Circular Arrows With Globe And Icons Powerpoint Template
This power point template contains graphics of six circular arrows with globe and icons. Download this PPT diagram slide to display global business analysis. Make outstanding presentation by using this creative diagram.
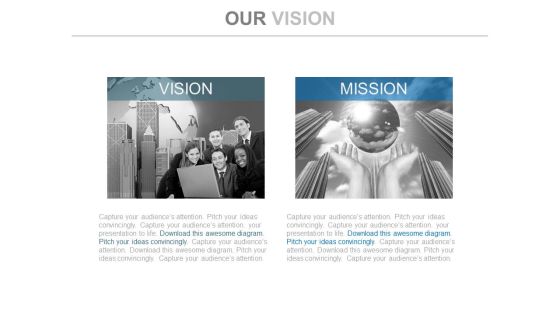
Future Vision And Mission Corporate Layout Powerpoint Slides
This PowerPoint template displays pictures of corporate team member and globe in open sky. You may download this PPT slide to depict corporate vision, mission and strategy analysis. Add this slide to your presentation and impress your superiors.
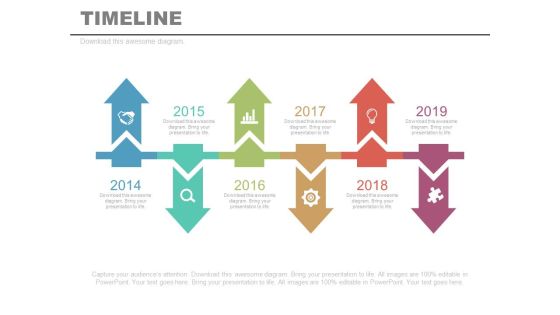
Six Linear Timeline Arrows Year Diagram Powerpoint Slides
This PowerPoint template has been designed with linear timeline steps. This PPT slide may be helpful to display year based business analysis. Download this PowerPoint timeline template to make impressive presentations.

Timeline Operations Managed As Group Powerpoint Slides
This PowerPoint timeline slide design can be used to display timeline operations. It contains sequential timeline diagram with business group. This timeline template can be used in presentations where you need to display team planning and analysis.

Three Steps Ribbon Diagram For Financial Measurement Powerpoint Slides
This PowerPoint template has been designed with three steps ribbon diagram. This PPT slide may be used to display financial strategy and analysis. Make outstanding business presentation with this template.
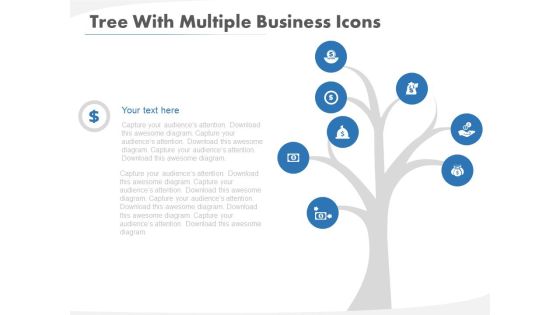
Tree Diagram For Strategic Planning Methods Powerpoint Template
This PowerPoint template has been designed with tree diagram and icons. This diagram slide may be used to depict strategic planning methods. Download this diagram for business research and analysis.
Four Icons Around Target Board For Business Powerpoint Slides
This PPT slide contains graphics of target board with four icons. You may download this PPT slide as tool for marketing target analysis. Impress your audiences by using this PPT slide.

Circular Chart With Icons For Value Chain Powerpoint Template
This PowerPoint template has been designed with circular chart and icons. This professional PPT slide is suitable to present value chain analysis. Capture the attention of your audience using this professional slide.
Pie Chart With Seven Business Icons Powerpoint Templates
Our compelling template consists with a design of pie chart with seven business icons. This slide has been professionally designed to exhibit financial ratio analysis. This template offers an excellent background to build impressive presentation.

Cost Comparison Table Chart Powerpoint Slides
Our above PPT slide displays cost comparison table chart. This diagram may be used to display cost comparison and financial analysis. Download this PowerPoint template to leave permanent impression on your audience.
Four Overlapping Steps With Icons Powerpoint Template
This PPT slide contains four overlapping steps with business icons. This PPT diagram is suitable to present concept of profit growth value analysis. Enlighten others on the process with this innovative PowerPoint template.

Ecuador Map With Six Different Locations And Percentage Values Powerpoint Slides
This PowerPoint template displays graphics of Ecuador map with six different locations and percentage values. This Map template can be used in business presentations to depict economic analysis. This slide can also be used by school students for educational projects.

About Company Ceo Skills Profile Powerpoint Slides
This PowerPoint template contains picture of company CEO with performance analysis. You may use this as introduction slide for your presentation. Download this creative template to catch the attention of the people.

About Us With Founder Ceo Photo Powerpoint Slides
This PowerPoint template contains picture of founder CEO with performance analysis. You may use this as introduction slide for your presentation. Download this creative template to catch the attention of the people.

Four Steps Circular Infographic Powerpoint Templates
Our above slide contains diagram of three stage circular infographic. It helps to display global business analysis. Use this diagram to impart more clarity to data and to create more sound impact on viewers.

Hands Demonstrating Profit Value Powerpoint Templates
Our above slide contains diagram of zigzag arrow on monitor. It helps to display growth analysis and management. Use this diagram to impart more clarity to information and to create more sound impact on viewers.

Chart For Employees Performance Measurement Powerpoint Slides
This PowerPoint template has been designed with graphics of compare chart. You may download this diagram slide for analysis of employee performance. Add this slide to your presentation and impress your superiors.

Circle Chart With Man And Woman Ratio Comparison Powerpoint Slides
This PowerPoint template has been designed with graphics of circle chart. You may download this PPT slide to depict man and woman ratio analysis. Add this slide to your presentation and impress your superiors.

Test Tubes With Percentage Data For Comparison Powerpoint Slides
This PowerPoint template has been designed with test tubes and percentage data. You may download this PPT slide to display data comparison and analysis. Add this slide to your presentation and impress your superiors.
Three Text Boxes With Percentage Values And Icons Powerpoint Slides
This PowerPoint template has been designed with text boxes and percentage data. You may download this PPT slide to display data comparison and analysis. Add this slide to your presentation and impress your superiors.
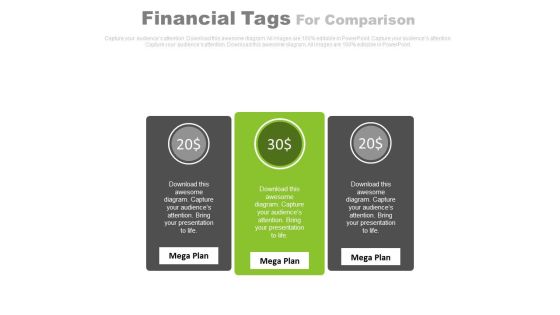
Three Text Tags Compare Chart Powerpoint Slides
This PowerPoint template has been designed with text tags and percentage data. You may download this PPT slide to display data comparison and analysis. Add this slide to your presentation and impress your superiors.
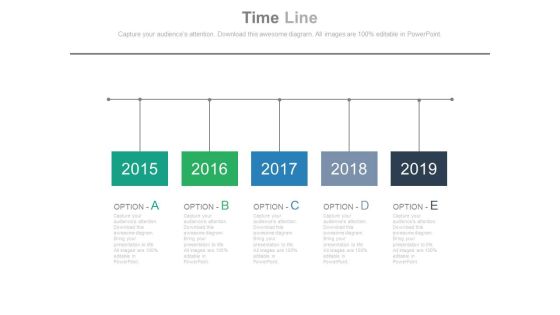
Five Options Timeline Diagram With Years Tags Powerpoint Slides
This PowerPoint template has been designed with five options timeline diagram with years tags. This PPT slide may be helpful to display year based business analysis. Download this PowerPoint timeline template to make impressive presentations.
Five Pointers Timeline Diagram With Icons Powerpoint Slides
This PowerPoint template has been designed with five pointers timeline diagram with icons. This PPT slide may be helpful to display business growth and analysis. Download this PowerPoint timeline template to make impressive presentations.

Five Steps Company Growth Timeline Powerpoint Slides
This PowerPoint timeline slide design can be used to display progress steps. It contains sequential timeline growth steps. This timeline template can be used in presentations where you need to display time planning and analysis.
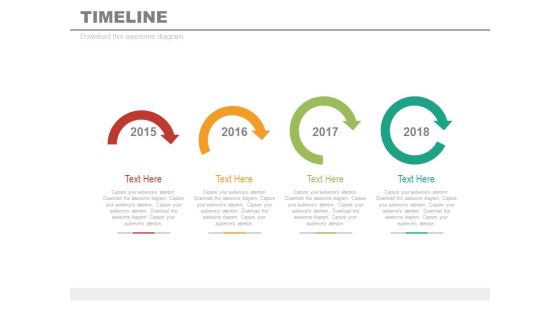
Four Sequential Arrows Timeline Diagram Powerpoint Slides
This PowerPoint timeline template can be used for multiple purposes including vision planning, new milestones and tasks. This PPT slide may be helpful to display timeline steps and year based analysis. Download this PowerPoint timeline template to make impressive presentations.
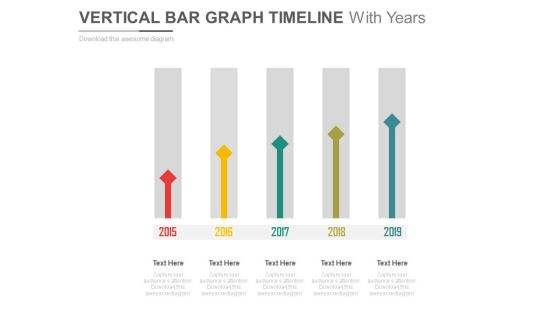
Vertical Arrows Timeline With Years Powerpoint Slides
This PowerPoint template has been designed with sequential arrows timeline diagram. This PPT slide may be helpful to display year based business analysis. Download this PowerPoint timeline template to make impressive presentations.

Year Based Timeline For Sales Planning Powerpoint Slides
This PowerPoint timeline slide design can be used to display progress steps. It contains sequential timeline tags. This timeline template can be used in presentations where you need to display sales planning and analysis.
Year Tags Sequential Timeline With Icons Powerpoint Slides
This PowerPoint timeline slide design can be used to display progress steps. It contains sequential timeline tags. This timeline template can be used in presentations where you need to display sales planning and analysis.
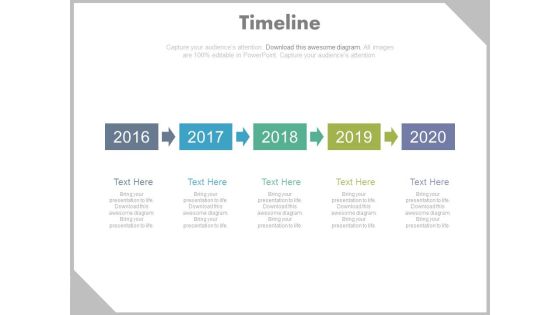
Year Tags Timeline Sequence Diagram Powerpoint Slides
This PowerPoint timeline slide design can be used to display progress steps. It contains sequential timeline tags. This timeline template can be used in presentations where you need to display sales planning and analysis.
Four Circles With Percentage Values And Icons Powerpoint Slides
This PowerPoint template displays info graphic diagram of linear circles. This diagram may be used to exhibit financial growth and analysis. Grab center stage with this slide and capture the attention of your audience.

Four Options Circle Chart With Percentage Powerpoint Slides
This PowerPoint template has been designed with graphics of four options circle chart. This PowerPoint template may be used to display four steps of financial analysis. Prove the viability of your ideas using this impressive slide.

Four Pyramids With Growth Steps Powerpoint Slides
This business slide has been designed with four pyramids. This PowerPoint template may use to display sales growth and analysis. Prove the viability of your ideas using this impressive slide.
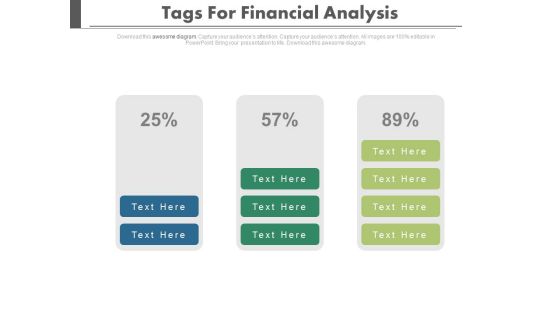
Three Stages Of Financial Growth Powerpoint Slides
Three stages of financial growth have been displayed in this power point template. This diagram helps to portray the concept of financial planning and analysis. Download this template to leave permanent impression on your audience.
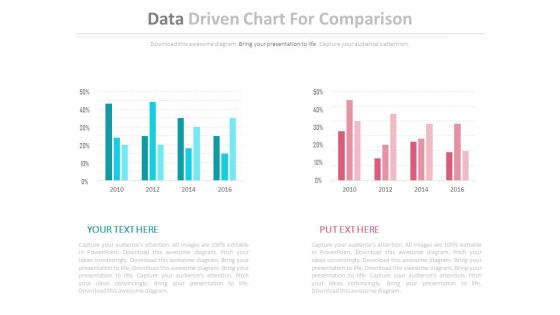
Two Data Driven Comparison Charts Powerpoint Slides
This PowerPoint template contains diagram of two data driven charts. You may use this PPT slide to depict strategic analysis for business. The color coding of this template is specifically designed to highlight you points.
Map Diagram With Bar Graph And Icons Powerpoint Slides
This PowerPoint template displays graphics of map diagram with bar graph and icons. This Map template can be used in business presentations to depict economic analysis. This slide can also be used by school students for educational projects.

Map Diagram With Four Locations Powerpoint Slides
This PowerPoint template displays graphics of map diagram with four locations and percentage values. This Map template can be used in business presentations to depict economic analysis. This slide can also be used by school students for educational projects.

Map Of Africa With Men And Women Gender Ratio Powerpoint Slides
This PowerPoint template displays graphics of Africa map with men women icons. This PPT template can be used to display gender ratio analysis. This slide can also be used by school students for educational projects.
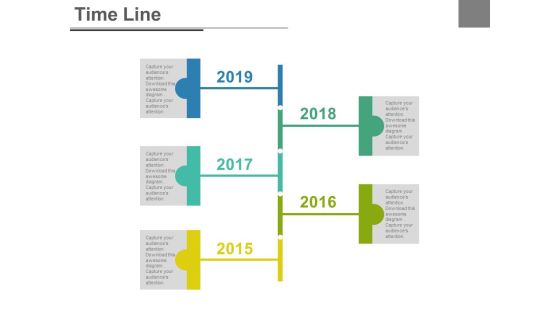
Five Staged Business Timeline Report Powerpoint Slides
This PowerPoint template has been designed with five staged business timeline report diagram. This PPT slide may be helpful to display year based business analysis. Download this PowerPoint timeline template to make impressive presentations.
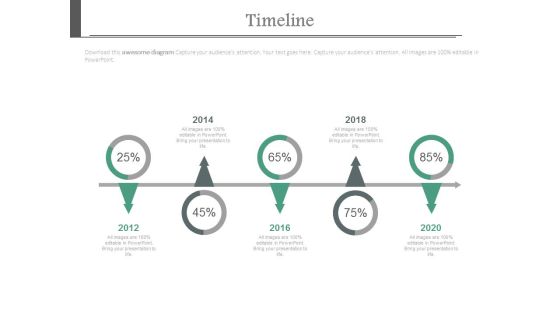
Five Yearly Sequential Timeline With Percentage Values Powerpoint Slides
This PowerPoint timeline slide design can be used to display timeline operations. It contains sequential timeline diagram with percentage values. This timeline template can be used in presentations where you need to display time planning and analysis.
Four Circles With Icons Timeline Design Powerpoint Slides
This PowerPoint timeline template can be used for multiple purposes including vision planning, new milestones and tasks. This PPT slide may be helpful to display timeline steps and year based analysis. Download this PowerPoint timeline template to make impressive presentations.

Three Arrows With Years For Timeline Planning Powerpoint Slides
This PowerPoint template has been designed with three arrows and years. This timeline template may be used to display business planning and analysis. Download this PowerPoint timeline template to make impressive presentations.
Five Circles Sequential Chart With Icons Powerpoint Slides
This PowerPoint template contains sequential chart of five circles with icons. You may download this PPT slide to depict corporate vision, mission and strategy analysis. Add this slide to your presentation and impress your superiors.
Market Trends Chart With Percentage And Icons Powerpoint Slides
This PowerPoint template has been designed with graphics of chart with percentage values and icons. This PowerPoint template may be used to market trends and financial analysis. Prove the viability of your ideas using this impressive slide.

Three Person Tags With Skill Percentage Charts Powerpoint Slides
This PowerPoint template has been designed with three person?s tags with percentage values. This Info graphic diagram may be used to display team skill analysis. Download this impressive diagram to build unique presentations.

Timeline For Team Business Target Achievement Powerpoint Slides
This PowerPoint template contains circles around business team. It may be used to display analysis of team strategy. Download this PPT slide to demonstrate how you intend to navigate your steps towards the desired corporate goal.
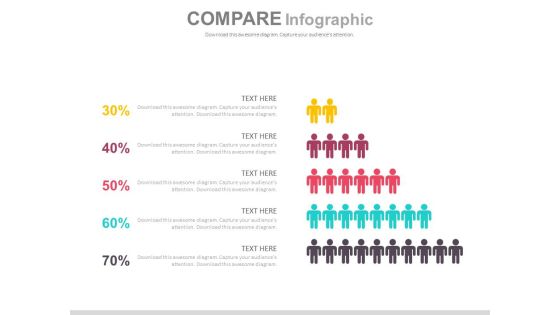
Pyramid Design For Employees Performance Powerpoint Slides
This PPT slide contains graphics of pyramid diagram. Download this PowerPoint template to depict employee?s performance and analysis. Deliver amazing presentations to mesmerize your audience by using this slide design.
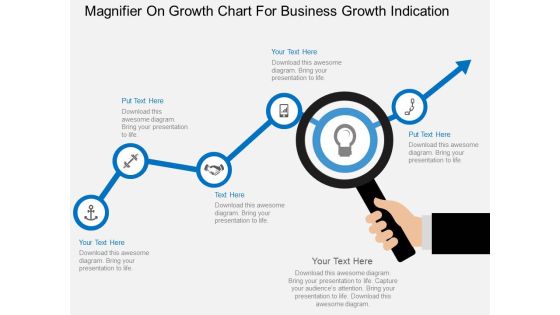
Magnifier On Growth Chart For Business Growth Indication Powerpoint Template
This business slide contains graphics of magnifier on growth chart. This PowerPoint template helps to display business planning and analysis. Use this diagram to impart more clarity to concept and to create more sound impact on viewers.
Four Circles Venn Diagram With Icons Powerpoint Slides
Four circles Venn diagram has been used to design this power point template. This PPT helps to portray the concept of business data analysis. Use this PPT for your business and marketing related presentations.

Four Layered Venn Design For Business Powerpoint Slides
This power point template has been designed with graphic of four layered Venn diagram. Use this Venn diagram for business strategy and analysis. Illustrate your ideas and imprint them in the minds of your team with this template.
Three Overlapping Circles With Business Icons Powerpoint Slides
This power point template has been designed with three overlapping circles and business icons. Use this Venn diagram for business planning and strategy analysis. Illustrate your ideas and imprint them in the minds of your team with this template.
Three Steps Venn Diagram With Icons Powerpoint Slides
This power point template has been designed with graphic of Venn diagram. Use this Venn diagram for business result analysis. Illustrate your ideas and imprint them in the minds of your team with this template.
Two Circles Venn Diagram With Icons Powerpoint Slides
Venn diagram of two circles has been used to design this power point template. This PPT helps to portray the concept of business data analysis. Use this PPT for your business and marketing related presentations.
Two Layered Venn Diagram With Icons Powerpoint Slides
This power point template has been designed with graphic of two layered Venn diagram. Use this Venn diagram for business strategy and analysis. Illustrate your ideas and imprint them in the minds of your team with this template.
