AI PPT Maker
Templates
PPT Bundles
Design Services
Business PPTs
Business Plan
Management
Strategy
Introduction PPT
Roadmap
Self Introduction
Timelines
Process
Marketing
Agenda
Technology
Medical
Startup Business Plan
Cyber Security
Dashboards
SWOT
Proposals
Education
Pitch Deck
Digital Marketing
KPIs
Project Management
Product Management
Artificial Intelligence
Target Market
Communication
Supply Chain
Google Slides
Research Services
 One Pagers
All Categories
-
Home
- Customer Favorites
- Survey Dashboard
Survey Dashboard

Balance Sheet Kpis Tabular Form Template 1 Ppt PowerPoint Presentation Pictures Tips
This is a balance sheet kpis tabular form template 1 ppt powerpoint presentation pictures tips. This is a four stage process. The stages in this process are noncurrent liabilities, short term borrowings, trade payables, other current liabilities, short term provisions.

Balance Sheet Kpis Tabular Form Template 2 Ppt PowerPoint Presentation Summary Structure
This is a balance sheet kpis tabular form template 2 ppt powerpoint presentation summary structure. This is a four stage process. The stages in this process are net sales, expenses, ebitda, profit after tax, finecing cost.

Balance Sheet Kpis Tabular Form Cont Ppt PowerPoint Presentation Model Graphics Tutorials
This is a balance sheet kpis tabular form cont ppt powerpoint presentation model graphics tutorials. This is a four stage process. The stages in this process are long term loans and advances, current investments, inventories, trade receivables.
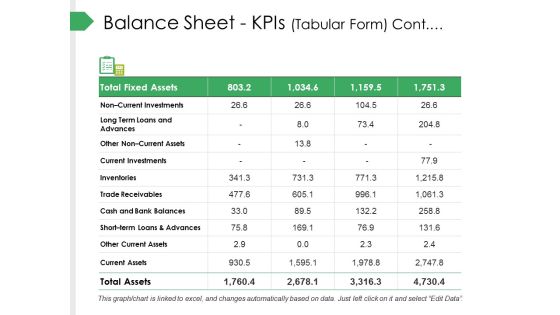
Balance Sheet Kpis Tabular Form Cont Ppt PowerPoint Presentation Summary Templates
This is a balance sheet kpis tabular form cont ppt powerpoint presentation summary templates. This is a four stage process. The stages in this process are current investments, inventories, trade receivables, cash and bank balances.
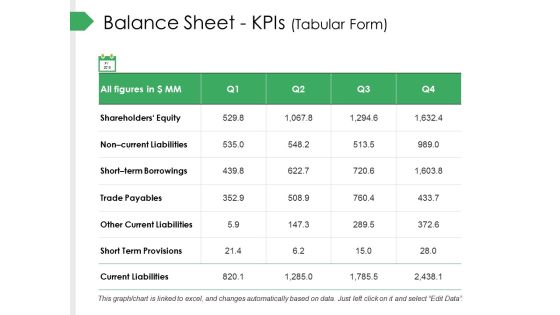
Balance Sheet Kpis Tabular Form Ppt PowerPoint Presentation Slides Designs Download
This is a balance sheet kpis tabular form ppt powerpoint presentation slides designs download. This is a four stage process. The stages in this process are trade payables, other current liabilities, short term provisions, current liabilities, short term borrowings.

P And L Kpis Tabular Form Ppt PowerPoint Presentation Pictures Gallery
This is a p and l kpis tabular form ppt powerpoint presentation pictures gallery. This is a four stage process. The stages in this process are business, marketing, graph, strategy, finance.
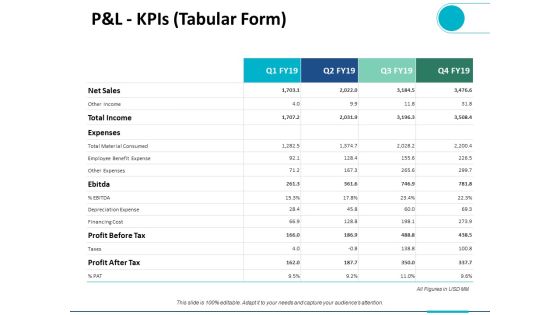
P And L Kpis Tabular Form Ppt PowerPoint Presentation Ideas Brochure
This is a p and l kpis tabular form ppt powerpoint presentation ideas brochure. This is a four stage process. The stages in this process are business, planning, strategy, marketing, management.
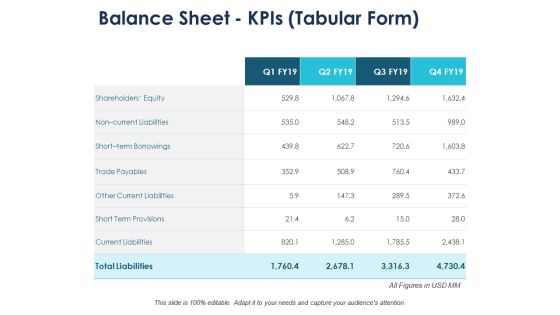
Balance Sheet Kpis Tabular Form Management Ppt PowerPoint Presentation Summary Pictures
This is a balance sheet kpis tabular form management ppt powerpoint presentation summary pictures. This is a four stage process. The stages in this process are compare, marketing, business, management, planning.

P And L Kpis Tabular Form Compare Ppt PowerPoint Presentation Gallery Maker
This is a p and l kpis tabular form compare ppt powerpoint presentation gallery maker. This is a four stage process. The stages in this process are compare, marketing, business, management, planning.

Information Science RACI Matrix For Data Science Ppt PowerPoint Presentation Slides Model PDF
This slide represents the RACI matrix for data science and tasks performed by data analysts, data engineers, data scientists, data architects, and business analysts.Deliver an awe inspiring pitch with this creative Information Science RACI Matrix For Data Science Ppt PowerPoint Presentation Slides Model PDF bundle. Topics like Data Collection, Data Cleaning, Exploratory Analysis can be discussed with this completely editable template. It is available for immediate download depending on the needs and requirements of the user.

Data Chart For Distribution Of Vehicles By Origin And Type Ppt PowerPoint Presentation Infographics Topics
This is a data chart for distribution of vehicles by origin and type ppt powerpoint presentation infographics topics. This is a four stage process. The stages in this process are financial analysis, quantitative, statistical modelling.

Analysing Internet Marketing Industry Report Designs PDF
The following slide highlights industry report of digital advertising to study market conditions and facilitate predicting future trends. It includes components such as analysis of market spend, trends of market price, top players, top pricing models etc. Presenting Analysing Internet Marketing Industry Report Designs PDF to dispense important information. This template comprises five stages. It also presents valuable insights into the topics including Average Digital Advertising, Analysis Market Spend, Trends Market Price . This is a completely customizable PowerPoint theme that can be put to use immediately. So, download it and address the topic impactfully.
Statistical Analysis Icon Of Bar Chart Report Ppt PowerPoint Presentation Gallery Design Ideas PDF
Showcasing this set of slides titled statistical analysis icon of bar chart report ppt powerpoint presentation gallery design ideas pdf. The topics addressed in these templates are statistical analysis icon of bar chart report. All the content presented in this PPT design is completely editable. Download it and make adjustments in color, background, font etc. as per your unique business setting.
Statistical Analysis Report Of Employee Performance Icon Ppt PowerPoint Presentation File Gridlines PDF
Pitch your topic with ease and precision using this statistical analysis report of employee performance icon ppt powerpoint presentation file gridlines pdf. This layout presents information on statistical analysis report of employee performance icon. It is also available for immediate download and adjustment. So, changes can be made in the color, design, graphics or any other component to create a unique layout.
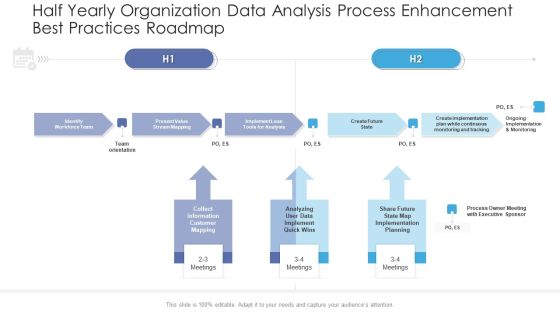
Half Yearly Organization Data Analysis Process Enhancement Best Practices Roadmap Portrait
Presenting the half yearly organization data analysis process enhancement best practices roadmap portrait. The template includes a roadmap that can be used to initiate a strategic plan. Not only this, the PowerPoint slideshow is completely editable and you can effortlessly modify the font size, font type, and shapes according to your needs. This PPT slide can be easily reached in standard screen and widescreen aspect ratios. The set is also available in various formats like PDF, PNG, and JPG. So download and use it multiple times as per your knowledge.

Five Years Public Wellbeing Roadmap With Data Collection And Analysis Topics
Presenting the five years public wellbeing roadmap with data collection and analysis topics. The template includes a roadmap that can be used to initiate a strategic plan. Not only this, the PowerPoint slideshow is completely editable and you can effortlessly modify the font size, font type, and shapes according to your needs. This PPT slide can be easily reached in standard screen and widescreen aspect ratios. The set is also available in various formats like PDF, PNG, and JPG. So download and use it multiple times as per your knowledge.

Half Yearly Public Wellbeing Roadmap With Data Collection And Analysis Graphics
Presenting the half yearly public wellbeing roadmap with data collection and analysis graphics. The template includes a roadmap that can be used to initiate a strategic plan. Not only this, the PowerPoint slideshow is completely editable and you can effortlessly modify the font size, font type, and shapes according to your needs. This PPT slide can be easily reached in standard screen and widescreen aspect ratios. The set is also available in various formats like PDF, PNG, and JPG. So download and use it multiple times as per your knowledge.
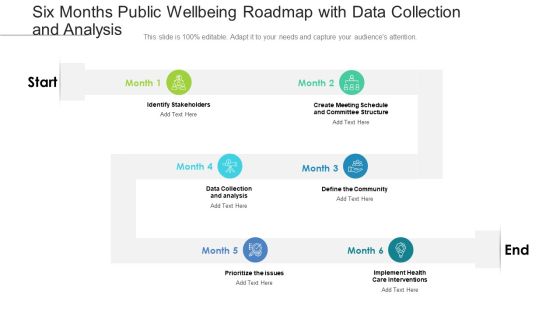
Six Months Public Wellbeing Roadmap With Data Collection And Analysis Clipart
Presenting the six months public wellbeing roadmap with data collection and analysis clipart. The template includes a roadmap that can be used to initiate a strategic plan. Not only this, the PowerPoint slideshow is completely editable and you can effortlessly modify the font size, font type, and shapes according to your needs. This PPT slide can be easily reached in standard screen and widescreen aspect ratios. The set is also available in various formats like PDF, PNG, and JPG. So download and use it multiple times as per your knowledge.
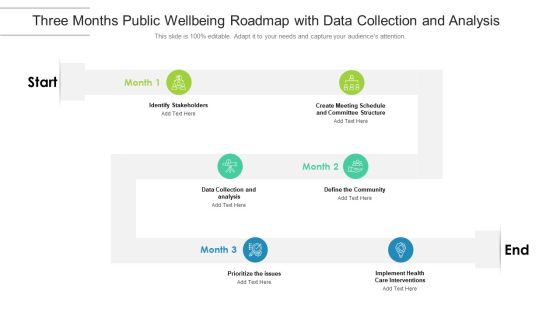
Three Months Public Wellbeing Roadmap With Data Collection And Analysis Guidelines
Presenting the three months public wellbeing roadmap with data collection and analysis guidelines. The template includes a roadmap that can be used to initiate a strategic plan. Not only this, the PowerPoint slideshow is completely editable and you can effortlessly modify the font size, font type, and shapes according to your needs. This PPT slide can be easily reached in standard screen and widescreen aspect ratios. The set is also available in various formats like PDF, PNG, and JPG. So download and use it multiple times as per your knowledge.
Business Operation Modeling Approaches Cost Of Quality Data Analysis Tool Icons PDF
This slide provides the glimpse about the cost of quality technique which focuses on cost of conformance such as prevention and appraisal cost and non conformance such as internal and external failure costs.This is a business operation modeling approaches cost of quality data analysis tool icons pdf template with various stages. Focus and dispense information on two stages using this creative set, that comes with editable features. It contains large content boxes to add your information on topics like cost of quality, cost of conformance, external failure costs You can also showcase facts, figures, and other relevant content using this PPT layout. Grab it now.

Data And Customer Analysis Company Outline Capital Allocation Strategy Information PDF
This slide highlights the Nielsen company capital allocation strategy which includes investing to drive growth, strengthen balance sheet by focusing on de-levering and return capital to shareholders. Boost your pitch with our creative Data And Customer Analysis Company Outline Capital Allocation Strategy Information PDF. Deliver an awe-inspiring pitch that will mesmerize everyone. Using these presentation templates you will surely catch everyones attention. You can browse the ppts collection on our website. We have researchers who are experts at creating the right content for the templates. So you do not have to invest time in any additional work. Just grab the template now and use them.

Data And Customer Analysis Company Outline Diversified And Growing Business Elements PDF
This slide highlights the Nielsen diversified and growing business which includes solutions revenue share, customer base and revenue by geography, contracted revenue and years of experience. Find a pre designed and impeccable Data And Customer Analysis Company Outline Diversified And Growing Business Elements PDF. The templates can ace your presentation without additional effort. You can download these easy to edit presentation templates to make your presentation stand out from others. So, what are you waiting for Download the template from Slidegeeks today and give a unique touch to your presentation.

Data And Customer Analysis Company Outline Earning Per Share Free Cash Flow And EBITDA Structure PDF
This slide highlights the Nielsen Adj EBITDA margin, free cash flow, earnings per share, and organic constant currency revenue growth of the financial year 2021 with margin trend. Boost your pitch with our creative Data And Customer Analysis Company Outline Earning Per Share Free Cash Flow And EBITDA Structure PDF. Deliver an awe-inspiring pitch that will mesmerize everyone. Using these presentation templates you will surely catch everyones attention. You can browse the ppts collection on our website. We have researchers who are experts at creating the right content for the templates. So you do not have to invest time in any additional work. Just grab the template now and use them.

Data And Customer Analysis Company Outline Revenue Growth Trend In Q4 And Fy21 Template PDF
This slide highlights the Nielsen company organic currency and organic constant currency growth trend. It also includes the full year revenue growth for measurement and content. Slidegeeks is one of the best resources for PowerPoint templates. You can download easily and regulate Data And Customer Analysis Company Outline Revenue Growth Trend In Q4 And Fy21 Template PDF for your personal presentations from our wonderful collection. A few clicks is all it takes to discover and get the most relevant and appropriate templates. Use our Templates to add a unique zing and appeal to your presentation and meetings. All the slides are easy to edit and you can use them even for advertisement purposes.
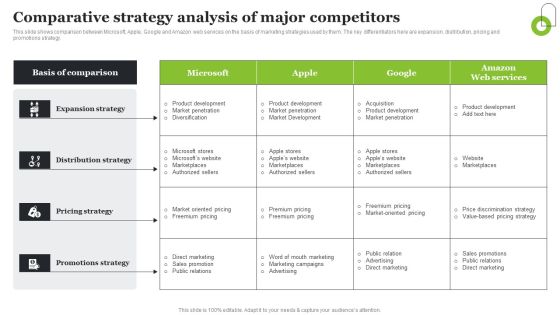
Microsoft Strategic Plan To Become Market Leader Comparative Strategy Analysis Of Major Competitors Structure PDF
This slide shows comparison between Microsoft, Apple, Google and Amazon web services on the basis of marketing strategies used by them. The key differentiators here are expansion, distribution, pricing and promotions strategy. The Microsoft Strategic Plan To Become Market Leader Comparative Strategy Analysis Of Major Competitors Structure PDF is a compilation of the most recent design trends as a series of slides. It is suitable for any subject or industry presentation, containing attractive visuals and photo spots for businesses to clearly express their messages. This template contains a variety of slides for the user to input data, such as structures to contrast two elements, bullet points, and slides for written information. Slidegeeks is prepared to create an impression.

Four Stages Of Manufacturing Supply Chain Maturity Framework Template PDF
This slide shows four stages of supply chain maturity model. It covers information such as data analysis, combine data sources, use analytics in decision making, etc. Showcasing this set of slides titled Four Stages Of Manufacturing Supply Chain Maturity Framework Template PDF. The topics addressed in these templates are Key Sources, Analysis Consistently, Data Manually. All the content presented in this PPT design is completely editable. Download it and make adjustments in color, background, font etc. as per your unique business setting.
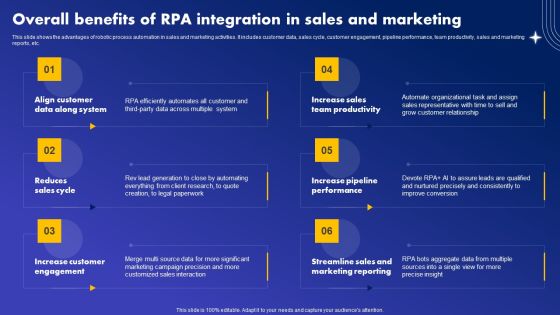
Overall Benefits Of RPA Integration In Sales And Marketing Sample PDF
This slide shows the advantages of robotic process automation in sales and marketing activities. It includes customer data, sales cycle, customer engagement, pipeline performance, team productivity, sales and marketing reports, etc. This Overall Benefits Of RPA Integration In Sales And Marketing Sample PDF from Slidegeeks makes it easy to present information on your topic with precision. It provides customization options, so you can make changes to the colors, design, graphics, or any other component to create a unique layout. It is also available for immediate download, so you can begin using it right away. Slidegeeks has done good research to ensure that you have everything you need to make your presentation stand out. Make a name out there for a brilliant performance.
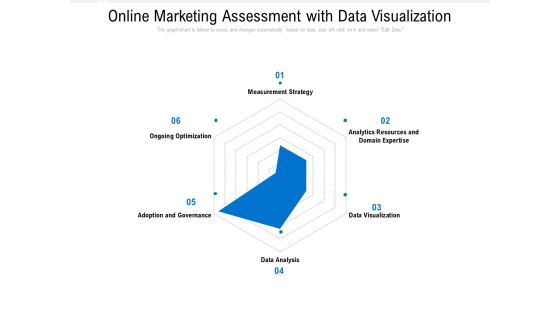
Online Marketing Assessment With Data Visualization Ppt PowerPoint Presentation Gallery Background Images PDF
Presenting this set of slides with name online marketing assessment with data visualization ppt powerpoint presentation gallery background images pdf. The topics discussed in these slides are strategy, data analysis, optimization. This is a completely editable PowerPoint presentation and is available for immediate download. Download now and impress your audience.

Data Analysis Deployment Cost Ppt PowerPoint Presentation Complete Deck With Slides
This data analysis deployment cost ppt powerpoint presentation complete deck with slides acts as backup support for your ideas, vision, thoughts, etc. Use it to present a thorough understanding of the topic. This PPT slideshow can be utilized for both in-house and outside presentations depending upon your needs and business demands. Entailing twelve slides with a consistent design and theme, this template will make a solid use case. As it is intuitively designed, it suits every business vertical and industry. All you have to do is make a few tweaks in the content or any other component to design unique presentations. The biggest advantage of this complete deck is that it can be personalized multiple times once downloaded. The color, design, shapes, and other elements are free to modify to add personal touches. You can also insert your logo design in this PPT layout. Therefore a well-thought and crafted presentation can be delivered with ease and precision by downloading this data analysis deployment cost ppt powerpoint presentation complete deck with slides PPT slideshow.

Agency Performance Template 2 Ppt PowerPoint Presentation Graphics
This is a agency performance template 2 ppt powerpoint presentation graphics. This is a four stage process. The stages in this process are view ability, ad fraud, industry snapshot, brand safety, tra score.

Optimizing Marketing Analytics To Enhance Organizational Growth Business Benefits Of Implementing Demonstration PDF
This slide covers the importance of marketing information analysis for businesses. The advantages mentioned are customer journey personalization, marketing data integration, campaign optimization, and improved cohort segmentation. This modern and well arranged Optimizing Marketing Analytics To Enhance Organizational Growth Business Benefits Of Implementing Demonstration PDF provides lots of creative possibilities. It is very simple to customize and edit with the Powerpoint Software. Just drag and drop your pictures into the shapes. All facets of this template can be edited with Powerpoint no extra software is necessary. Add your own material, put your images in the places assigned for them, adjust the colors, and then you can show your slides to the world, with an animated slide included.

Data Mining Implementation Data Mining In Healthcare Department Designs PDF
This slide depicts the role of data science in healthcare departments and its benefits in different ways, such as image analysis, drug discovery, genetics and Genomics, predictive diagnosis, and NLP.Presenting data mining implementation data mining in healthcare department designs pdf to provide visual cues and insights. Share and navigate important information on five stages that need your due attention. This template can be used to pitch topics like medical image analysis, drug discovery, genetics and genomics In addtion, this PPT design contains high resolution images, graphics, etc, that are easily editable and available for immediate download.
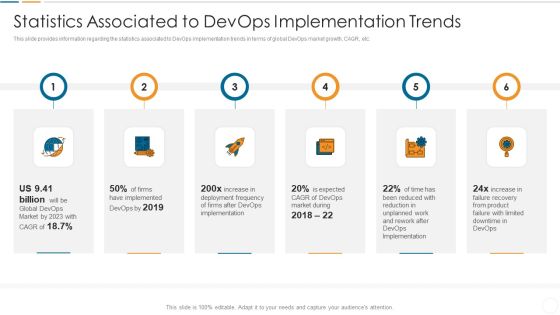
Future Trends Of Devops Industry IT Statistics Associated To Devops Implementation Trends Sample PDF
This slide provides information regarding the statistics associated to DevOps implementation trends in terms of global DevOps market growth, CAGR, etc. Presenting future trends of devops industry it statistics associated to devops implementation trends sample pdf to provide visual cues and insights. Share and navigate important information on six stages that need your due attention. This template can be used to pitch topics like firms have implemented, deployment frequency, devops market during In addtion, this PPT design contains high resolution images, graphics, etc, that are easily editable and available for immediate download.

Key Evaluation Metrics Ppt PowerPoint Presentation Deck
This is a key evaluation metrics ppt powerpoint presentation deck. This is a five stage process. The stages in this process are business, strategy, marketing, analysis, finance, compare.

Centralized Data Model With User Interface And Integration Services Template PDF
Showcasing this set of slides titled centralized data model with user interface and integration services template pdf. The topics addressed in these templates are data analysis, data repository, data governance tools, user interface, integration services. All the content presented in this PPT design is completely editable. Download it and make adjustments in color, background, font etc. as per your unique business setting.

Business Financial Metrics Data Analysis Ppt PowerPoint Presentation Complete Deck With Slides
Improve your presentation delivery using this business financial metrics data analysis ppt powerpoint presentation complete deck with slides. Support your business vision and objectives using this well-structured PPT deck. This template offers a great starting point for delivering beautifully designed presentations on the topic of your choice. Comprising twenty nine this professionally designed template is all you need to host discussion and meetings with collaborators. Each slide is self-explanatory and equipped with high-quality graphics that can be adjusted to your needs. Therefore, you will face no difficulty in portraying your desired content using this PPT slideshow. This PowerPoint slideshow contains every important element that you need for a great pitch. It is not only editable but also available for immediate download and utilization. The color, font size, background, shapes everything can be modified to create your unique presentation layout. Therefore, download it now.

Application Ppt Mobile Screens Data Analysis Ppt PowerPoint Presentation Complete Deck With Slides
If designing a presentation takes a lot of your time and resources and you are looking for a better alternative, then this application ppt mobile screens data analysis ppt powerpoint presentation complete deck with slides is the right fit for you. This is a prefabricated set that can help you deliver a great presentation on the topic. All the twelve slides included in this sample template can be used to present a birds-eye view of the topic. These slides are also fully editable, giving you enough freedom to add specific details to make this layout more suited to your business setting. Apart from the content, all other elements like color, design, theme are also replaceable and editable. This helps in designing a variety of presentations with a single layout. Not only this, you can use this PPT design in formats like PDF, PNG, and JPG once downloaded. Therefore, without any further ado, download and utilize this sample presentation as per your liking.

Customer Data Analysis Team Target Ppt PowerPoint Presentation Complete Deck With Slides
If designing a presentation takes a lot of your time and resources and you are looking for a better alternative, then this customer data analysis team target ppt powerpoint presentation complete deck with slides is the right fit for you. This is a prefabricated set that can help you deliver a great presentation on the topic. All the twelve slides included in this sample template can be used to present a birds-eye view of the topic. These slides are also fully editable, giving you enough freedom to add specific details to make this layout more suited to your business setting. Apart from the content, all other elements like color, design, theme are also replaceable and editable. This helps in designing a variety of presentations with a single layout. Not only this, you can use this PPT design in formats like PDF, PNG, and JPG once downloaded. Therefore, without any further ado, download and utilize this sample presentation as per your liking.

Brand Measurement Data Analysis Ppt PowerPoint Presentation Complete Deck With Slides
Improve your presentation delivery using this brand measurement data analysis ppt powerpoint presentation complete deck with slides. Support your business vision and objectives using this well-structured PPT deck. This template offers a great starting point for delivering beautifully designed presentations on the topic of your choice. Comprising fourteen this professionally designed template is all you need to host discussion and meetings with collaborators. Each slide is self-explanatory and equipped with high-quality graphics that can be adjusted to your needs. Therefore, you will face no difficulty in portraying your desired content using this PPT slideshow. This PowerPoint slideshow contains every important element that you need for a great pitch. It is not only editable but also available for immediate download and utilization. The color, font size, background, shapes everything can be modified to create your unique presentation layout. Therefore, download it now.

Comprehensive Customer Data Platform Guide Optimizing Promotional Initiatives Customer Behaviour Analysis KPI Brochure PDF
The following slide showcases customer behavior assessment to gain competitive advantages and analyze their purchase pattern. It includes elements such as visitors, by device, page views, top pages, domains etc. Coming up with a presentation necessitates that the majority of the effort goes into the content and the message you intend to convey. The visuals of a PowerPoint presentation can only be effective if it supplements and supports the story that is being told. Keeping this in mind our experts created Comprehensive Customer Data Platform Guide Optimizing Promotional Initiatives Customer Behaviour Analysis KPI Brochure PDF to reduce the time that goes into designing the presentation. This way, you can concentrate on the message while our designers take care of providing you with the right template for the situation.

Data And Customer Analysis Company Outline Stakeholder Engagement Strategy Template PDF
This slide highlights the Nielsen engagement strategies with stakeholders which includes investors, customers clients, employees and suppliers with key decisions. Retrieve professionally designed Data And Customer Analysis Company Outline Stakeholder Engagement Strategy Template PDF to effectively convey your message and captivate your listeners. Save time by selecting pre made slideshows that are appropriate for various topics, from business to educational purposes. These themes come in many different styles, from creative to corporate, and all of them are easily adjustable and can be edited quickly. Access them as PowerPoint templates or as Google Slides themes. You do not have to go on a hunt for the perfect presentation because Slidegeeks got you covered from everywhere.

Data And Customer Analysis Company Outline Total Employee Count Designs PDF
This slide highlights the Nielsen worldwide employee count which includes the United States, Remaining Americas, Europe and APMEA. It also covers employees under the collective bargaining agreement and council agreement in Europe. Slidegeeks has constructed Data And Customer Analysis Company Outline Total Employee Count Designs PDF after conducting extensive research and examination. These presentation templates are constantly being generated and modified based on user preferences and critiques from editors. Here, you will find the most attractive templates for a range of purposes while taking into account ratings and remarks from users regarding the content. This is an excellent jumping off point to explore our content and will give new users an insight into our top notch PowerPoint Templates.

Customer Service Performance Gap Analysis Framework Ppt Powerpoint Presentation Icon Vector Pdf
Persuade your audience using this customer service performance gap analysis framework ppt powerpoint presentation icon vector pdf. This PPT design covers five stages, thus making it a great tool to use. It also caters to a variety of topics including high performers, crm interaction, increase customer service presence, strong data analytics, limited crm, customer service presence. Download this PPT design now to present a convincing pitch that not only emphasizes the topic but also showcases your presentation skills.
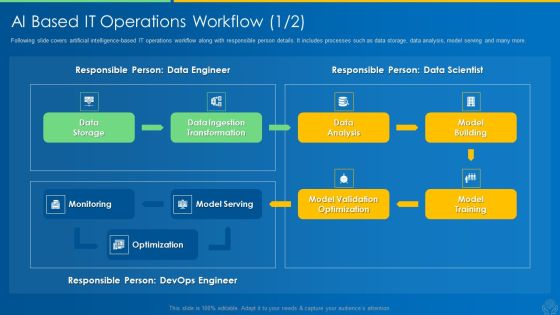
AI And ML Driving Monetary Value For Organization AI Based IT Operations Workflow Data Topics PDF
Following slide covers artificial intelligence-based IT operations workflow along with responsible person details. It includes processes such as data storage, data analysis, model serving and many more. Deliver an awe inspiring pitch with this creative ai and ml driving monetary value for organization ai based it operations workflow data topics pdf bundle. Topics like data storage, data ingestion transformation, data analysis, model building, model training can be discussed with this completely editable template. It is available for immediate download depending on the needs and requirements of the user.
Business Diagram Creative Sign With Highway Sign Text Big Data Next Exit Ppt Slide
This diagram has been designed with graphic of magnifier and text boxes. These boxes are used to display creative sign and highway sign for big data analysis. This diagram can be used for data related topics in any presentation.
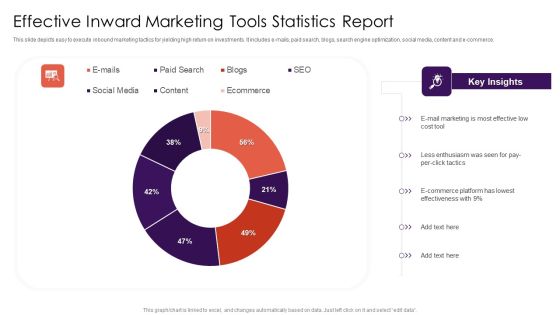
Effective Inward Marketing Tools Statistics Report Structure PDF
This slide depicts easy to execute inbound marketing tactics for yielding high return on investments. It includes e-mails, paid search, blogs, search engine optimization, social media, content and e-commerce.Showcasing this set of slides titled Effective Inward Marketing Tools Statistics Report Structure PDF. The topics addressed in these templates are E Commerce Platform, E Mail Marketing, Social Media. All the content presented in this PPT design is completely editable. Download it and make adjustments in color, background, font etc. as per your unique business setting.
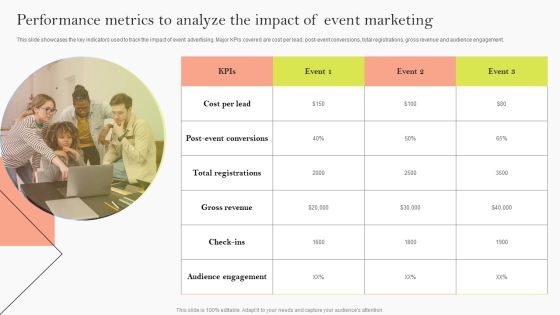
Performance Metrics To Analyze The Impact Of Event Marketing Ppt Model Good PDF
This slide showcases the key indicators used to track the impact of event advertising. Major KPIs covered are cost per lead, post-event conversions, total registrations, gross revenue and audience engagement. This modern and well arranged Performance Metrics To Analyze The Impact Of Event Marketing Ppt Model Good PDF provides lots of creative possibilities. It is very simple to customize and edit with the Powerpoint Software. Just drag and drop your pictures into the shapes. All facets of this template can be edited with Powerpoint no extra software is necessary. Add your own material, put your images in the places assigned for them, adjust the colors, and then you can show your slides to the world, with an animated slide included.

Tiktok Digital Marketing Campaign Vet Potential Tiktok Influencers Key Metrics Download PDF
This slide represents the analysis of key performance indicators of the selected potential TikTok influencer by the marketers for their influencer marketing campaign. It includes details related to key metrics such as engagement rate, followers count etc. Do you have to make sure that everyone on your team knows about any specific topic I yes, then you should give Tiktok Digital Marketing Campaign Vet Potential Tiktok Influencers Key Metrics Download PDF a try. Our experts have put a lot of knowledge and effort into creating this impeccable Tiktok Digital Marketing Campaign Vet Potential Tiktok Influencers Key Metrics Download PDF. You can use this template for your upcoming presentations, as the slides are perfect to represent even the tiniest detail. You can download these templates from the Slidegeeks website and these are easy to edit. So grab these today
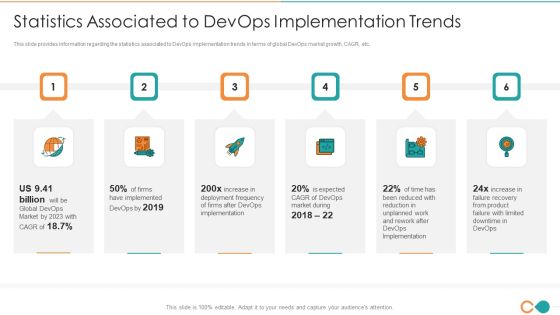
Latest Trends Of Devops It Statistics Associated To Devops Implementation Trends Slides PDF
This slide provides information regarding the statistics associated to DevOps implementation trends in terms of global DevOps market growth, CAGR, etc. This is a latest trends of devops it statistics associated to devops implementation trends slides pdf template with various stages. Focus and dispense information on six stages using this creative set, that comes with editable features. It contains large content boxes to add your information on topics like statistics associated to devops implementation trends. You can also showcase facts, figures, and other relevant content using this PPT layout. Grab it now.

Lego Blocks Design For Data Representation Powerpoint Slides
This PowerPoint template has been designed with Lego blocks diagram. You can use this ppt slide for statistical analysis or for data representation. Download this PPT slide to build impressive presentations.
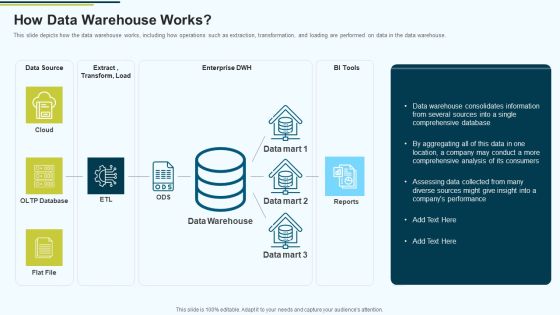
MIS How Data Warehouse Works Ppt PowerPoint Presentation Summary Backgrounds PDF
This slide depicts how the data warehouse works, including how operations such as extraction, transformation, and loading are performed on data in the data warehouse.Deliver an awe inspiring pitch with this creative MIS How Data Warehouse Works Ppt PowerPoint Presentation Summary Backgrounds PDF bundle. Topics like Data Warehouse Consolidates, Comprehensive Analysis, Companys Performance can be discussed with this completely editable template. It is available for immediate download depending on the needs and requirements of the user.
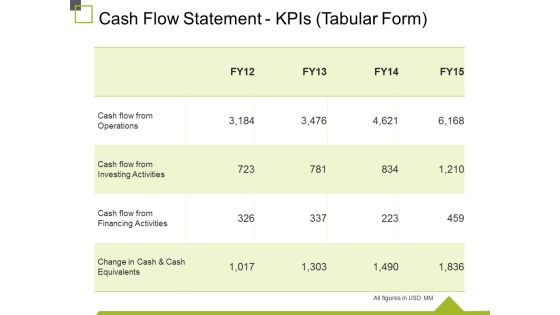
Cash Flow Statement Kpis Tabular Form Ppt PowerPoint Presentation Gallery Infographic Template
This is a cash flow statement kpis tabular form ppt powerpoint presentation gallery infographic template. This is a four stage process. The stages in this process are cash flow from operations, cash flow from investing activities, cash flow from financing activities, change in cash and cash equivalents change in cash and cash equivalents.
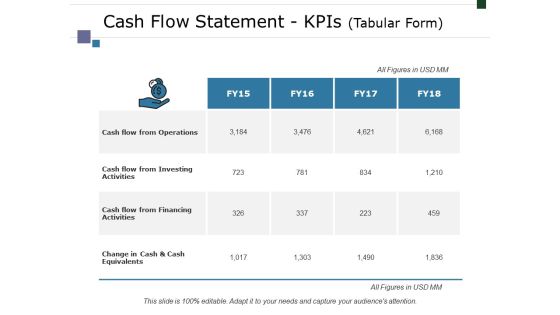
Cash Flow Statement Kpis Tabular Form Ppt PowerPoint Presentation Summary Graphics Tutorials
This is a cash flow statement kpis tabular form ppt powerpoint presentation summary graphics tutorials. This is a four stage process. The stages in this process are cash flow from operations, cash flow from investing activities, cash flow from financing activities, change in cash and cash equivalents, business.
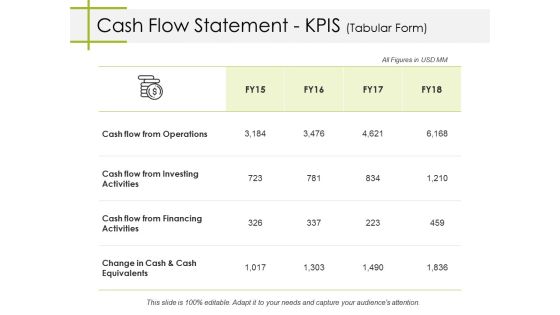
Cash Flow Statement Kpis Tabular Form Ppt PowerPoint Presentation Portfolio Vector
This is a cash flow statement kpis tabular form ppt powerpoint presentation portfolio vector. This is a four stage process. The stages in this process are business, cash flow from operations, cash flow from investing activities, cash flow from financing activities, change in cash and cash equivalents.

Cash Flow Statement Kpis Tabular Form Ppt PowerPoint Presentation Slides Skills
This is a cash flow statement kpis tabular form ppt powerpoint presentation slides skills. This is a four stage process. The stages in this process are business, cash flow from operations, cash flow from investing activities, cash flow from financing activities, change in cash and cash equivalents.

Balance Sheet Kpis Tabular Form Ppt PowerPoint Presentation Outline Graphics Design
Presenting this set of slides with name balance sheet kpis tabular form ppt powerpoint presentation outline graphics design. The topics discussed in these slides are business, management, planning, strategy, marketing. This is a completely editable PowerPoint presentation and is available for immediate download. Download now and impress your audience.

Balance Sheet Kpis Tabular Form Ppt PowerPoint Presentation Summary Graphics Pictures
Presenting this set of slides with name balance sheet kpis tabular form ppt powerpoint presentation summary graphics pictures. The topics discussed in these slides are current assets, current liabilities, total assets, total liabilities. This is a completely editable PowerPoint presentation and is available for immediate download. Download now and impress your audience.

P And L Kpis Tabular Form Ppt PowerPoint Presentation Pictures Introduction
Presenting this set of slides with name p and l kpis tabular form ppt powerpoint presentation pictures introduction. The topics discussed in these slides are revenue, operating profit, net increase cash. This is a completely editable PowerPoint presentation and is available for immediate download. Download now and impress your audience.

Cash Flow Statement Kpis Tabular Form Ppt PowerPoint Presentation Slides Sample
Presenting this set of slides with name cash flow statement kpis tabular form ppt powerpoint presentation slides sample. The topics discussed in these slides are cash flow operations, cash flow investing activities, cash flow financing activities, change cash and cash equivalents. This is a completely editable PowerPoint presentation and is available for immediate download. Download now and impress your audience.

Firm Capability Assessment Balance Sheet Kpis Tabular Form Cont Ppt Professional Format PDF
Presenting this set of slides with name firm capability assessment balance sheet kpis tabular form cont ppt professional format pdf. The topics discussed in these slides are current assets, current liabilities, total liabilities, total assets. This is a completely editable PowerPoint presentation and is available for immediate download. Download now and impress your audience.
