AI PPT Maker
Templates
PPT Bundles
Design Services
Business PPTs
Business Plan
Management
Strategy
Introduction PPT
Roadmap
Self Introduction
Timelines
Process
Marketing
Agenda
Technology
Medical
Startup Business Plan
Cyber Security
Dashboards
SWOT
Proposals
Education
Pitch Deck
Digital Marketing
KPIs
Project Management
Product Management
Artificial Intelligence
Target Market
Communication
Supply Chain
Google Slides
Research Services
 One Pagers
All Categories
-
Home
- Customer Favorites
- Survey Dashboard
Survey Dashboard

Customer Data Analysis Chart For Product Sales Inspiration PDF
Showcasing this set of slides titled customer data analysis chart for product sales inspiration pdf. The topics addressed in these templates are customer data analysis chart for product sales. All the content presented in this PPT design is completely editable. Download it and make adjustments in color, background, font etc. as per your unique business setting.
Latest Trends And Opportunities In Manufacturing Data Analysis Designs PDF
Persuade your audience using this Latest Trends And Opportunities In Manufacturing Data Analysis Designs PDF. This PPT design covers four stages, thus making it a great tool to use. It also caters to a variety of topics including Manufacturing Data Analysis, Opportunities. Download this PPT design now to present a convincing pitch that not only emphasizes the topic but also showcases your presentation skills.
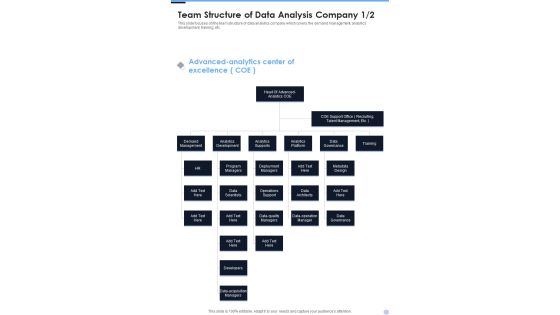
Proposal For Data Analysis In Research Project Team Structure Of Data Analysis Company One Pager Sample Example Document
Presenting you an exemplary Proposal For Data Analysis In Research Project Team Structure Of Data Analysis Company One Pager Sample Example Document. Our one-pager comprises all the must-have essentials of an inclusive document. You can edit it with ease, as its layout is completely editable. With such freedom, you can tweak its design and other elements to your requirements. Download this Proposal For Data Analysis In Research Project Team Structure Of Data Analysis Company One Pager Sample Example Document brilliant piece now.

Data Collection Histograms Ppt PowerPoint Presentation Design Templates
This is a data collection histograms ppt powerpoint presentation design templates. This is a five stage process. The stages in this process are histogram, business, marketing, analysis, chart.
Business Diagram Icons And Charts For Business Growth Presentation Template
Our above slide contains graphics of business charts and icons. It helps to display business reports and analysis. Use this diagram to impart more clarity to data and to create more sound impact on viewers.

Business Modelling Analyse Powerpoint Sample
This is a business modelling analyse powerpoint sample. This is a six stage process. The stages in this process are decision making, transactions, extract transform load, data warehouse, business modelling, reporting and analysis, planning, act, measure, analyse.
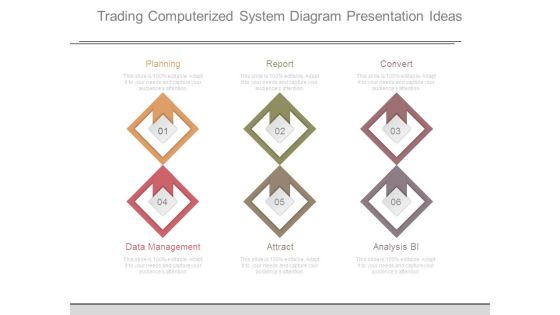
Trading Computerized System Diagram Presentation Ideas
This is a trading computerized system diagram presentation ideas. This is a six stage process. The stages in this process are planning, report, convert, data management, attract, analysis bi.
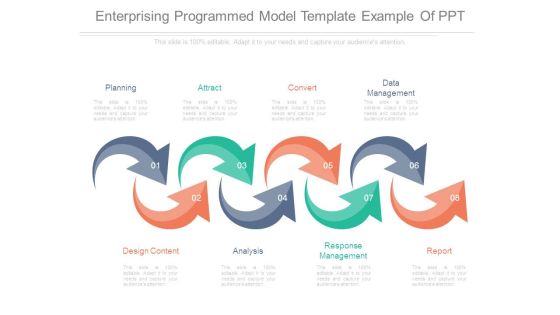
Enterprising Programmed Model Template Example Of Ppt
This is a enterprising programmed model template example of ppt. This is a eight stage process. The stages in this process are `planning, attract, convert, data management, report, response management, analysis, design content.
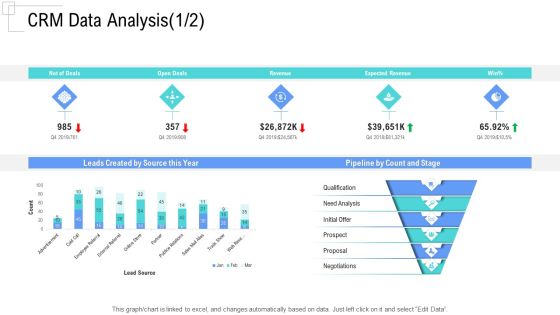
Managing Customer Experience CRM Data Analysis Revenue Designs PDF
This graph or chart is linked to excel, and changes automatically based on data. Just left click on it and select Edit Data.Deliver an awe-inspiring pitch with this creative managing customer experience crm data analysis revenue designs pdf bundle. Topics like leads created by source this year, pipeline by count and stage, qualification, need analysis, initial offer can be discussed with this completely editable template. It is available for immediate download depending on the needs and requirements of the user.

Percentage Data Growth Chart Powerpoint Slides
This PowerPoint template has been designed with percentage data growth chart. Download this PPT chart to depict financial ratio analysis. This PowerPoint slide is of great help in the business sector to make realistic presentations and provides effective way of presenting your newer thoughts.

Business Intelligence And Big Data Analytics Project Plan Lifecycle Icons PDF
This slide shows the data analytics lifecycle covering multiple stages starting from presenting the business case to data identification, data validation, analysis and ending at data visualization and utilization of results. Deliver an awe inspiring pitch with this creative business intelligence and big data analytics project plan lifecycle icons pdf bundle. Topics like business case evaluation, data identification, data analysis, data visualization, data extraction can be discussed with this completely editable template. It is available for immediate download depending on the needs and requirements of the user.

Different Types Of Analysis For Data Visualization Professional PDF
This slide describes the different types of analysis for data visualization, such as univariate analysis, bivariate analysis, and multivariate analysis. Do you have to make sure that everyone on your team knows about any specific topic I yes, then you should give Different Types Of Analysis For Data Visualization Professional PDF a try. Our experts have put a lot of knowledge and effort into creating this impeccable Different Types Of Analysis For Data Visualization Professional PDF. You can use this template for your upcoming presentations, as the slides are perfect to represent even the tiniest detail. You can download these templates from the Slidegeeks website and these are easy to edit. So grab these today.

Data Governance IT What Is A Data Steward In Stewardship Program Elements PDF
This slide outlines the overview of data stewards and their tasks that cater to centralizing details about data, verifying data quality, offering metadata, providing format suggestions for technical and business documentation, and protecting data. If your project calls for a presentation, then Slidegeeks is your go to partner because we have professionally designed, easy to edit templates that are perfect for any presentation. After downloading, you can easily edit Data Governance IT What Is A Data Steward In Stewardship Program Elements PDF and make the changes accordingly. You can rearrange slides or fill them with different images. Check out all the handy templates.
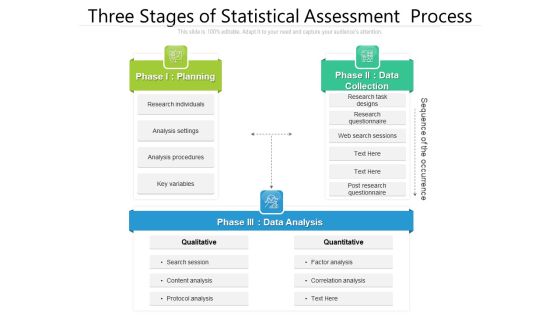
Three Stages Of Statistical Assessment Process Ppt Outline Shapes PDF
Pitch your topic with ease and precision using this three stages of statistical assessment process ppt outline shapes pdf. This layout presents information on planning, data collection, data analysis. It is also available for immediate download and adjustment. So, changes can be made in the color, design, graphics or any other component to create a unique layout.
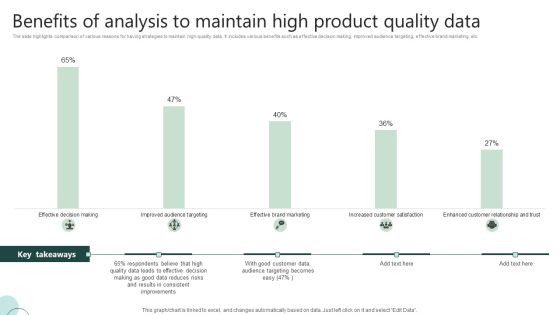
Benefits Of Analysis To Maintain High Product Quality Data Ppt Portfolio Gallery PDF
The slide highlights comparison of various reasons for having strategies to maintain high-quality data. It includes various benefits such as effective decision making, improved audience targeting, effective brand marketing, etc. Showcasing this set of slides titled Benefits Of Analysis To Maintain High Product Quality Data Ppt Portfolio Gallery PDF. The topics addressed in these templates are Effective Decision, Quality Data Leads, Good Customer Data. All the content presented in this PPT design is completely editable. Download it and make adjustments in color, background, font etc. as per your unique business setting.

Big Data Analysis Requirements Ppt Professional Format Ideas PDF
Deliver and pitch your topic in the best possible manner with this big data analysis requirements ppt professional format ideas pdf. Use them to share invaluable insights on data movement, existing skills, data security and impress your audience. This template can be altered and modified as per your expectations. So, grab it now.
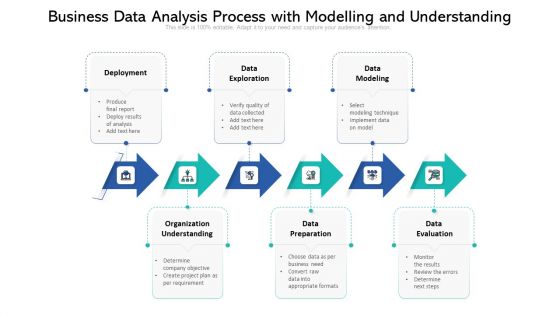
Business Data Analysis Process With Modelling And Understanding Formats PDF
Presenting business data analysis process with modelling and understanding formats pdf. to dispense important information. This template comprises three stages. It also presents valuable insights into the topics including deployment, data exploration, data modeling, organization understanding. This is a completely customizable PowerPoint theme that can be put to use immediately. So, download it and address the topic impactfully.

Four Techniques Of Social Platforms Data Analysis Mining Formats PDF
This slide represents the social media data mining techniques for growth of online businesses. It includes four techniques such as keyword extraction, sentiment, trend and predictive analysis. Persuade your audience using this Four Techniques Of Social Platforms Data Analysis Mining Formats PDF. This PPT design covers four stages, thus making it a great tool to use. It also caters to a variety of topics including Keyword Extraction, Sentiment Analysis, Trend Analysis. Download this PPT design now to present a convincing pitch that not only emphasizes the topic but also showcases your presentation skills.

SMS Marketing Market Size Statistical Analysis Ppt PowerPoint Presentation File Deck PDF
This slide represents the statistical data to help entrepreneurs to estimate how much profit they could earn potentially by incorporating SMS marketing in marketing strategy. It shows details related to total mobile capex etc. Present like a pro with SMS Marketing Market Size Statistical Analysis Ppt PowerPoint Presentation File Deck PDF Create beautiful presentations together with your team, using our easy to use presentation slides. Share your ideas in real time and make changes on the fly by downloading our templates. So whether you are in the office, on the go, or in a remote location, you can stay in sync with your team and present your ideas with confidence. With Slidegeeks presentation got a whole lot easier. Grab these presentations today.
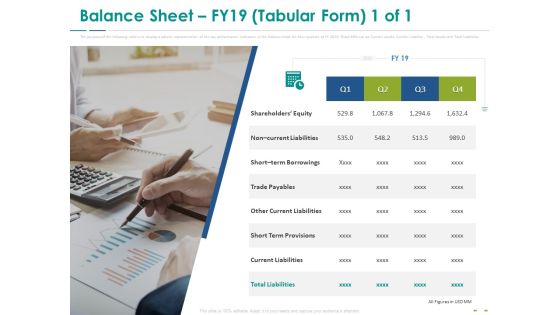
Stock Market Research Report Balance Sheet FY19 Tabular Form Equity Information PDF
The purpose of the following slide is to display the key performance indicators of the balance sheet for four quarters of FY 2019. These KPIs can be Current assets, Current Liability , Total Assets and Total Liabilities. Presenting stock market research report balance sheet fy19 tabular form equity information pdf to provide visual cues and insights. Share and navigate important information on one stages that need your due attention. This template can be used to pitch topics like non current liabilities, short term borrowings, trade payables, other current liabilities, short term provisions. In addition, this PPT design contains high-resolution images, graphics, etc, that are easily editable and available for immediate download.

Projection Model Introduction To Predictive Analytics Technology Elements PDF
This slide represents the predictive analytics introduction that is used for forecasts action, behaviors, and trends using recent and past information. It performs the operations such as data mining, text analytics, statistics, and modeling on structured and unstructured data. Make sure to capture your audiences attention in your business displays with our gratis customizable Projection Model Introduction To Predictive Analytics Technology Elements PDF. These are great for business strategies, office conferences, capital raising or task suggestions. If you desire to acquire more customers for your tech business and ensure they stay satisfied, create your own sales presentation with these plain slides.

Five Steps For Data Compare And Analysis Powerpoint Template
Our above slide contains graphics of five steps chart. This PowerPoint template is useful for data compare and analysis. Use this diagram to impart more clarity to subject and to create more sound impact on viewers.

Bar Graph For Data Distribution And Analysis Powerpoint Slides
This PowerPoint template has been designed with bar graph. This PowerPoint diagram is useful for data distribution and analysis This diagram slide can be used to make impressive presentations.

Mis For Data Analysis Ppt PowerPoint Presentation Pictures Graphics Download
This is a mis for data analysis ppt powerpoint presentation pictures graphics download. This is a three stage process. The stages in this process are management information system, mis, decision making system.

Data Collection And Analysis Ppt Powerpoint Presentation Icon Example Topics
This is a data collection and analysis ppt powerpoint presentation icon example topics. This is a four stage process. The stages in this process are productivity improvement, output improvement, productivity enhancement.

Business Data Analysis And Integration Architecture Brochure PDF
The purpose of this slide is to outline the strategic model in order to monitor and control companies databases that collect and delivers insights across this industry. Certain key elements include data extraction, transform, data cleansing and loading. Presenting Business Data Analysis And Integration Architecture Brochure PDF to dispense important information. This template comprises four stages. It also presents valuable insights into the topics including Analysis Design, Development Or Deployment, Data Monitoring. This is a completely customizable PowerPoint theme that can be put to use immediately. So, download it and address the topic impactfully.
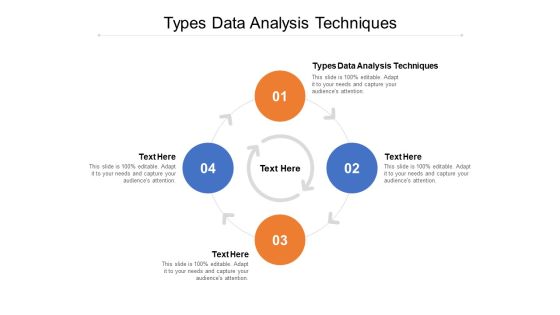
Types Data Analysis Techniques Ppt PowerPoint Presentation Styles Gallery Cpb
Presenting this set of slides with name types data analysis techniques ppt powerpoint presentation styles gallery cpb. This is an editable Powerpoint four stages graphic that deals with topics like types data analysis techniques to help convey your message better graphically. This product is a premium product available for immediate download and is 100 percent editable in Powerpoint. Download this now and use it in your presentations to impress your audience.

Big Data Predictive Analysis Ppt PowerPoint Presentation Sample Cpb
Presenting this set of slides with name big data predictive analysis ppt powerpoint presentation sample cpb. This is an editable Powerpoint five stages graphic that deals with topics like big data predictive analysis to help convey your message better graphically. This product is a premium product available for immediate download and is 100 percent editable in Powerpoint. Download this now and use it in your presentations to impress your audience.

Data Analysis Research Methodology Ppt PowerPoint Presentation Model Graphics Cpb
Presenting this set of slides with name data analysis research methodology ppt powerpoint presentation model graphics cpb. This is an editable Powerpoint six stages graphic that deals with topics like data analysis research methodology to help convey your message better graphically. This product is a premium product available for immediate download and is 100 percent editable in Powerpoint. Download this now and use it in your presentations to impress your audience.
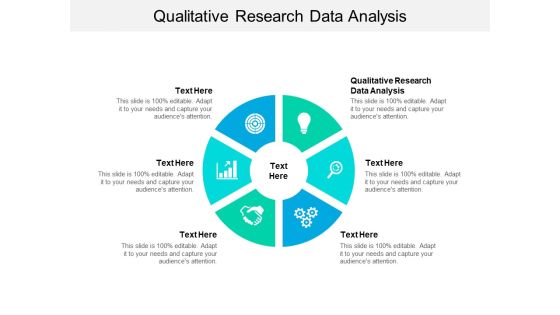
Qualitative Research Data Analysis Ppt PowerPoint Presentation Infographics Show Cpb
Presenting this set of slides with name qualitative research data analysis ppt powerpoint presentation infographics show cpb. This is an editable Powerpoint six stages graphic that deals with topics like qualitative research data analysis to help convey your message better graphically. This product is a premium product available for immediate download and is 100 percent editable in Powerpoint. Download this now and use it in your presentations to impress your audience.
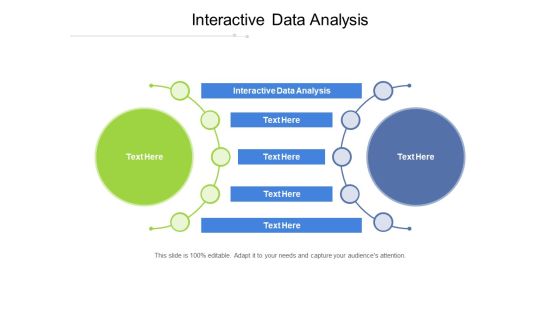
Interactive Data Analysis Ppt PowerPoint Presentation Inspiration Influencers Cpb Pdf
Presenting this set of slides with name interactive data analysis ppt powerpoint presentation inspiration influencers cpb pdf. This is an editable Powerpoint two stages graphic that deals with topics like interactive data analysis to help convey your message better graphically. This product is a premium product available for immediate download and is 100 percent editable in Powerpoint. Download this now and use it in your presentations to impress your audience.

Agenda For Advanced Service Data Analysis Introduction PDF
This is a agenda for advanced service data analysis introduction pdf template with various stages. Focus and dispense information on five stages using this creative set, that comes with editable features. It contains large content boxes to add your information on topics like agenda for advanced service data analysis. You can also showcase facts, figures, and other relevant content using this PPT layout. Grab it now.

Half Yearly Big Data Analysis Strategy Roadmap Infographics
We present our half yearly big data analysis strategy roadmap infographics. This PowerPoint layout is easy-to-edit so you can change the font size, font type, color, and shape conveniently. In addition to this, the PowerPoint layout is Google Slides compatible, so you can share it with your audience and give them access to edit it. Therefore, download and save this well-researched half yearly big data analysis strategy roadmap infographics in different formats like PDF, PNG, and JPG to smoothly execute your business plan.

3 Months Big Data Analysis Strategy Roadmap Sample
We present our 3 months big data analysis strategy roadmap sample. This PowerPoint layout is easy-to-edit so you can change the font size, font type, color, and shape conveniently. In addition to this, the PowerPoint layout is Google Slides compatible, so you can share it with your audience and give them access to edit it. Therefore, download and save this well-researched 3 months big data analysis strategy roadmap sample in different formats like PDF, PNG, and JPG to smoothly execute your business plan.

5 Year Big Data Analysis Strategy Roadmap Brochure
We present our 5 year big data analysis strategy roadmap brochure. This PowerPoint layout is easy-to-edit so you can change the font size, font type, color, and shape conveniently. In addition to this, the PowerPoint layout is Google Slides compatible, so you can share it with your audience and give them access to edit it. Therefore, download and save this well-researched 5 year big data analysis strategy roadmap brochure in different formats like PDF, PNG, and JPG to smoothly execute your business plan.

6 Months Big Data Analysis Strategy Roadmap Diagrams
We present our 6 months big data analysis strategy roadmap diagrams. This PowerPoint layout is easy-to-edit so you can change the font size, font type, color, and shape conveniently. In addition to this, the PowerPoint layout is Google Slides compatible, so you can share it with your audience and give them access to edit it. Therefore, download and save this well-researched 6 months big data analysis strategy roadmap diagrams in different formats like PDF, PNG, and JPG to smoothly execute your business plan.
Data Issues Analysis Icon For Quality Control Management Topics PDF
Persuade your audience using this data issues analysis icon for quality control management topics pdf. This PPT design covers four stages, thus making it a great tool to use. It also caters to a variety of topics including data issues analysis icon for quality control management. Download this PPT design now to present a convincing pitch that not only emphasizes the topic but also showcases your presentation skills.

Qualitative Analysis Of Interview Data Focus Groups And Content Analysis Ppt PowerPoint Presentation Ideas Guidelines
This is a qualitative analysis of interview data focus groups and content analysis ppt powerpoint presentation ideas guidelines. This is a five stage process. The stages in this process are analysis, observation, qualitative.

Yearly Sales Assessment With Key Performance Indicator Matrix Introduction PDF
This slide covers quarterly product units sold through out a financial year in an organization with growth in revenue, profit and number of customer from previous years sales. It includes product sold and growth rate. Presenting Yearly Sales Assessment With Key Performance Indicator Matrix Introduction PDF to dispense important information. This template comprises four stages. It also presents valuable insights into the topics including Sold Growth Rate, Customers, Growth In Profit. This is a completely customizable PowerPoint theme that can be put to use immediately. So, download it and address the topic impactfully.

Price Analysis Diagram For Analysis In Financial Data Ppt Infographics Summary PDF
Showcasing this set of slides titled price analysis diagram for analysis in financial data ppt infographics summary pdf. The topics addressed in these templates are price analysis diagram for analysis in financial data. All the content presented in this PPT design is completely editable. Download it and make adjustments in color, background, font etc. as per your unique business setting.

Prescriptive Analysis Tool For Data Process Information PDF
This template highlights the prescriptive analysis tools that emphasize actionable insights . It include key analysis tools with their ,features, free trail, pros and cons ,pricing and user review. Pitch your topic with ease and precision using this Prescriptive Analysis Tool For Data Process Information PDF. This layout presents information on Data Visualization, Visualization Capabilities, Automated Workflows. It is also available for immediate download and adjustment. So, changes can be made in the color, design, graphics or any other component to create a unique layout.

Market Research Assessment Of Target Market Requirements Instagram Marketing Campaign Increase Template PDF
The following slide outlines overview of Instagram marketing campaign that can assist organizations to successfully optimize conversion rate. Information covered in this slide is related to campaign details, goal, target audience, influencers, duration, budget, and key metrics. The Market Research Assessment Of Target Market Requirements Instagram Marketing Campaign Increase Template PDF is a compilation of the most recent design trends as a series of slides. It is suitable for any subject or industry presentation, containing attractive visuals and photo spots for businesses to clearly express their messages. This template contains a variety of slides for the user to input data, such as structures to contrast two elements, bullet points, and slides for written information. Slidegeeks is prepared to create an impression.

Freight Inspection Software Proposal About Us One Pager Sample Example Document
This slide provides a snapshot of the cargo inspection system research proposal bidding company, highlighting the foundation year, vision and mission statements, core values, and USP. Presenting you an exemplary Freight Inspection Software Proposal About Us One Pager Sample Example Document. Our one pager comprises all the must have essentials of an inclusive document. You can edit it with ease, as its layout is completely editable. With such freedom, you can tweak its design and other elements to your requirements. Download this Freight Inspection Software Proposal About Us One Pager Sample Example Document brilliant piece now.

Data Lake Architecture Future Of Data Analysis How To Implement Data Lake In AWS Architecture Information PDF
This slide depicts the data lakes on AWS architecture through the data lake console and data lake command-line interface CLI and how S3 helps to provide storage services.Deliver and pitch your topic in the best possible manner with this Data Lake Architecture Future Of Data Analysis How To Implement Data Lake In AWS Architecture Information PDF. Use them to share invaluable insights on Database Migration, Movement Of Existing, Enormous Volumes and impress your audience. This template can be altered and modified as per your expectations. So, grab it now.

Analysis Of Modern Vs Standard Computing Data Formats PDF
Showcasing this set of slides titled Analysis Of Modern Vs Standard Computing Data Formats PDF. The topics addressed in these templates are Data Recovery, Cloud System, Device. All the content presented in this PPT design is completely editable. Download it and make adjustments in color, background, font etc. as per your unique business setting.

Various Measurement Scales For Quantitative Data Analysis Pictures PDF
Showcasing this set of slides titled Various Measurement Scales For Quantitative Data Analysis Pictures PDF. The topics addressed in these templates are Data Type, Characteristic, Usability. All the content presented in this PPT design is completely editable. Download it and make adjustments in color, background, font etc. as per your unique business setting.
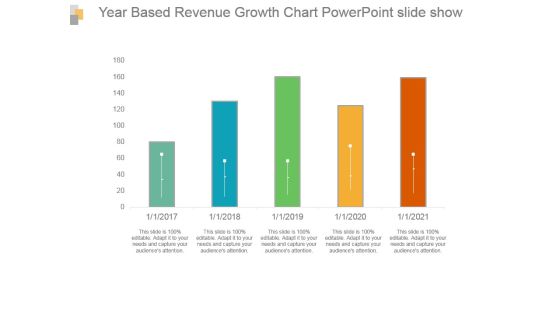
Year Based Revenue Growth Chart Powerpoint Slide Show
This is a year based revenue growth chart powerpoint slide show. This is a five stage process. The stages in this process are bar graph, growth, revenue, year, success.

Year Based Company Financial Highlights Ppt Images
This is a year based company financial highlights ppt images. This is a two stage process. The stages in this process are turnover, gross dividend per share, shareholders funds, paid up share capital.

Cost Leadership Strategy Ppt PowerPoint Presentation Information
This is a cost leadership strategy ppt powerpoint presentation information. This is a three stage process. The stages in this process are advantage, low cost, product uniqueness, target scope, cost leadership strategy.

Last 90 Days Results Ppt PowerPoint Presentation Graphics
This is a last 90 days results ppt powerpoint presentation graphics. This is a five stage process. The stages in this process are new customer ytd, average weekly sales revenue, above sales target i ytd, customer acquisition cost, global performance.

Adoption Curve Ppt PowerPoint Presentation Designs
This is a adoption curve ppt powerpoint presentation designs. This is a five stage process. The stages in this process are innovators, early adopters, early majority, late majority, laggards.

Monthly Traffic Source Overview Ppt PowerPoint Presentation Layouts Show
This is a monthly traffic source overview ppt powerpoint presentation layouts show. This is a three stage process. The stages in this process are google, vine press net, yahoo, bing, sources.

Forecasted Policies And Claims Data After Successful Strategy Implementation Ppt Model Introduction PDF
This slide shows the forecasted policies and claims data after the successful implementation of the strategies which includes policies sold, GWP, average premium etc. This is a forecasted policies and claims data after successful strategy implementation ppt model introduction pdf template with various stages. Focus and dispense information on two stages using this creative set, that comes with editable features. It contains large content boxes to add your information on topics like average premium, paid claims ratio, 2021. You can also showcase facts, figures, and other relevant content using this PPT layout. Grab it now.

Information Transformation Process Toolkit Value Stream Data Analytics Process Demonstration PDF
This slide shows the step by step approach of data analytics project focusing on data gathering, consolidation and data analysis to build business insights for effective decision making. Presenting Information Transformation Process Toolkit Value Stream Data Analytics Process Demonstration PDF to provide visual cues and insights. Share and navigate important information on six stages that need your due attention. This template can be used to pitch topics like Data Cleaning, Field Level Analysis, Data Consolidation, Data Gathering. In addtion, this PPT design contains high resolution images, graphics, etc, that are easily editable and available for immediate download.

Business Intelligence And Big Transformation Toolkit Data Analytics Value Stream Chain Guidelines PDF
This slide illustrates the series of activities required for analyzing the data. It contains information such as data preparation, exploratory analysis, and predictive analytics etc. This is a business intelligence and big transformation toolkit data analytics value stream chain guidelines pdf template with various stages. Focus and dispense information on six stages using this creative set, that comes with editable features. It contains large content boxes to add your information on topics like data preparation, exploratory data analysis, data visualization, classification and clustering, predictive analytics. You can also showcase facts, figures, and other relevant content using this PPT layout. Grab it now.

Data And Customer Analysis Company Outline Our Differentiators Elements PDF
This slide highlights the Nielsen unique selling proposition which includes inclusion and representation, global scale and brand, enhanced data assets and scalable operating model. Get a simple yet stunning designed Data And Customer Analysis Company Outline Our Differentiators Elements PDF. It is the best one to establish the tone in your meetings. It is an excellent way to make your presentations highly effective. So, download this PPT today from Slidegeeks and see the positive impacts. Our easy to edit Data And Customer Analysis Company Outline Our Differentiators Elements PDF can be your go to option for all upcoming conferences and meetings. So, what are you waiting for Grab this template today.

Business Diagram Colored Graph For Business And Finance Data Analysis Presentation Template
This Power Point template has been designed with graphic of colored bar graph. Use this slide to represent five steps of any business process. Use this diagram for your business presentations and get exclusive comments on your efforts.

Competitive Analysis Financial And Operational Data Elements PDF
The slide provides the Competitive landscape of the company on the basis of financial data sales and profit and operational data employee count, locations, number of branches, year of existence, interest rate etc. Deliver an awe inspiring pitch with this creative competitive analysis financial and operational data elements pdf bundle. Topics like interest rate, revenue, interest income, performing can be discussed with this completely editable template. It is available for immediate download depending on the needs and requirements of the user.

Data Acquisition Streamlined Procedure For Information Analysis Clipart PDF
This slide depicts steps to be executed by researchers to assemble relevant, high-quality data relevant to business purposes. It includes steps such as define the research objective, choose a methodology, prepare the data collection process, and gather the data.Presenting Data Acquisition Streamlined Procedure For Information Analysis Clipart PDF to dispense important information. This template comprises four stages. It also presents valuable insights into the topics including Define Research, Data Collection, Execute Techniques . This is a completely customizable PowerPoint theme that can be put to use immediately. So, download it and address the topic impactfully.

Data And Customer Analysis Company Outline International Growth Drivers Download PDF
This slide highlights the Nielsen international growth drivers which includes global strategy with local extension Target the right markets, lead the industry with cross-media and going to market as One Nielsen. This Data And Customer Analysis Company Outline International Growth Drivers Download PDF is perfect for any presentation, be it in front of clients or colleagues. It is a versatile and stylish solution for organizing your meetings. The Data And Customer Analysis Company Outline International Growth Drivers Download PDF features a modern design for your presentation meetings. The adjustable and customizable slides provide unlimited possibilities for acing up your presentation. Slidegeeks has done all the homework before launching the product for you. So, do not wait, grab the presentation templates today
