AI PPT Maker
Templates
PPT Bundles
Design Services
Business PPTs
Business Plan
Management
Strategy
Introduction PPT
Roadmap
Self Introduction
Timelines
Process
Marketing
Agenda
Technology
Medical
Startup Business Plan
Cyber Security
Dashboards
SWOT
Proposals
Education
Pitch Deck
Digital Marketing
KPIs
Project Management
Product Management
Artificial Intelligence
Target Market
Communication
Supply Chain
Google Slides
Research Services
 One Pagers
All Categories
-
Home
- Customer Favorites
- Survey Dashboard
Survey Dashboard

Business Data Analysis Vector Icon Ppt PowerPoint Presentation Outline Master Slide PDF
Persuade your audience using this business data analysis vector icon ppt powerpoint presentation outline master slide pdf. This PPT design covers three stages, thus making it a great tool to use. It also caters to a variety of topics including business data analysis vector icon. Download this PPT design now to present a convincing pitch that not only emphasizes the topic but also showcases your presentation skills.

Market Leader In A Segment Ppt PowerPoint Presentation Model
This is a market leader in a segment ppt powerpoint presentation model. This is a one stage process. The stages in this process are stringent vendor approvals and pre qs required, high quality standards, past experience, sizable, state of the art facility required, highly skilled workforce required.
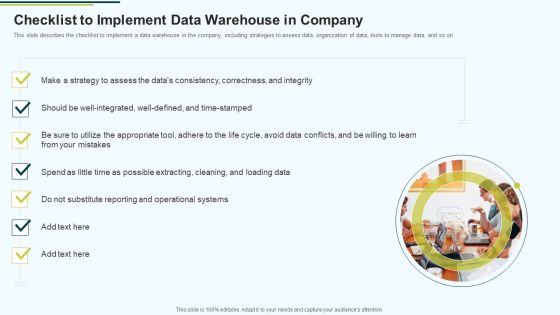
MIS Checklist To Implement Data Warehouse In Company Ppt PowerPoint Presentation Infographic Template Model PDF
This slide describes the checklist to implement a data warehouse in the company, including strategies to assess data, organization of data, tools to manage data, and so on.Presenting MIS Checklist To Implement Data Warehouse In Company Ppt PowerPoint Presentation Infographic Template Model PDF to provide visual cues and insights. Share and navigate important information on one stage that need your due attention. This template can be used to pitch topics like Consistency Correctness, Substitute Reporting And Operational, Possible Extracting In addtion, this PPT design contains high resolution images, graphics, etc, that are easily editable and available for immediate download.
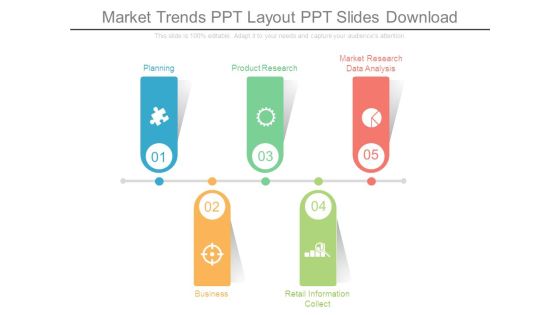
Market Trends Ppt Layout Ppt Slides Download
This is a market trends ppt layout ppt slides download. This is a five stage process. The stages in this process are planning, business, product research, retail information collect, market research data analysis.

Healthcare Company SEO Approach Perform Competitor Analysis Training Ppt
This slide covers competitor analysis as SEO strategy for healthcare industry. It also depicts that this research will assist businesses in better identifying opportunities and preparing for potential threats.

Data Evaluation And Processing Toolkit Value Stream Information Data Analytics Structure Themes PDF
The slides shows the stages of data analytics with reactive and proactive approach. In includes four steps collection, analysis, predictive and actions. This modern and well-arranged Data Evaluation And Processing Toolkit Value Stream Information Data Analytics Structure Themes PDF provides lots of creative possibilities. It is very simple to customize and edit with the Powerpoint Software. Just drag and drop your pictures into the shapes. All facets of this template can be edited with Powerpoint, no extra software is necessary. Add your own material, put your images in the places assigned for them, adjust the colors, and then you can show your slides to the world, with an animated slide included.

Architecture Of Centralized Repository Data Lake Data Lake Creation With Hadoop Cluster Portrait PDF
This slide represents the architecture of the data lake by defining its three major components such as sources, data processing layer, and targets.Are you searching for a Architecture Of Centralized Repository Data Lake Data Lake Creation With Hadoop Cluster Portrait PDF that is uncluttered, straightforward, and original Its easy to edit, and you can change the colors to suit your personal or business branding. For a presentation that expresses how much effort you ve put in, this template is ideal With all of its features, including tables, diagrams, statistics, and lists, its perfect for a business plan presentation. Make your ideas more appealing with these professional slides. Download Architecture Of Centralized Repository Data Lake Data Lake Creation With Hadoop Cluster Portrait PDF from Slidegeeks today.

Major Secondary Methods For Data Requirements For Analytics Mockup PDF
The purpose of this slide is to showcase the secondary methods to collect data for analysis such as business magazines, internet, commercial sources and government agencies. Presenting major secondary methods for data requirements for analytics mockup pdf to dispense important information. This template comprises four stages. It also presents valuable insights into the topics including business magazines, internet, commercial sources. This is a completely customizable PowerPoint theme that can be put to use immediately. So, download it and address the topic impactfully.

Multiple Dimensions Of Data Requirements For Analytics Slides PDF
This slide provides relevant information about the different dimensions of data requirement analysis such as descriptive, diagnostic, predictive and prescriptive. Presenting multiple dimensions of data requirements for analytics slides pdf to dispense important information. This template comprises four stages. It also presents valuable insights into the topics including average, business, techniques. This is a completely customizable PowerPoint theme that can be put to use immediately. So, download it and address the topic impactfully.

Data Requirements For Employee Performance Analytics Graphics PDF
The following slide highlights data requirement for employee performance analysis which includes elements such as absenteeism rate, revenue per employee, overtime per employee and efficiency are along with key insights. Pitch your topic with ease and precision using this data requirements for employee performance analytics graphics pdf. This layout presents information on revenue, employee, rate. It is also available for immediate download and adjustment. So, changes can be made in the color, design, graphics or any other component to create a unique layout.

Key Attributes Of Data Requirements For Analytics Graphics PDF
The following slide indicates the multiple parameters of data requirement analysis such as completeness, accurate, consistency and cost. It also contains information regarding description of each attribute. Presenting key attributes of data requirements for analytics graphics pdf to dispense important information. This template comprises two stages. It also presents valuable insights into the topics including types of attributes, key description. This is a completely customizable PowerPoint theme that can be put to use immediately. So, download it and address the topic impactfully.

Cash Flow Statement Kpis Template 1 Ppt PowerPoint Presentation Gallery Diagrams
This is a cash flow statement kpis template 1 ppt powerpoint presentation gallery diagrams. This is a four stage process. The stages in this process are operations, financing activities, investing activities, net increase in cash.
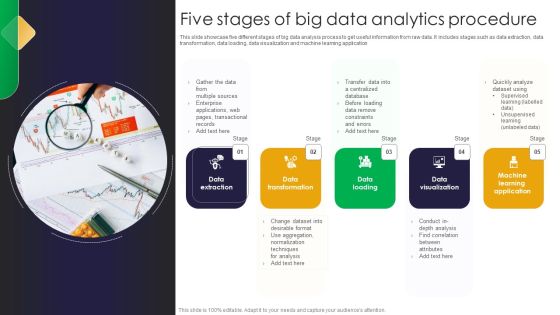
Five Stages Of Big Data Analytics Procedure Brochure PDF
This slide showcase five different stages of big data analysis process to get useful information from raw data. It includes stages such as data extraction, data transformation, data loading, data visualization and machine learning application Persuade your audience using this Five Stages Of Big Data Analytics Procedure Brochure PDF. This PPT design covers six stages, thus making it a great tool to use. It also caters to a variety of topics including Data Extraction, Data Transformation, Data Loading. Download this PPT design now to present a convincing pitch that not only emphasizes the topic but also showcases your presentation skills.
Food Checking For Health And Safety Vector Icon Ppt PowerPoint Presentation Slides Show PDF
Persuade your audience using this food checking for health and safety vector icon ppt powerpoint presentation slides show pdf. This PPT design covers four stages, thus making it a great tool to use. It also caters to a variety of topics including food checking for health and safety vector icon. Download this PPT design now to present a convincing pitch that not only emphasizes the topic but also showcases your presentation skills.
Statistical Data Analysis Chart Vector Icon Ppt PowerPoint Presentation Styles Guide PDF
Showcasing this set of slides titled statistical data analysis chart vector icon ppt powerpoint presentation styles guide pdf. The topics addressed in these templates are statistical data analysis chart vector icon. All the content presented in this PPT design is completely editable. Download it and make adjustments in color, background, font etc. as per your unique business setting.
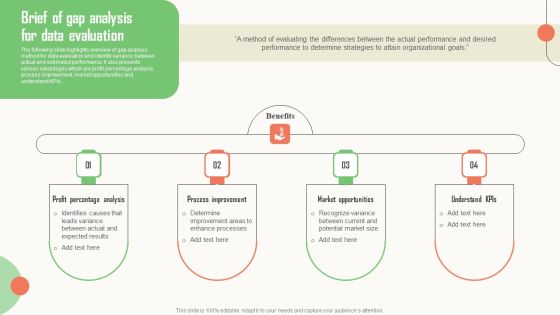
Strategic Market Insight Implementation Guide Brief Of Gap Analysis For Data Evaluation Sample PDF
The following slide highlights overview of gap analysis method for data evaluation and identify variance between actual and estimated performance. It also presents various advantages which are profit percentage analysis, process improvement, market opportunities and understand KPIs. Want to ace your presentation in front of a live audience Our Strategic Market Insight Implementation Guide Brief Of Gap Analysis For Data Evaluation Sample PDF can help you do that by engaging all the users towards you. Slidegeeks experts have put their efforts and expertise into creating these impeccable powerpoint presentations so that you can communicate your ideas clearly. Moreover, all the templates are customizable, and easy to edit and downloadable. Use these for both personal and commercial use.

Data Analytics Management Big Data Management In Automobile Industry Template PDF
This slide explains the big data use cases in the automobile industry and how it would help automobile firms in supply chain management, connected cars, automobile financing, predictive analysis, and design and production.This is a Data Analytics Management Big Data Management In Automobile Industry Template PDF template with various stages. Focus and dispense information on five stages using this creative set, that comes with editable features. It contains large content boxes to add your information on topics like Chain Management, Connected Cars, Automobile Financing. You can also showcase facts, figures, and other relevant content using this PPT layout. Grab it now.
Statistical Data Graph Icon Showing Financial Forecast Rules PDF
Presenting statistical data graph icon showing financial forecast rules pdf to dispense important information. This template comprises four stages. It also presents valuable insights into the topics including statistical data graph icon showing financial forecast. This is a completely customizable PowerPoint theme that can be put to use immediately. So, download it and address the topic impactfully.
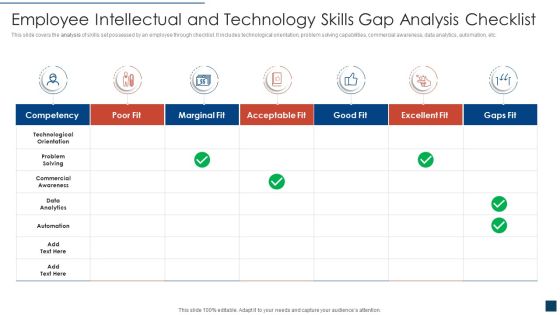
Employee Intellectual And Technology Skills Gap Analysis Checklist Professional PDF
This slide covers the analysis of skills set possessed by an employee through checklist. It includes technological orientation, problem solving capabilities, commercial awareness, data analytics, automation, etc. Pitch your topic with ease and precision using this employee intellectual and technology skills gap analysis checklist professional pdf. This layout presents information on employee intellectual and technology skills gap analysis checklist. It is also available for immediate download and adjustment. So, changes can be made in the color, design, graphics or any other component to create a unique layout.
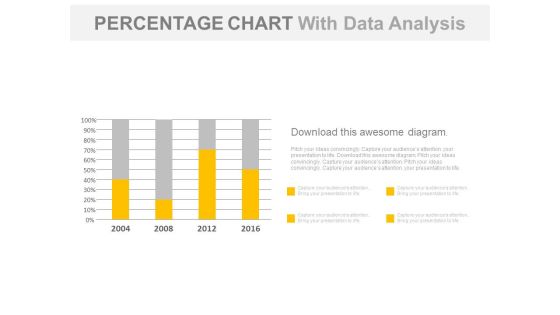
Year Based Chart With Percentage Data Analysis Powerpoint Slides
Our above business slide contains year based statistical chart. This PowerPoint template can be used to display percentage data analysis. Capture the attention of your audience with this slide.
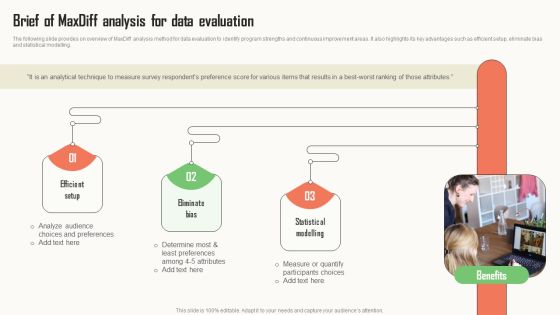
Strategic Market Insight Implementation Guide Brief Of Maxdiff Analysis For Data Evaluation Themes PDF
The following slide provides on overview of MaxDiff analysis method for data evaluation to identify program strengths and continuous improvement areas. It also highlights its key advantages such as efficient setup, eliminate bias and statistical modelling. Do you have to make sure that everyone on your team knows about any specific topic I yes, then you should give Strategic Market Insight Implementation Guide Brief Of Maxdiff Analysis For Data Evaluation Themes PDF a try. Our experts have put a lot of knowledge and effort into creating this impeccable Strategic Market Insight Implementation Guide Brief Of Maxdiff Analysis For Data Evaluation Themes PDF. You can use this template for your upcoming presentations, as the slides are perfect to represent even the tiniest detail. You can download these templates from the Slidegeeks website and these are easy to edit. So grab these today.

Data Driven Customer Insights In Digital Marketing Diagram Example Of Ppt
This is data driven customer insights in digital marketing diagram example of ppt. This is a eight stage process. The stages in this process are digital marketing, situation analysis, market trend, review, objective setting, customer analysis, competitor, mission.

Marketers Guide To Data Analysis Optimization Analyzing Organic Traffic To Boost Brand Awareness Download PDF
This slide covers an overview of organic traffic KPI to identify the people who find and visit your site through a search engine. It also includes optimization strategies such as optimizing for long-tail keyword variations, utilizing latent semantic indexing, etc. If your project calls for a presentation, then Slidegeeks is your go to partner because we have professionally designed, easy to edit templates that are perfect for any presentation. After downloading, you can easily edit Marketers Guide To Data Analysis Optimization Analyzing Organic Traffic To Boost Brand Awareness Download PDF and make the changes accordingly. You can rearrange slides or fill them with different images. Check out all the handy templates
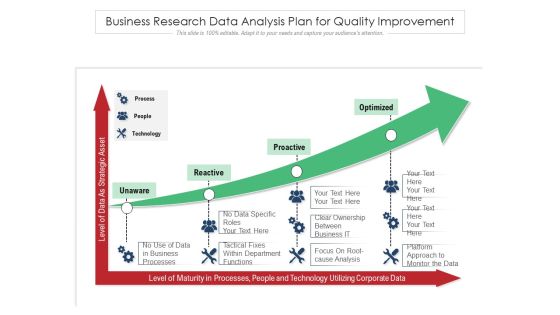
Business Research Data Analysis Plan For Quality Improvement Ppt PowerPoint Presentation File Visual Aids PDF
Presenting business research data analysis plan for quality improvement ppt powerpoint presentation file visual aids pdf to dispense important information. This template comprises four stages. It also presents valuable insights into the topics including unaware, reactive, proactive. This is a completely customizable PowerPoint theme that can be put to use immediately. So, download it and address the topic impactfully.

Human Resources Planning Development Methods Ppt PowerPoint Presentation Complete Deck With Slides
This is a human resources planning development methods ppt powerpoint presentation complete deck with slides. This is a one stage process. The stages in this process are finance, data analysis, graph representation, planning, process.
Database System PowerPoint Icon Cc
Microsoft PowerPoint Template and Background with database system for reports and data analysis
Database System PowerPoint Icon F
Microsoft PowerPoint Template and Background with database system for reports and data analysis
Database System PowerPoint Icon R
Microsoft PowerPoint Template and Background with database system for reports and data analysis
Database System PowerPoint Icon C
Microsoft PowerPoint Template and Background with database system for reports and data analysis
Database System PowerPoint Icon S
Microsoft PowerPoint Template and Background with database system for reports and data analysis

Marketing Analytics Measurement Procedure With Success Rate Guidelines PDF
This slide showcases performance indicators of marketing required by organizations to analyze data to reach a end goals. Key metrics included are attributing social and content to revenue, aligning business goal and marketing, conversion of leads to revenue and data collection and analysis. Showcasing this set of slides titled Marketing Analytics Measurement Procedure With Success Rate Guidelines PDF. The topics addressed in these templates areMarketing Analytics Measurement, Procedure With Success Rate. All the content presented in this PPT design is completely editable. Download it and make adjustments in color, background, font etc. as per your unique business setting.

Functions For Data Computation Department In Organization Structure PDF
This slide covers the various processes involved in data processing adopted in an organization. The purpose of this template is to define the responsibilities of data processing department. It includes the following function validation, sorting, reporting, etc. Presenting Functions For Data Computation Department In Organization Structure PDF to dispense important information. This template comprises seven stages. It also presents valuable insights into the topics including Analysis, Processing Team, Data Management. This is a completely customizable PowerPoint theme that can be put to use immediately. So, download it and address the topic impactfully.

Information Transformation Process Toolkit Data Analytics Software Features Ideas PDF
This slide represents the key features of predictive data analytics including data mining, data visualization, and modelling etc. This is a Information Transformation Process Toolkit Data Analytics Software Features Ideas PDF template with various stages. Focus and dispense information on eight stages using this creative set, that comes with editable features. It contains large content boxes to add your information on topics like Algorithms, Decision Management, Data Analysis, Data Visualization. You can also showcase facts, figures, and other relevant content using this PPT layout. Grab it now.

Key Performance Indicators For Advertising And Promotion Plan Background PDF
This slide shows KPIs for measuring effectiveness of advertising and promotion plan for increasing overall revenue. It include KPIs such as conversion rate, cost per lead and social media management, etc. Persuade your audience using this Key Performance Indicators For Advertising And Promotion Plan Background PDF. This PPT design covers five stages, thus making it a great tool to use. It also caters to a variety of topics including Conversion Rate, Cost Per Lead, Social Media Management. Download this PPT design now to present a convincing pitch that not only emphasizes the topic but also showcases your presentation skills.
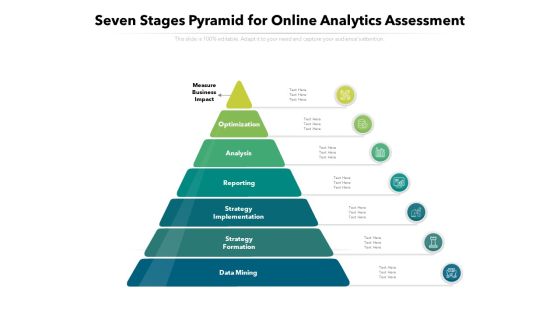
Seven Stages Pyramid For Online Analytics Assessment Ppt PowerPoint Presentation Summary Inspiration PDF
Presenting this set of slides with name seven stages pyramid for online analytics assessment ppt powerpoint presentation summary inspiration pdf. This is a seven stage process. The stages in this process are optimization, analysis, reporting, strategy implementation, strategy formation, data mining. This is a completely editable PowerPoint presentation and is available for immediate download. Download now and impress your audience.

Business Intelligence And Big Key Checklist For Data Analytics Program Structure PDF
This slide shows the list of skills that are required for implementing the data analytics process. Presenting business intelligence and big key checklist for data analytics program structure pdf to provide visual cues and insights. Share and navigate important information on four stages that need your due attention. This template can be used to pitch topics like programming skills. statistics skills, data visualization, communication skills. In addtion, this PPT design contains high resolution images, graphics, etc, that are easily editable and available for immediate download.

Information Transformation Process Toolkit Key Checklist For Data Analytics Program Term Graphics PDF
This slide shows the list of skills that are required for implementing the data analytics process. Presenting Information Transformation Process Toolkit Key Checklist For Data Analytics Program Term Graphics PDF to provide visual cues and insights. Share and navigate important information on four stages that need your due attention. This template can be used to pitch topics like Statistics Skills, Programming Skills, Data Visualization, Communication Skills. In addtion, this PPT design contains high resolution images, graphics, etc, that are easily editable and available for immediate download.
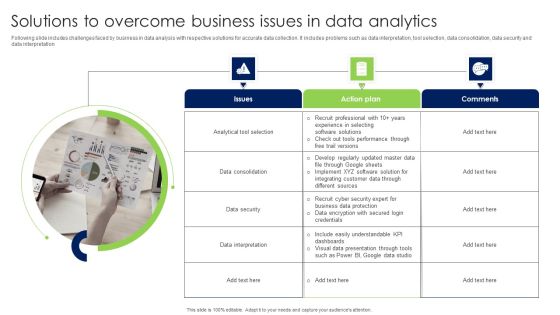
Solutions To Overcome Business Issues In Data Analytics Infographics PDF
Following slide includes challenges faced by business in data analysis with respective solutions for accurate data collection. It includes problems such as data interpretation, tool selection, data consolidation, data security and data interpretation Presenting Solutions To Overcome Business Issues In Data Analytics Infographics PDF to dispense important information. This template comprises Three stages. It also presents valuable insights into the topics including Issues, Action Plan, Comments. This is a completely customizable PowerPoint theme that can be put to use immediately. So, download it and address the topic impactfully.

Checklist To Effectively Deploy Automated Supplier Relationship Management Guidelines PDF
This slide depicts checklist to effectively introduce vendor management automation. It provides information about monitoring, key performance indicators KPIs, digital transformation, operational costs, outsourcing, etc. Slidegeeks is here to make your presentations a breeze with Checklist To Effectively Deploy Automated Supplier Relationship Management Guidelines PDF With our easy-to-use and customizable templates, you can focus on delivering your ideas rather than worrying about formatting. With a variety of designs to choose from, you are sure to find one that suits your needs. And with animations and unique photos, illustrations, and fonts, you can make your presentation pop. So whether you are giving a sales pitch or presenting to the board, make sure to check out Slidegeeks first
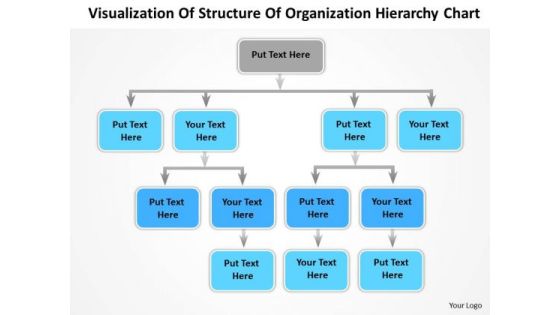
Timeline Visualization Of Structure Of Organization Hierarchy Chart
Timeline crunches are a fact of life. Meet all deadlines using our Timeline Visualization Of Structure Of Organization Hierarchy Chart. Connect the dots using our Timeline Visualization Of Structure Of Organization Hierarchy Chart. Fan expectations as the whole picture emerges.
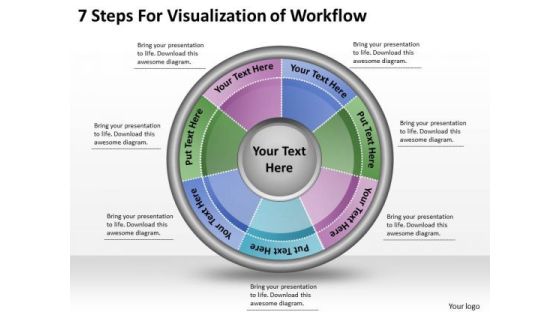
Timeline Ppt Template 7 Steps For Visualization Of Workflow
Get The Domestics Right With Our Timeline Ppt Template 7 Steps For Visualization Of Workflow Powerpoint Templates. Create The Base For Thoughts To Grow.
Statistical Analysis Data Mining Skills Ppt PowerPoint Presentation Slides Grid Cpb
Presenting this set of slides with name statistical analysis data mining skills ppt powerpoint presentation slides grid cpb. This is an editable Powerpoint four stages graphic that deals with topics like statistical analysis data mining skills to help convey your message better graphically. This product is a premium product available for immediate download and is 100 percent editable in Powerpoint. Download this now and use it in your presentations to impress your audience.

Demographic Statistics Icon Depicting Data Analysis And User Profile Brochure PDF
Persuade your audience using this Demographic Statistics Icon Depicting Data Analysis And User Profile Brochure PDF. This PPT design covers three stages, thus making it a great tool to use. It also caters to a variety of topics including Demographic Statistics, Icon Depicting, Data Analysis. Download this PPT design now to present a convincing pitch that not only emphasizes the topic but also showcases your presentation skills.
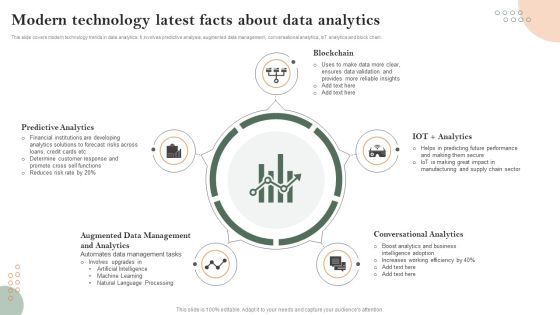
Modern Technology Latest Facts About Data Analytics Template PDF
This slide covers modern technology trends in data analytics. It involves predictive analysis, augmented data management, conversational analytics, IoT analytics and block chain. Persuade your audience using this Modern Technology Latest Facts About Data Analytics Template PDF. This PPT design covers Five stages, thus making it a great tool to use. It also caters to a variety of topics including Predictive Analytics, Blockchain, Conversational Analytics. Download this PPT design now to present a convincing pitch that not only emphasizes the topic but also showcases your presentation skills.

Stock Photo Golden Dollar Symbol With Pie Graph PowerPoint Slide
This Power Point template has been crafted with graphic of golden dollar symbol and pie chart on a tablet. Display the concept of financial data analysis with this image. Use this image to present financial reports in business presentations.

Comprehensive Analysis Of Different Data Lineage Classification Challenges And Objectives Client Themes PDF
This slide describes the client organizations challenges and objectives, including difficulty in examining the demographics of the information, strict regulatory supervision, and different terminology within six divisions of the organization. Get a simple yet stunning designed Comprehensive Analysis Of Different Data Lineage Classification Challenges And Objectives Client Themes PDF. It is the best one to establish the tone in your meetings. It is an excellent way to make your presentations highly effective. So, download this PPT today from Slidegeeks and see the positive impacts. Our easy to edit Comprehensive Analysis Of Different Data Lineage Classification Challenges And Objectives Client Themes PDF can be your go to option for all upcoming conferences and meetings. So, what are you waiting for Grab this template today.

Strategic Marketing For Hair And Beauty Salon To Increase Trending Salon Services Checklist Microsoft PDF
This slide presents a checklist for convenient services in the salon Industry. It includes services such as mobile payments, in salon Wi Fi, mobile rewards and additional conveniences. Find highly impressive Strategic Marketing For Hair And Beauty Salon To Increase Trending Salon Services Checklist Microsoft PDF on Slidegeeks to deliver a meaningful presentation. You can save an ample amount of time using these presentation templates. No need to worry to prepare everything from scratch because Slidegeeks experts have already done a huge research and work for you. You need to download Strategic Marketing For Hair And Beauty Salon To Increase Trending Salon Services Checklist Microsoft PDF for your upcoming presentation. All the presentation templates are 100 percent editable and you can change the color and personalize the content accordingly. Download now.

Guidebook For Executing Business Market Intelligence Brief Of Maxdiff Analysis For Data Evaluation Ideas PDF
The following slide provides on overview of MaxDiff analysis method for data evaluation to identify program strengths and continuous improvement areas. It also highlights its key advantages such as efficient setup, eliminate bias and statistical modelling. Formulating a presentation can take up a lot of effort and time, so the content and message should always be the primary focus. The visuals of the PowerPoint can enhance the presenters message, so our Guidebook For Executing Business Market Intelligence Brief Of Maxdiff Analysis For Data Evaluation Ideas PDF was created to help save time. Instead of worrying about the design, the presenter can concentrate on the message while our designers work on creating the ideal templates for whatever situation is needed. Slidegeeks has experts for everything from amazing designs to valuable content, we have put everything into Guidebook For Executing Business Market Intelligence Brief Of Maxdiff Analysis For Data Evaluation Ideas PDF,

Contextual Data Quality Kpis Metric With Key Parameters Brochure PDF
This slide covers key measures to check quality of data. It includes metrics such as value addition, relevancy, timeliness, completeness and appropriate amount of data with parameters. Presenting Contextual Data Quality Kpis Metric With Key Parameters Brochure PDF to dispense important information. This template comprises Five stages. It also presents valuable insights into the topics including Value Added, Relevancy, Timeliness. This is a completely customizable PowerPoint theme that can be put to use immediately. So, download it and address the topic impactfully.
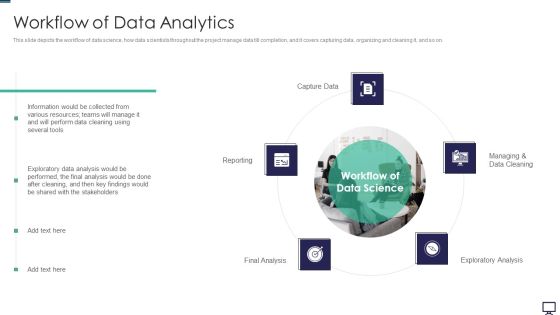
Workflow Of Data Analytics Ppt Styles Graphics Pictures PDF
This slide depicts the workflow of data science, how data scientists throughout the project manage data till completion, and it covers capturing data, organizing and cleaning it, and so on. Presenting workflow of data analytics ppt styles graphics pictures pdf to provide visual cues and insights. Share and navigate important information on five stages that need your due attention. This template can be used to pitch topics like teams, several, capture data, exploratory analysis. In addtion, this PPT design contains high resolution images, graphics, etc, that are easily editable and available for immediate download.

Life Cycle Of Data Analytics Ppt Slides Elements PDF
This slide describes the life cycle of data science, which includes the stages such as predefined business problems, information acquisition, information preparation, etc. This is a life cycle of data analytics ppt slides elements pdf template with various stages. Focus and dispense information on seven stages using this creative set, that comes with editable features. It contains large content boxes to add your information on topics like data visualization, data modeling, feature engineering, exploratory data analysis, data preparation, information acquisition. You can also showcase facts, figures, and other relevant content using this PPT layout. Grab it now.

Challenges And Solutions In Data Requirements For Analytics Slides PDF
The following slide indicates multiple challenges in data requirement analysis such as security gaps, complex data system, low quality data etc. With solutions to overcome those challenges. Presenting challenges and solutions in data requirements for analytics slides pdf to dispense important information. This template comprises five stages. It also presents valuable insights into the topics including security gaps, complex data system, low quality data. This is a completely customizable PowerPoint theme that can be put to use immediately. So, download it and address the topic impactfully.

Stock Photo Black Brown Pie Chart For Business Result PowerPoint Slide
This high quality image is designed with pie chart. Use this image to make business reports. Use this outstanding image in presentations relating to data analysis and reports. Go ahead and add charm to your presentations.
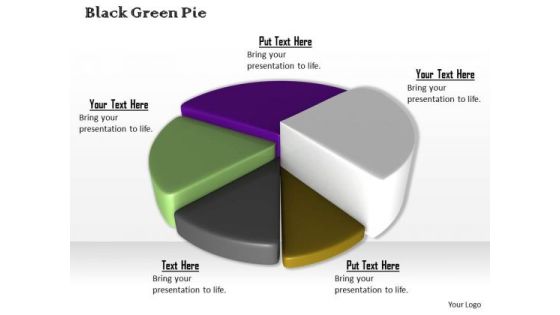
Stock Photo Colorful 3d Pie Chart For Business Result PowerPoint Slide
This high quality image is designed with pie chart. Use this image to make business reports. Use this outstanding image in presentations relating to data analysis and reports. Go ahead and add charm to your presentations.
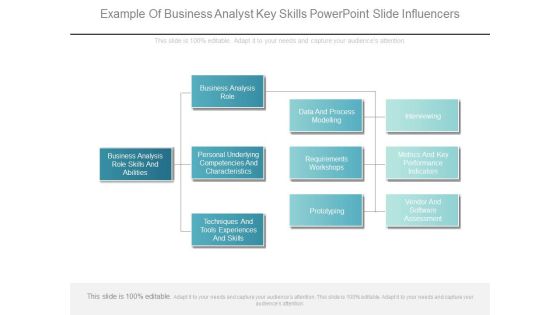
Example Of Business Analyst Key Skills Powerpoint Slide Influencers
This is a example of business analyst key skills powerpoint slide influencers. This is a three stage process. The stages in this process are business analysis role skills and abilities, business analysis role, personal underlying competencies and characteristics, techniques and tools experiences and skills, data and process modelling, requirements workshops, prototyping, interviewing, metrics and key performance indicators, vendor and software assessment.

Challenges In Online Marketing Analytics Elements PDF
This slide presents some pain points in digital marketing analytics that hinder smooth data sourcing and analysis helpful in gaining insights on them and taking appropriate action. This includes non-existing data, data silos, difficulty in analyzing, difficulty in trusting data. Presenting Challenges In Online Marketing Analytics Elements PDF to dispense important information. This template comprises four stages. It also presents valuable insights into the topics including Data Silos, Difficult Analyze Data, Difficult Trust Data. This is a completely customizable PowerPoint theme that can be put to use immediately. So, download it and address the topic impactfully.

Business Focus Vector Icon Ppt PowerPoint Presentation Portfolio Background Image
Presenting this set of slides with name business focus vector icon ppt powerpoint presentation portfolio background image. This is a one stage process. The stages in this process are data visualization icon, research analysis, business focus. This is a completely editable PowerPoint presentation and is available for immediate download. Download now and impress your audience.

Business Performance Graph On Screen Icon Ppt PowerPoint Presentation Show Layouts
Presenting this set of slides with name business performance graph on screen icon ppt powerpoint presentation show layouts. This is a three stage process. The stages in this process are data visualization icon, research analysis, business focus. This is a completely editable PowerPoint presentation and is available for immediate download. Download now and impress your audience.

Business Performance Mapping Vector Icon Ppt PowerPoint Presentation Outline Show
Presenting this set of slides with name business performance mapping vector icon ppt powerpoint presentation outline show. This is a three stage process. The stages in this process are data visualization icon, research analysis, business focus. This is a completely editable PowerPoint presentation and is available for immediate download. Download now and impress your audience.

Computer Screen With Cloud Icon Ppt PowerPoint Presentation Outline Designs
Presenting this set of slides with name computer screen with cloud icon ppt powerpoint presentation outline designs. This is a three stage process. The stages in this process are data visualization icon, research analysis, business focus. This is a completely editable PowerPoint presentation and is available for immediate download. Download now and impress your audience.
