AI PPT Maker
Templates
PPT Bundles
Design Services
Business PPTs
Business Plan
Management
Strategy
Introduction PPT
Roadmap
Self Introduction
Timelines
Process
Marketing
Agenda
Technology
Medical
Startup Business Plan
Cyber Security
Dashboards
SWOT
Proposals
Education
Pitch Deck
Digital Marketing
KPIs
Project Management
Product Management
Artificial Intelligence
Target Market
Communication
Supply Chain
Google Slides
Research Services
 One Pagers
All Categories
-
Home
- Customer Favorites
- Survey Dashboard
Survey Dashboard

Dashboard Depicting Project Associated Risks And Issues Strategies To Enhance Project Lifecycle Background PDF
This slide focuses on project management dashboard which covers the project name, status date overall status, monthly schedule such as analysis, development, quality assurance, user acceptance, pre-production and support with actual and planned budget, pending decisions and actions, etc.Presenting this PowerPoint presentation, titled Dashboard Depicting Project Associated Risks And Issues Strategies To Enhance Project Lifecycle Background PDF, with topics curated by our researchers after extensive research. This editable presentation is available for immediate download and provides attractive features when used. Download now and captivate your audience. Presenting this Dashboard Depicting Project Associated Risks And Issues Strategies To Enhance Project Lifecycle Background PDF. Our researchers have carefully researched and created these slides with all aspects taken into consideration. This is a completely customizable Dashboard Depicting Project Associated Risks And Issues Strategies To Enhance Project Lifecycle Background PDF that is available for immediate downloading. Download now and make an impact on your audience. Highlight the attractive features available with our PPTs.
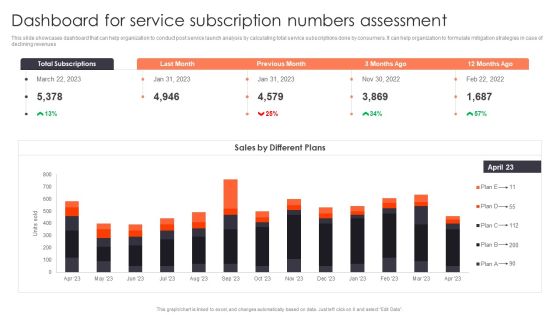
Promotion Strategies For New Service Launch Dashboard For Service Subscription Numbers Assessment Slides PDF
This slide showcases dashboard that can help organization to conduct post service launch analysis by calculating total service subscriptions done by consumers. It can help organization to formulate mitigation strategies in case of declining revenues. Presenting this PowerPoint presentation, titled Promotion Strategies For New Service Launch Dashboard For Service Subscription Numbers Assessment Slides PDF, with topics curated by our researchers after extensive research. This editable presentation is available for immediate download and provides attractive features when used. Download now and captivate your audience. Presenting this Promotion Strategies For New Service Launch Dashboard For Service Subscription Numbers Assessment Slides PDF. Our researchers have carefully researched and created these slides with all aspects taken into consideration. This is a completely customizable Promotion Strategies For New Service Launch Dashboard For Service Subscription Numbers Assessment Slides PDF that is available for immediate downloading. Download now and make an impact on your audience. Highlight the attractive features available with our PPTs.
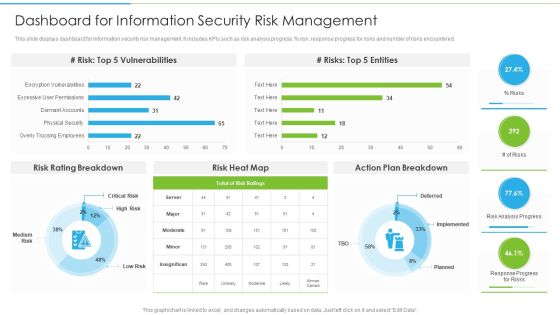
Ways To Accomplish ISO 27001 Accreditation Dashboard For Information Security Risk Management Clipart PDF
This slide displays dashboard for information security risk management. It includes KPIs such as risk analysis progress, percent risk, response progress for risks and number of risks encountered. Deliver an awe inspiring pitch with this creative Ways To Accomplish ISO 27001 Accreditation Dashboard For Information Security Risk Management Clipart PDF bundle. Topics like Risk Heat, Action Plan, Risk Rating Breakdown can be discussed with this completely editable template. It is available for immediate download depending on the needs and requirements of the user.

ISO 27001 Certification Procedure Dashboard For Information Security Risk Management Sample PDF
This slide displays dashboard for information security risk management. It includes KPIs such as risk analysis progress, persent risk, response progress for risks and number of risks encountered.Deliver an awe inspiring pitch with this creative ISO 27001 Certification Procedure Dashboard For Information Security Risk Management Sample PDF bundle. Topics like Vulnerabilities, Rating Breakdown, Plan Breakdown can be discussed with this completely editable template. It is available for immediate download depending on the needs and requirements of the user.
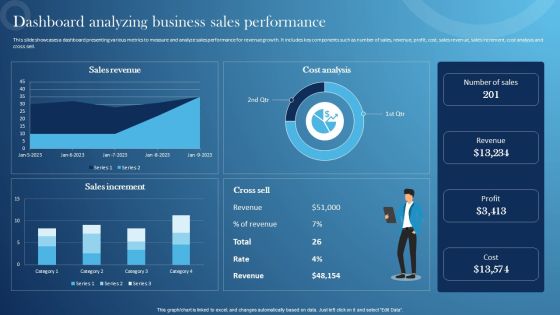
Inspecting Sales Optimization Areas Dashboard Analyzing Business Sales Performance Slides PDF
This slide showcases a dashboard presenting various metrics to measure and analyze sales performance for revenue growth. It includes key components such as number of sales, revenue, profit, cost, sales revenue, sales increment, cost analysis and cross sell. Create an editable Inspecting Sales Optimization Areas Dashboard Analyzing Business Sales Performance Slides PDF that communicates your idea and engages your audience. Whether youre presenting a business or an educational presentation, pre-designed presentation templates help save time. Inspecting Sales Optimization Areas Dashboard Analyzing Business Sales Performance Slides PDF is highly customizable and very easy to edit, covering many different styles from creative to business presentations. Slidegeeks has creative team members who have crafted amazing templates. So, go and get them without any delay.
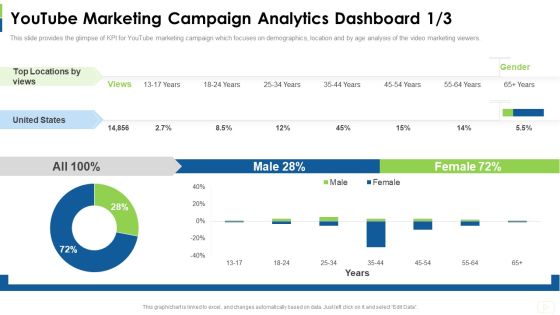
Social Platform As Profession Youtube Marketing Campaign Analytics Dashboard Age Themes PDF
This slide provides the glimpse of KPI for YouTube marketing campaign which focuses on demographics, location and by age analysis of the video marketing viewers. Deliver an awe inspiring pitch with this creative social platform as profession youtube marketing campaign analytics dashboard age themes pdf bundle. Topics like youtube marketing campaign analytics dashboard can be discussed with this completely editable template. It is available for immediate download depending on the needs and requirements of the user.
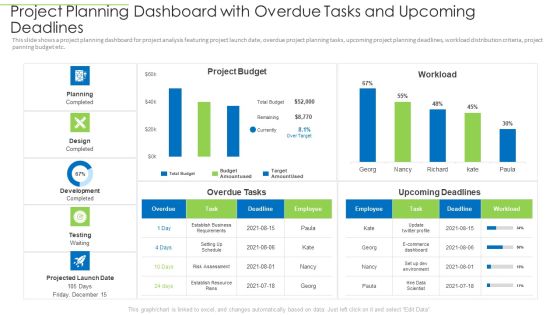
Project Planning Dashboard With Overdue Tasks And Upcoming Deadlines Sample PDF
This slide shows a project planning dashboard for project analysis featuring project launch date, overdue project planning tasks, upcoming project planning deadlines, workload distribution criteria, project panning budget etc. Deliver an awe inspiring pitch with this creative project planning dashboard with overdue tasks and upcoming deadlines sample pdf bundle. Topics like planning, design, development, testing, projected launch date can be discussed with this completely editable template. It is available for immediate download depending on the needs and requirements of the user.

Table Of Contents For Online Transformation With Agile Software Methodology It Dashboard Template PDF
Presenting table of contents for online transformation with agile software methodology it dashboard template pdf to provide visual cues and insights. Share and navigate important information on five stages that need your due attention. This template can be used to pitch topics like dashboard, management, development, budget analysis. In addtion, this PPT design contains high resolution images, graphics, etc, that are easily editable and available for immediate download.
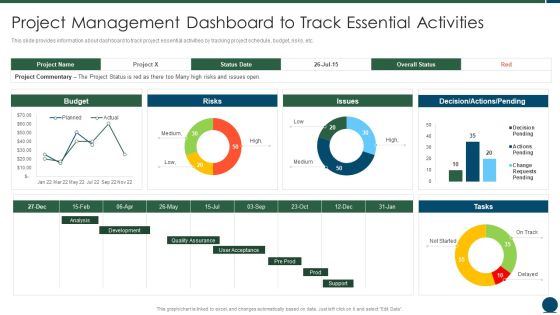
Project Scope Management Playbook Project Management Dashboard To Track Essential Activities Background PDF
This slide provides information about dashboard to track project essential activities by tracking project schedule, budget, risks, etc. Deliver an awe inspiring pitch with this creative Project Scope Management Playbook Project Management Dashboard To Track Essential Activities Background PDF bundle. Topics like Quality Assurance, Development, Analysis can be discussed with this completely editable template. It is available for immediate download depending on the needs and requirements of the user.

Fixed Asset Management Framework Implementation Fixed Asset Management Dashboard Demonstration PDF
This slide represents fixed asset management dashboard for tracking equipment performance. It includes work management, downtime, work orders etc.Deliver an awe inspiring pitch with this creative Fixed Asset Management Framework Implementation Fixed Asset Management Dashboard Demonstration PDF bundle. Topics like Labour Analysis, Purchasing Spend, Asset Details can be discussed with this completely editable template. It is available for immediate download depending on the needs and requirements of the user.

Project Team Engagement Tasks Project Management Dashboard To Track Essential Activities Demonstration PDF
This slide provides information about dashboard to track project essential activities by tracking project schedule, budget, risks, etc.Deliver an awe inspiring pitch with this creative Project Team Engagement Tasks Project Management Dashboard To Track Essential Activities Demonstration PDF bundle. Topics like Quality Assurance, Development, Analysis can be discussed with this completely editable template. It is available for immediate download depending on the needs and requirements of the user.
Insurance Claim Procedure Tracking Dashboard Ppt PowerPoint Presentation Show Samples PDF
This slide showcases the insurance claim process tracking dashboard. It includes elements such as claim amount, payout and denied claims and status analysis.Pitch your topic with ease and precision using this Insurance Claim Procedure Tracking Dashboard Ppt PowerPoint Presentation Show Samples PDF. This layout presents information on Amount Comparison, Claim Expense, Assured Amount. It is also available for immediate download and adjustment. So, changes can be made in the color, design, graphics or any other component to create a unique layout.

Dashboard For Analyzing Candidate Hiring Status Ppt PowerPoint Presentation File Tips PDF
This slide defines the analysis dashboard for candidate recruitment status. It includes information related to candidate pipeline, active candidates, inactive candidates and salary range. Showcasing this set of slides titled Dashboard For Analyzing Candidate Hiring Status Ppt PowerPoint Presentation File Tips PDF. The topics addressed in these templates are Candidates Pipeline, Active Candidates, Salary Range. All the content presented in this PPT design is completely editable. Download it and make adjustments in color, background, font etc. as per your unique business setting.

Automated Quality Control In Manufacturing Automated Dashboard For Inspecting Structure PDF
This slide showcases dashboard which can be used by QA managers in tracking defects. It provides details about total production, defective production, production rate, damaged, average cycle duration, test cycle, electrically defective, etc. Boost your pitch with our creative Automated Quality Control In Manufacturing Automated Dashboard For Inspecting Structure PDF. Deliver an awe inspiring pitch that will mesmerize everyone. Using these presentation templates you will surely catch everyones attention. You can browse the ppts collection on our website. We have researchers who are experts at creating the right content for the templates. So you do not have to invest time in any additional work. Just grab the template now and use them.

Sap Analytics Cloud Dashboard For Income Analysis And Forecasting Formats PDF
This slide illustrates the SAP Analytics Cloud dashboard for organization income analysis and forecasting. It provides information regarding multiple incomes such as interest, operating and trading income. It also contains details of operating expenses. The best PPT templates are a great way to save time, energy, and resources. Slidegeeks have 100 percent editable powerpoint slides making them incredibly versatile. With these quality presentation templates, you can create a captivating and memorable presentation by combining visually appealing slides and effectively communicating your message. Download Sap Analytics Cloud Dashboard To Asses Digital Marketing Campaigns Performance Ideas PDF from Slidegeeks and deliver a wonderful presentation.
Forecast Analysis Technique IT Predictive Modeling Model Performance Tracking Dashboard Brochure PDF
This slide represents the predictive analytics model performance tracking dashboard, and it covers the details of total visitors, total buyers, total products added to the cart, filters by date and category, visitors to clients conversion rate, and so on. There are so many reasons you need a Forecast Analysis Technique IT Predictive Modeling Model Performance Tracking Dashboard Brochure PDF. The first reason is you can not spend time making everything from scratch, Thus, Slidegeeks has made presentation templates for you too. You can easily download these templates from our website easily.

Lean Operational Excellence Strategy Manufacturing Dashboard To Check Production System Efficiency Pictures PDF
This slide showcases manufacturing dashboard to track KPIs defined under lean and kaizen process improvement plans. Key performance metrics included here are TEEP, OEE, loading time, production quality, losses by hours, losses by categories etc. Pitch your topic with ease and precision using this Lean Operational Excellence Strategy Manufacturing Dashboard To Check Production System Efficiency Pictures PDF. This layout presents information on Loading, Availability, Performance. It is also available for immediate download and adjustment. So, changes can be made in the color, design, graphics or any other component to create a unique layout.
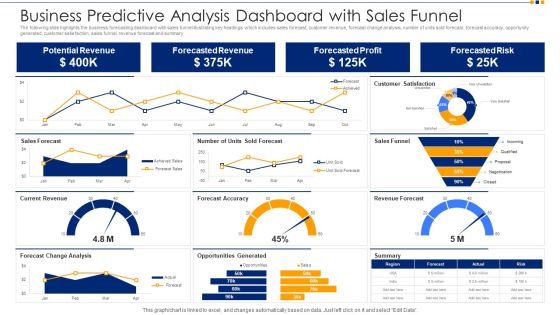
Business Predictive Analysis Dashboard With Sales Funnel Ppt Show Images PDF
The following slide highlights the business forecasting dashboard with sales funnel illustrating key headings which includes sales forecast, customer revenue, forecast change analysis, number of units sold forecast, forecast accuracy, opportunity generated, customer satisfaction, sales funnel, revenue forecast and summary. Pitch your topic with ease and precision using this business predictive analysis dashboard with sales funnel ppt show images pdf. This layout presents information on potential revenue, forecasted revenue, forecasted profit, forecasted risk. It is also available for immediate download and adjustment. So, changes can be made in the color, design, graphics or any other component to create a unique layout.

Financial Services Organization Monthly Sales Forecast Dashboard Ppt Summary Slideshow PDF
This slide shows the dashboard representing data related to monthly sales forecast of the organization offering financial services to its clients. It includes information related to forecasted data, sales forecast, total sales, forecast projection etc. Showcasing this set of slides titled Financial Services Organization Monthly Sales Forecast Dashboard Ppt Summary Slideshow PDF. The topics addressed in these templates are Forecasts Sales, Time Series View, Forecast Projection. All the content presented in this PPT design is completely editable. Download it and make adjustments in color, background, font etc. as per your unique business setting.

Real Time Website Traffic Analysis Dashboard Ppt Inspiration Graphics Download PDF
The following slide depicts real time website traffic analytical dashboard to monitor current events and plan actions accordingly. It includes elements such as traffic sources by location, device type, views per minute, visitor activity status etc. Are you searching for a Real Time Website Traffic Analysis Dashboard Ppt Inspiration Graphics Download PDF that is uncluttered, straightforward, and original Its easy to edit, and you can change the colors to suit your personal or business branding. For a presentation that expresses how much effort you have put in, this template is ideal With all of its features, including tables, diagrams, statistics, and lists, its perfect for a business plan presentation. Make your ideas more appealing with these professional slides. Download Real Time Website Traffic Analysis Dashboard Ppt Inspiration Graphics Download PDF from Slidegeeks today.

Financial Forecast And Essential Metrics Dashboard Showing Cash Management Designs PDF
This slide contains the projections of the company financials to predict the future position so that better decisions could be taken for the growth prospective. It also includes ratios, cash balance, inventory analysis , etc. Showcasing this set of slides titled Financial Forecast And Essential Metrics Dashboard Showing Cash Management Designs PDF. The topics addressed in these templates are Days Sales Outstanding, Cash Management Dashboard, Days Inventory Outstanding. All the content presented in this PPT design is completely editable. Download it and make adjustments in color, background, font etc. as per your unique business setting.

Real Estate Business Monthly Sales Forecast Dashboard Ppt Layouts Grid PDF
This slide represents the dashboard showing the data related to sales forecasting for the real estate business. It shows details related to the set target, sales targets won, open and forecasted and also shows the graph representing the sales pipeline for the year. Showcasing this set of slides titled Real Estate Business Monthly Sales Forecast Dashboard Ppt Layouts Grid PDF. The topics addressed in these templates are Next Billing Data, Pipeline, Current Fiscal Year. All the content presented in this PPT design is completely editable. Download it and make adjustments in color, background, font etc. as per your unique business setting.

Data Profiling Solutions Dashboard Indicating Row And Column Analysis Summary PDF
This slide illustrates data profiling dashboard indicating row and column analysis which can be referred by IT managers to manager to maintain quality and consistency of data. It contains information about reports, checking, evolution, overview, comparative, etc. Showcasing this set of slides titled Data Profiling Solutions Dashboard Indicating Row And Column Analysis Summary PDF. The topics addressed in these templates are Overview Analysis, Column Evaluation, Comparative Evaluation. All the content presented in this PPT design is completely editable. Download it and make adjustments in color, background, font etc. as per your unique business setting.
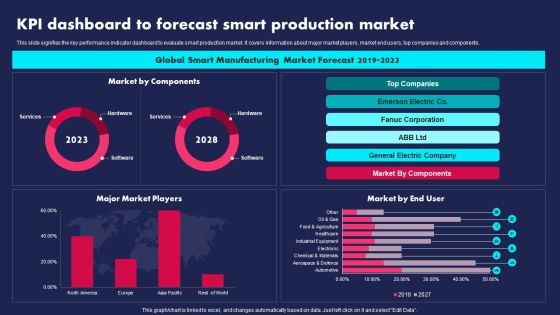
KPI Dashboard To Forecast Smart Production Market Ppt PowerPoint Presentation Gallery Visual Aids PDF
This slide signifies the key performance indicator dashboard to evaluate smart production market. It covers information about major market players, market end users, top companies and components. Pitch your topic with ease and precision using this KPI Dashboard To Forecast Smart Production Market Ppt PowerPoint Presentation Gallery Visual Aids PDF. This layout presents information on Global Smart Manufacturing, Market Forecast, 2019 To 2023. It is also available for immediate download and adjustment. So, changes can be made in the color, design, graphics or any other component to create a unique layout.

Company Process With Audit Plan Checklist Internal Audit Dashboard Structure PDF
Deliver an awe inspiring pitch with this creative company process with audit plan checklist internal audit dashboard structure pdf bundle. Topics like audits observations, remediated observations, observations by location can be discussed with this completely editable template. It is available for immediate download depending on the needs and requirements of the user.

Automobile Company Actual And Forecasted Monthly Sales Dashboard Ppt Infographic Template Aids PDF
This slide shows the dashboard for forecasting the sales of an automobile company for the current month. It represents details related to revenue by pipeline, new deals, sales forecast, revenue goal attainment by owner for the current month and pipeline coverage by next month. Showcasing this set of slides titled Automobile Company Actual And Forecasted Monthly Sales Dashboard Ppt Infographic Template Aids PDF. The topics addressed in these templates are Forecast Month, Revenue Goal Attainment, Revenue Goal Attainment. All the content presented in this PPT design is completely editable. Download it and make adjustments in color, background, font etc. as per your unique business setting.
Forecasting And Managing Consumer Attrition For Business Advantage Dashboard Customer Purchase Tracking Repeat Structure PDF
The firm is looking forward to track customer experience by tracking various touchpoints in order to handle issues such customer churn. KPIs mentioned in the dashboard are measured regularly across the organization. Deliver and pitch your topic in the best possible manner with this forecasting and managing consumer attrition for business advantage dashboard customer purchase tracking repeat structure pdf. Use them to share invaluable insights on total repeat sales after coupon, total repeat sales after reward, total cart value per month and impress your audience. This template can be altered and modified as per your expectations. So, grab it now.

Budget And Time Forecast Dashboard For Project Management Ppt Pictures Format Ideas PDF
This slide represents the dashboard for cost and time estimation of the organizational product which gives a clear view of the health, time, tasks, cost, progress rate and completion of project status to help the management to effectively estimate its success or failure and make changes accordingly. Pitch your topic with ease and precision using this Budget And Time Forecast Dashboard For Project Management Ppt Pictures Format Ideas PDF. This layout presents information on Health, Progress, Cost, Workload. It is also available for immediate download and adjustment. So, changes can be made in the color, design, graphics or any other component to create a unique layout.
Increasing Customer Dashboard For Tracking Aftersales Customer Services Team Ideas PDF
This slide covers the KPI dashboard for ticket tracking. It includes metrics such as tickets by month, service level, and details of customer service department agents. Are you searching for a Increasing Customer Dashboard For Tracking Aftersales Customer Services Team Ideas PDF that is uncluttered, straightforward, and original Its easy to edit, and you can change the colors to suit your personal or business branding. For a presentation that expresses how much effort youve put in, this template is ideal With all of its features, including tables, diagrams, statistics, and lists, its perfect for a business plan presentation. Make your ideas more appealing with these professional slides. Download Increasing Customer Dashboard For Tracking Aftersales Customer Services Team Ideas PDF from Slidegeeks today.
Marketers Guide To Data Analysis Optimization KPI Dashboard For Tracking Paid Ad Campaign Performance Clipart PDF
This slide covers the dashboard for analyzing paid search metrics such as ad cost, clicks, impressions, click-through rate, cost per conversion, conversion rate, cost per click, etc. Here you can discover an assortment of the finest PowerPoint and Google Slides templates. With these templates, you can create presentations for a variety of purposes while simultaneously providing your audience with an eye catching visual experience. Download Marketers Guide To Data Analysis Optimization KPI Dashboard For Tracking Paid Ad Campaign Performance Clipart PDF to deliver an impeccable presentation. These templates will make your job of preparing presentations much quicker, yet still, maintain a high level of quality. Slidegeeks has experienced researchers who prepare these templates and write high quality content for you. Later on, you can personalize the content by editing the Marketers Guide To Data Analysis Optimization KPI Dashboard For Tracking Paid Ad Campaign Performance Clipart PDF.
Development And Operations KPI Dashboard With Central Processing Unit Statistics Icons PDF
This slide covers devops KPI metrics dashboard with central processing unit statistics about input output statistics , network traffic volume under during recorded sessions. Further, this template includes numbers of sessions with waiting time.Showcasing this set of slides titled Development And Operations KPI Dashboard With Central Processing Unit Statistics Icons PDF The topics addressed in these templates are Central Processing, Output Statistics, Resource Limits All the content presented in this PPT design is completely editable. Download it and make adjustments in color, background, font etc. as per your unique business setting.

Marketers Guide To Data Analysis Optimization Social Media Analytics KPI Dashboard Clipart PDF
This slide covers a dashboard for tracking social media KPIs such as face engagements, total likes, followers, audience growth, YouTube subscribers, views, Instagram reach and , likes, LinkedIn impressions, etc. Find a pre designed and impeccable Marketers Guide To Data Analysis Optimization Social Media Analytics KPI Dashboard Clipart PDF. The templates can ace your presentation without additional effort. You can download these easy to edit presentation templates to make your presentation stand out from others. So, what are you waiting for Download the template from Slidegeeks today and give a unique touch to your presentation.
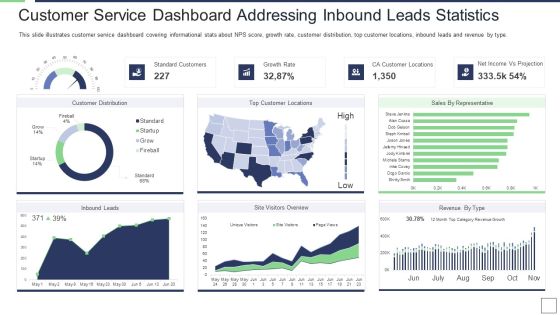
IT Service Incorporation And Administration Customer Service Dashboard Addressing Inbound Leads Statistics Clipart PDF
This slide illustrates customer service dashboard covering informational stats about NPS score, growth rate, customer distribution, top customer locations, inbound leads and revenue by type. Deliver an awe inspiring pitch with this creative it service incorporation and administration customer service dashboard addressing inbound leads statistics clipart pdf bundle. Topics like standard customers, growth rate, net income vs projection, ca customer locations can be discussed with this completely editable template. It is available for immediate download depending on the needs and requirements of the user.

Customer Acquisition Approaches To Enhance Organization Growth Acquisition Campaign Performance Analysis Dashboard Information PDF
This slide covers the SEM Search Engine Marketing dashboard with tracking KPIs such as lead form paid search, CAC, top performing campaigns, cost per conversion, cost per click, etc. If you are looking for a format to display your unique thoughts, then the professionally designed Customer Acquisition Approaches To Enhance Organization Growth Acquisition Campaign Performance Analysis Dashboard Information PDF is the one for you. You can use it as a Google Slides template or a PowerPoint template. Incorporate impressive visuals, symbols, images, and other charts. Modify or reorganize the text boxes as you desire. Experiment with shade schemes and font pairings. Alter, share or cooperate with other people on your work. Download Customer Acquisition Approaches To Enhance Organization Growth Acquisition Campaign Performance Analysis Dashboard Information PDF and find out how to give a successful presentation. Present a perfect display to your team and make your presentation unforgettable.

Acquisition Campaign Performance Analysis Dashboard Strategies For Acquiring Consumers Themes PDF
This slide covers the SEM Search Engine Marketing dashboard with tracking KPIs such as lead form paid search, CAC, top performing campaigns, cost per conversion, cost per click, etc. Crafting an eye-catching presentation has never been more straightforward. Let your presentation shine with this tasteful yet straightforward Acquisition Campaign Performance Analysis Dashboard Strategies For Acquiring Consumers Themes PDF template. It offers a minimalistic and classy look that is great for making a statement. The colors have been employed intelligently to add a bit of playfulness while still remaining professional. Construct the ideal Acquisition Campaign Performance Analysis Dashboard Strategies For Acquiring Consumers Themes PDF that effortlessly grabs the attention of your audience Begin now and be certain to wow your customers.
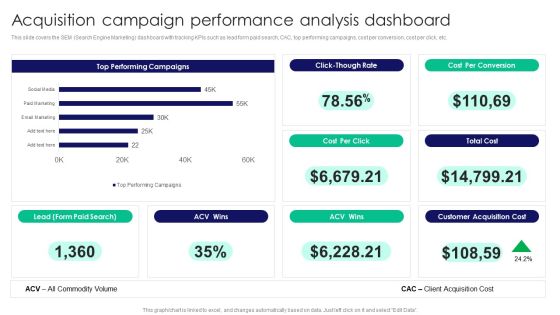
Guide To Business Customer Acquisition Acquisition Campaign Performance Analysis Dashboard Rules PDF
This slide covers the SEM Search Engine Marketing dashboard with tracking KPIs such as lead form paid search, CAC, top performing campaigns, cost per conversion, cost per click, etc. If you are looking for a format to display your unique thoughts, then the professionally designed Guide To Business Customer Acquisition Acquisition Campaign Performance Analysis Dashboard Rules PDF is the one for you. You can use it as a Google Slides template or a PowerPoint template. Incorporate impressive visuals, symbols, images, and other charts. Modify or reorganize the text boxes as you desire. Experiment with shade schemes and font pairings. Alter, share or cooperate with other people on your work. Download Guide To Business Customer Acquisition Acquisition Campaign Performance Analysis Dashboard Rules PDF and find out how to give a successful presentation. Present a perfect display to your team and make your presentation unforgettable.

CYBER Security Breache Response Strategy Enterprise Cyber Risk Management Dashboard Summary PDF
This slide represents the key metrics dashboard representing details related to management of cyber security incidents by an enterprise. It includes key performance indicators such as risk analysis progress, risk rating breakdown etc. Are you searching for a CYBER Security Breache Response Strategy Enterprise Cyber Risk Management Dashboard Summary PDF that is uncluttered, straightforward, and original Its easy to edit, and you can change the colors to suit your personal or business branding. For a presentation that expresses how much effort you have put in, this template is ideal. With all of its features, including tables, diagrams, statistics, and lists, its perfect for a business plan presentation. Make your ideas more appealing with these professional slides. Download CYBER Security Breache Response Strategy Enterprise Cyber Risk Management Dashboard Summary PDF from Slidegeeks today.

Cyber Protection Incident And Privacy Analysis With KPI Dashboard Ideas PDF
The following slide highlights some kpas of cyber security incidents to evaluate and monitor threats. It includes elements such as open incidents, warnings by severity, average response time, warnings pending for inspection etc. Showcasing this set of slides titled Cyber Protection Incident And Privacy Analysis With KPI Dashboard Ideas PDF. The topics addressed in these templates are Cyber Protection Incident, Privacy Analysis, KPI Dashboard. All the content presented in this PPT design is completely editable. Download it and make adjustments in color, background, font etc. as per your unique business setting.
Virtual WAN Architecture SD WAN Network Performance Tracking Dashboard Designs PDF
This slide represents the SD-WAN network performance tracking dashboard. The purpose of this slide is to demonstrate the performance of the SD-WAN network. The main components include control status, site health, transport interface distribution, WAN edge inventory, edge health, and so on. Crafting an eye-catching presentation has never been more straightforward. Let your presentation shine with this tasteful yet straightforward Virtual WAN Architecture SD WAN Network Performance Tracking Dashboard Designs PDF template. It offers a minimalistic and classy look that is great for making a statement. The colors have been employed intelligently to add a bit of playfulness while still remaining professional. Construct the ideal Virtual WAN Architecture SD WAN Network Performance Tracking Dashboard Designs PDF that effortlessly grabs the attention of your audience Begin now and be certain to wow your customers.

Steps To Conduct Competitor Analysis Competitor Email Campaign Analysis Dashboard Themes PDF
This slide showcases a dashboard for analyzing competitors top email campaigns to optimize own business promotional campaigns. It highlights elements such as campaign name, emails captured, web screenshots, yearly email send, days email send and hours of email send. Steps To Conduct Competitor Analysis Competitor Email Campaign Analysis Dashboard Themes PDF can be your best option for delivering a presentation. Represent everything in detail using Steps To Conduct Competitor Analysis Competitor Email Campaign Analysis Dashboard Themes PDF and make yourself stand out in meetings. The template is versatile and follows a structure that will cater to your requirements. All the templates prepared by Slidegeeks are easy to download and edit. Our research experts have taken care of the corporate themes as well. So, give it a try and see the results.

Steps To Conduct Competitor Analysis Domain And Ranking Analysis Seo Dashboard Topics PDF
This slide showcases a SEO dashboard for analyzing competitors domain and monitor changes in ranking. It highlights elements such as organic search, paid search, backlinks, display advertising, organic keywords and main organic competitors. Create an editable Steps To Conduct Competitor Analysis Domain And Ranking Analysis Seo Dashboard Topics PDF that communicates your idea and engages your audience. Whether you are presenting a business or an educational presentation, pre-designed presentation templates help save time. Steps To Conduct Competitor Analysis Domain And Ranking Analysis Seo Dashboard Topics PDF is highly customizable and very easy to edit, covering many different styles from creative to business presentations. Slidegeeks has creative team members who have crafted amazing templates. So, go and get them without any delay.

Steps To Conduct Competitor Analysis Organic Keywords Analysis Seo Dashboard Designs PDF
This slide showcases a SEO dashboard for analyzing competitors top ranking organic keywords. It highlights elements such as organic search, organic traffic, organic keywords, top keywords, top 10 competitors, country and traffic. Whether you have daily or monthly meetings, a brilliant presentation is necessary. Steps To Conduct Competitor Analysis Organic Keywords Analysis Seo Dashboard Designs PDF can be your best option for delivering a presentation. Represent everything in detail using Steps To Conduct Competitor Analysis Organic Keywords Analysis Seo Dashboard Designs PDF and make yourself stand out in meetings. The template is versatile and follows a structure that will cater to your requirements. All the templates prepared by Slidegeeks are easy to download and edit. Our research experts have taken care of the corporate themes as well. So, give it a try and see the results.

Analyzing Customer Demographics Through Performance KPI Dashboard Ppt PowerPoint Presentation File Model PDF
The following slide outlines key performance indicator KPI dashboard outlining customer demographics. Information covered in this slide is related to metrics such as gender, education level, technology adoption life cycle, and brand innovation consent. Are you searching for a Analyzing Customer Demographics Through Performance KPI Dashboard Ppt PowerPoint Presentation File Model PDF that is uncluttered, straightforward, and original Its easy to edit, and you can change the colors to suit your personal or business branding. For a presentation that expresses how much effort you have put in, this template is ideal. With all of its features, including tables, diagrams, statistics, and lists, its perfect for a business plan presentation. Make your ideas more appealing with these professional slides. Download Analyzing Customer Demographics Through Performance KPI Dashboard Ppt PowerPoint Presentation File Model PDF from Slidegeeks today.
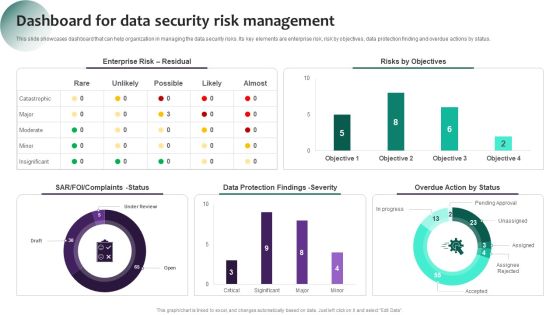
Information Systems Security And Risk Management Plan Dashboard For Data Security Risk Management Information PDF
This slide showcases dashboard that can help organization in managing the data security risks. Its key elements are enterprise risk, risk by objectives, data protection finding and overdue actions by status. If you are looking for a format to display your unique thoughts, then the professionally designed Information Systems Security And Risk Management Plan Dashboard For Data Security Risk Management Information PDF is the one for you. You can use it as a Google Slides template or a PowerPoint template. Incorporate impressive visuals, symbols, images, and other charts. Modify or reorganize the text boxes as you desire. Experiment with shade schemes and font pairings. Alter, share or cooperate with other people on your work. Download Information Systems Security And Risk Management Plan Dashboard For Data Security Risk Management Information PDF and find out how to give a successful presentation. Present a perfect display to your team and make your presentation unforgettable.

Action Plan To Enhance Client Service Customer Support Service Analysis Dashboard Graphics PDF
This slide exhibits customer service dashboard to improve visibility. The dashboard includes resolved and active cases, incoming cases by subject, priority, SLA status and age, CSAT and escalated case volume. The Action Plan To Enhance Client Service Customer Support Service Analysis Dashboard Graphics PDF is a compilation of the most recent design trends as a series of slides. It is suitable for any subject or industry presentation, containing attractive visuals and photo spots for businesses to clearly express their messages. This template contains a variety of slides for the user to input data, such as structures to contrast two elements, bullet points, and slides for written information. Slidegeeks is prepared to create an impression.

Business Revenue And Sales Predictive Dashboard Ppt Inspiration Background Designs PDF
The following slide highlights the business and sales forecasting dashboard illustrating key headings which includes revenue forecast by type, unit sold forecast, forecasting accuracy, sales by type, average sales price trend and revenue trend. Pitch your topic with ease and precision using this business revenue and sales predictive dashboard ppt inspiration background designs pdf. This layout presents information on revenue forecast by type, units sold forecast, forecasting accuracy, average sales price trend, revenue trend. It is also available for immediate download and adjustment. So, changes can be made in the color, design, graphics or any other component to create a unique layout.

Executing Video Promotional Performance KPI Dashboard To Analyze Instagram Marketing Download PDF
The following slide outlines KPI metrics dashboard of Instagram video marketing. The KPIs covered in the slide are followers, engagement, likes, comments, impressions, reach, video views and saves. Are you searching for a Executing Video Promotional Performance KPI Dashboard To Analyze Instagram Marketing Download PDF that is uncluttered, straightforward, and original Its easy to edit, and you can change the colors to suit your personal or business branding. For a presentation that expresses how much effort youve put in, this template is ideal With all of its features, including tables, diagrams, statistics, and lists, its perfect for a business plan presentation. Make your ideas more appealing with these professional slides. Download Executing Video Promotional Performance KPI Dashboard To Analyze Instagram Marketing Download PDF from Slidegeeks today.

Comprehensive Guide To Strengthen Brand Equity Brand Awareness Measuring KPI Dashboard Rules PDF
Following slide illustrates KPI dashboard that can be used to track the awareness level of a specific brand. KPIs covered in the slide are traffic, attention, authority, inbound channel performance etc. Are you searching for a Comprehensive Guide To Strengthen Brand Equity Brand Awareness Measuring KPI Dashboard Rules PDF that is uncluttered, straightforward, and original Its easy to edit, and you can change the colors to suit your personal or business branding. For a presentation that expresses how much effort you have put in, this template is ideal With all of its features, including tables, diagrams, statistics, and lists, its perfect for a business plan presentation. Make your ideas more appealing with these professional slides. Download Comprehensive Guide To Strengthen Brand Equity Brand Awareness Measuring KPI Dashboard Rules PDF from Slidegeeks today.

Consumer Statistics Dashboard Showing Sales Analysis By Month Ppt PowerPoint Presentation Icon Inspiration PDF
Presenting this set of slides with name consumer statistics dashboard showing sales analysis by month ppt powerpoint presentation icon inspiration pdf. The topics discussed in these slides are sales, analysis, growth. This is a completely editable PowerPoint presentation and is available for immediate download. Download now and impress your audience.

Dashboard For Statistical Analysis Of Product Sales Ppt PowerPoint Presentation Infographics Graphics Pictures PDF
Presenting this set of slides with name dashboard for statistical analysis of product sales ppt powerpoint presentation infographics graphics pictures pdf. The topics discussed in these slides are sales chart, product. This is a completely editable PowerPoint presentation and is available for immediate download. Download now and impress your audience.

5G Network Operations Performance Tracking Dashboard For 5G Architecture Demonstration PDF
This slide describes the performance tracking dashboard for 5G architecture by covering the details of subscribers, quality of experience, consumption, customer support, coverage, devices, and dimensions. Are you searching for a 5G Network Operations Performance Tracking Dashboard For 5G Architecture Demonstration PDF that is uncluttered, straightforward, and original. Its easy to edit, and you can change the colors to suit your personal or business branding. For a presentation that expresses how much effort youve put in, this template is ideal With all of its features, including tables, diagrams, statistics, and lists, its perfect for a business plan presentation. Make your ideas more appealing with these professional slides. Download 5G Network Operations Performance Tracking Dashboard For 5G Architecture Demonstration PDF from Slidegeeks today.
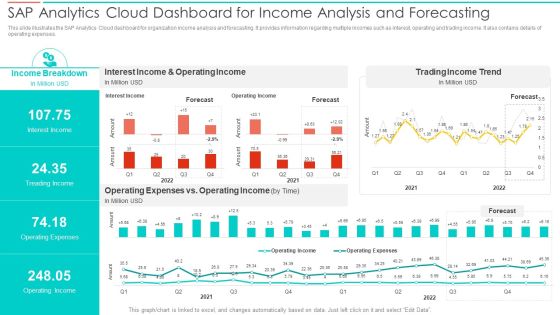
SAC Planning And Implementation SAP Analytics Cloud Dashboard For Income Analysis Summary PDF
This slide illustrates the SAP Analytics Cloud dashboard for organization income analysis and forecasting. It provides information regarding multiple incomes such as interest, operating and trading income. It also contains details of operating expenses. Deliver an awe inspiring pitch with this creative SAC Planning And Implementation SAP Analytics Cloud Dashboard For Income Analysis Summary PDF bundle. Topics like Income Breakdown, Interest Income, Operating Income, Trading Income Trend can be discussed with this completely editable template. It is available for immediate download depending on the needs and requirements of the user.

Kpi Metrics Dashboard To Measure Online Merchandising Strategy Effectiveness Retail Merchandising Techniques Sample PDF
The following slide outlines KPI metrics dashboard which can be used to measure the effectiveness of online marketing on retail store. The metrics covered in the slide are new orders, total income, expense, new users, best selling products, etc.Are you searching for a Kpi Metrics Dashboard To Measure Online Merchandising Strategy Effectiveness Retail Merchandising Techniques Sample PDF that is uncluttered, straightforward, and original Its easy to edit, and you can change the colors to suit your personal or business branding. For a presentation that expresses how much effort you ve put in, this template is ideal With all of its features, including tables, diagrams, statistics, and lists, its perfect for a business plan presentation. Make your ideas more appealing with these professional slides. Download Kpi Metrics Dashboard To Measure Online Merchandising Strategy Effectiveness Retail Merchandising Techniques Sample PDF from Slidegeeks today.

Product Marketing And Sales Expansion Through Channel KPI Dashboard To Track Channel Partner Strategy Diagrams PDF
This slide shows dashboard which can be used by organizations to measure the results of channel partner strategy. It includes metrics such as brand awareness, customer satisfaction rate, new customers acquired and market reach. Are you searching for a Product Marketing And Sales Expansion Through Channel KPI Dashboard To Track Channel Partner Strategy Diagrams PDF that is uncluttered, straightforward, and original Its easy to edit, and you can change the colors to suit your personal or business branding. For a presentation that expresses how much effort you have put in, this template is ideal. With all of its features, including tables, diagrams, statistics, and lists, its perfect for a business plan presentation. Make your ideas more appealing with these professional slides. Download Product Marketing And Sales Expansion Through Channel KPI Dashboard To Track Channel Partner Strategy Diagrams PDF from Slidegeeks today.

Dashboard For Tracking Digital Content Performance Consumer Contact Point Guide Summary PDF
This slide covers the KPI dashboard for analyzing online content. It includes metrics such as blog visitors, pageviews, newsletter conversion rate, new signups, new customers, etc. Are you searching for a Dashboard For Tracking Digital Content Performance Consumer Contact Point Guide Summary PDF that is uncluttered, straightforward, and original It is easy to edit, and you can change the colors to suit your personal or business branding. For a presentation that expresses how much effort you have put in, this template is ideal With all of its features, including tables, diagrams, statistics, and lists, it is perfect for a business plan presentation. Make your ideas more appealing with these professional slides. Download Dashboard For Tracking Digital Content Performance Consumer Contact Point Guide Summary PDF from Slidegeeks today.

HR Induction Program Dashboard Highlighting Training Cost And Active Employee Count Themes PDF
This slide highlights the HR induction program dashboard which includes weekly absenteeism rate, new hire count by gender, active employee count by region and age group and induction program cost. Are you searching for a HR Induction Program Dashboard Highlighting Training Cost And Active Employee Count Themes PDF that is uncluttered, straightforward, and original Its easy to edit, and you can change the colors to suit your personal or business branding. For a presentation that expresses how much effort you have put in, this template is ideal With all of its features, including tables, diagrams, statistics, and lists, its perfect for a business plan presentation. Make your ideas more appealing with these professional slides. Download HR Induction Program Dashboard Highlighting Training Cost And Active Employee Count Themes PDF from Slidegeeks today.

Comprehensive Guide To Enhance Kpi Dashboard To Monitor Sales Opportunities Information PDF
Mentioned slide shows the KPI dashboard that can be used to track win and lost sales opportunities. It includes metrics namely won opportunities, lost opportunities, pipeline by territory, total opportunities. Are you searching for a Comprehensive Guide To Enhance Kpi Dashboard To Monitor Sales Opportunities Information PDF that is uncluttered, straightforward, and original Its easy to edit, and you can change the colors to suit your personal or business branding. For a presentation that expresses how much effort youve put in, this template is ideal With all of its features, including tables, diagrams, statistics, and lists, its perfect for a business plan presentation. Make your ideas more appealing with these professional slides. Download Comprehensive Guide To Enhance Kpi Dashboard To Monitor Sales Opportunities Information PDF from Slidegeeks today.

Guide Digital Advertising Optimize Lead Targeting Email Promotion Campaign Dashboard For Performance Sample PDF
This slide represents website promotion dashboard. It covers total visits, average session duration, bounce rate, page views etc. Are you searching for a Guide Digital Advertising Optimize Lead Targeting Email Promotion Campaign Dashboard For Performance Sample PDF that is uncluttered, straightforward, and original Its easy to edit, and you can change the colors to suit your personal or business branding. For a presentation that expresses how much effort you have put in, this template is ideal. With all of its features, including tables, diagrams, statistics, and lists, its perfect for a business plan presentation. Make your ideas more appealing with these professional slides. Download Guide Digital Advertising Optimize Lead Targeting Email Promotion Campaign Dashboard For Performance Sample PDF from Slidegeeks today.
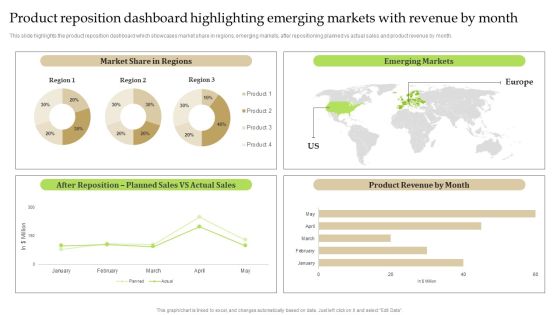
Product Reposition Dashboard Highlighting Emerging Markets With Revenue By Month Brochure PDF
This slide highlights the product reposition dashboard which showcases market share in regions, emerging markets, after repositioning planned vs actual sales and product revenue by month. Are you searching for a Product Reposition Dashboard Highlighting Emerging Markets With Revenue By Month Brochure PDF that is uncluttered, straightforward, and original Its easy to edit, and you can change the colors to suit your personal or business branding. For a presentation that expresses how much effort you have put in, this template is ideal. With all of its features, including tables, diagrams, statistics, and lists, its perfect for a business plan presentation. Make your ideas more appealing with these professional slides. Download Product Reposition Dashboard Highlighting Emerging Markets With Revenue By Month Brochure PDF from Slidegeeks today.

Go Viral Campaign Strategies To Increase Engagement Social Media Analytics Dashboard Track Viral Graphics PDF
This slides showcases social media analytics dashboard to track viral keywords. It provides details about daily volume, keyword searches, keyword volume, etc. which can effectively guide digital marketers to craft potential campaigns Are you searching for a Go Viral Campaign Strategies To Increase Engagement Social Media Analytics Dashboard Track Viral Graphics PDF that is uncluttered, straightforward, and original Its easy to edit, and you can change the colors to suit your personal or business branding. For a presentation that expresses how much effort you have put in, this template is ideal. With all of its features, including tables, diagrams, statistics, and lists, its perfect for a business plan presentation. Make your ideas more appealing with these professional slides. Download Go Viral Campaign Strategies To Increase Engagement Social Media Analytics Dashboard Track Viral Graphics PDF from Slidegeeks today.
