Success Metrics

Measure Lead Conversion Rate With Its Impact Ppt Portfolio Example PDF
The following slide covers the conversion rate metrics to compare and contrast performance. It includes elements such as description, affecting factors, preference, impact, strategies, formula etc. to get more value from customers. The best PPT templates are a great way to save time, energy, and resources. Slidegeeks have 100 percent editable powerpoint slides making them incredibly versatile. With these quality presentation templates, you can create a captivating and memorable presentation by combining visually appealing slides and effectively communicating your message. Download Measure Lead Conversion Rate With Its Impact Ppt Portfolio Example PDF from Slidegeeks and deliver a wonderful presentation.
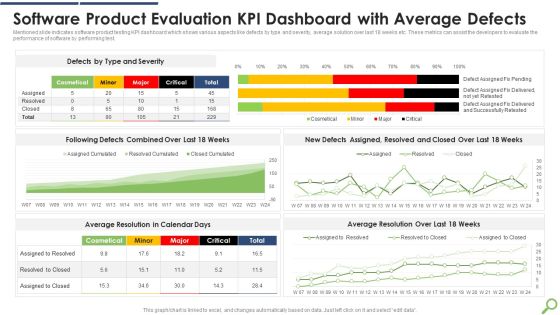
Software Product Evaluation KPI Dashboard With Average Defects Infographics PDF
Mentioned slide indicates software product testing KPI dashboard which shows various aspects like defects by type and severity, average solution over last 18 weeks etc. These metrics can assist the developers to evaluate the performance of software by performing test.Showcasing this set of slides titled Software Product Evaluation KPI Dashboard With Average Defects Infographics PDF The topics addressed in these templates are Software Product, Evaluation Dashboard, Average Defects All the content presented in this PPT design is completely editable. Download it and make adjustments in color, background, font etc. as per your unique business setting.
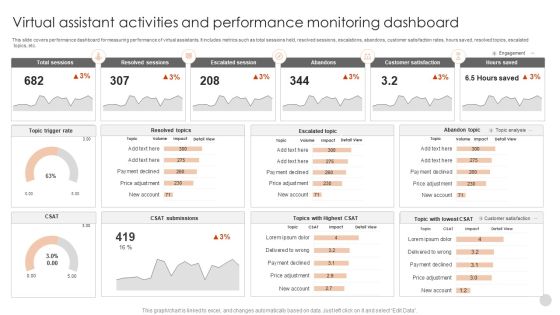
Virtual Assistant Activities And Performance Monitoring Dashboard Guidelines PDF
This slide covers performance dashboard for measuring performance of virtual assistants. It includes metrics such as total sessions held, resolved sessions, escalations, abandons, customer satisfaction rates, hours saved, resolved topics, escalated topics, etc.Pitch your topic with ease and precision using this Virtual Assistant Activities And Performance Monitoring Dashboard Guidelines PDF. This layout presents information on Total Sessions, Resolved Sessions, Escalated Session. It is also available for immediate download and adjustment. So, changes can be made in the color, design, graphics or any other component to create a unique layout.

Merchant Performance Report With Rating And Status Diagrams PDF
The purpose of this slide is to measure the performance and effectiveness of vendors and suppliers who provides goods or services to the company. Certain metrics include quality, delivery, cost, local factors, and order count. Showcasing this set of slides titled Merchant Performance Report With Rating And Status Diagrams PDF. The topics addressed in these templates are Merchant Performance Report, Rating And Status. All the content presented in this PPT design is completely editable. Download it and make adjustments in color, background, font etc. as per your unique business setting.
Online Ad Campaign Performance Tracking Dashboard Demonstration PDF
This slide covers the KPI dashboard for measuring digital campaign results. It includes metrics such as Ad cost, clicks, impressions, CTR, cost per click, conversions, conversion rate, cost per click, cost per thousand impressions, etc. Deliver and pitch your topic in the best possible manner with this Online Ad Campaign Performance Tracking Dashboard Demonstration PDF. Use them to share invaluable insights on Online Ad Campaign Performance, Tracking Dashboard and impress your audience. This template can be altered and modified as per your expectations. So, grab it now.
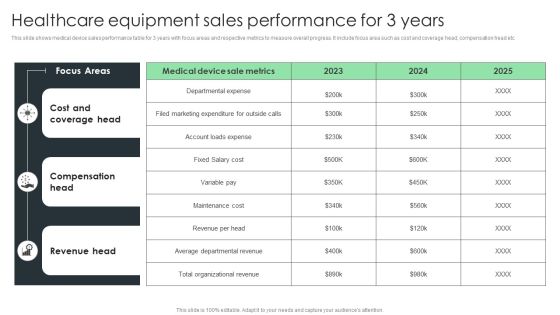
Healthcare Equipment Sales Performance For 3 Years Sample PDF
This slide shows medical device sales performance table for 3 years with focus areas and respective metrics to measure overall progress. It include focus area such as cost and coverage head, compensation head etc. Showcasing this set of slides titled Healthcare Equipment Sales Performance For 3 Years Sample PDF. The topics addressed in these templates are Cost Coverage Head, Compensation Head, Revenue Head. All the content presented in this PPT design is completely editable. Download it and make adjustments in color, background, font etc. as per your unique business setting.
Monthly Sales Performance Tracking And Monitoring Dashboard Diagrams PDF
This slide showcases a dashboard presenting various metrics to measure and analyze sales performance for revenue growth. It includes key components such as number of sales, revenue, profit, cost, sales revenue, sales increment, cost analysis and cross sell. Make sure to capture your audiences attention in your business displays with our gratis customizable Monthly Sales Performance Tracking And Monitoring Dashboard Diagrams PDF. These are great for business strategies, office conferences, capital raising or task suggestions. If you desire to acquire more customers for your tech business and ensure they stay satisfied, create your own sales presentation with these plain slides.
Monthly Sales Performance Tracking And Monitoring Dashboard Designs PDF
This slide showcases a dashboard presenting various metrics to measure and analyze sales performance for revenue growth. It includes key components such as number of sales, revenue, profit, cost, sales revenue, sales increment, cost analysis and cross sell. Make sure to capture your audiences attention in your business displays with our gratis customizable Monthly Sales Performance Tracking And Monitoring Dashboard Designs PDF. These are great for business strategies, office conferences, capital raising or task suggestions. If you desire to acquire more customers for your tech business and ensure they stay satisfied, create your own sales presentation with these plain slides.

E Mail Marketing Performance Goals Achieved Survey Analysis Sample PDF
The purpose of this slide is to illustrate the survey outcomes in order to measure the effectiveness of e-mail campaigns. Certain metrics include an increase in ROI, conversions, list growth, etc. Pitch your topic with ease and precision using this E Mail Marketing Performance Goals Achieved Survey Analysis Sample PDF. This layout presents information on E Mail Marketing Performance, Goals Achieved Survey Analysis. It is also available for immediate download and adjustment. So, changes can be made in the color, design, graphics or any other component to create a unique layout.
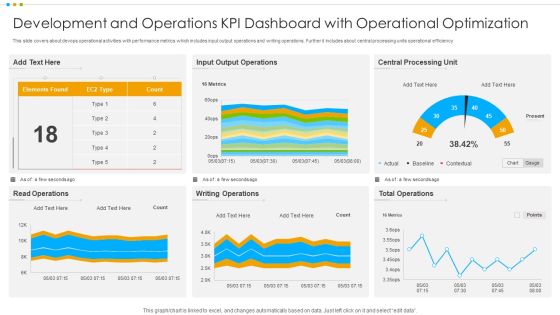
Development And Operations KPI Dashboard With Operational Optimization Pictures PDF
This slide covers about devops operational activities with performance metrics which includes input output operations and writing operations. Further it includes about central processing units operational efficiency.Pitch your topic with ease and precision using this Development And Operations KPI Dashboard With Operational Optimization Pictures PDF This layout presents information on Output Operations, Central Processing, Total Operations It is also available for immediate download and adjustment. So, changes can be made in the color, design, graphics or any other component to create a unique layout.

Go To Market Approach For New Product KPI Dashboard To Monitor Sales Performance Clipart PDF
This slide shows sales performance monitoring dashboard. Metrics included in the dashboard are sales revenue, sales growth, average revenue per unit, customer lifetime value and customer acquisition cost.Deliver and pitch your topic in the best possible manner with this Go To Market Approach For New Product KPI Dashboard To Monitor Sales Performance Clipart PDF Use them to share invaluable insights on Kpi Dashboard To Monitor Sales Performance and impress your audience. This template can be altered and modified as per your expectations. So, grab it now.

New Product Sales Strategy And Marketing KPI Dashboard To Monitor Sales Performance Information PDF
This slide shows sales performance monitoring dashboard. Metrics included in the dashboard are sales revenue, sales growth, average revenue per unit, customer lifetime value and customer acquisition cost. Deliver an awe inspiring pitch with this creative New Product Sales Strategy And Marketing KPI Dashboard To Monitor Sales Performance Information PDF bundle. Topics like Sales Revenue, Monthly Sales Growth, Sales Country Performance can be discussed with this completely editable template. It is available for immediate download depending on the needs and requirements of the user.

Offline Marketing Techniques To Elevate Brand Visibility Organization Performance Analysis Background PDF
This slide shows various KPIs which can be used organizations to evaluate annual marketing performance. It includes metrics such as brand awareness, website traffic, click through rate, lead conversion rate, etc. This Offline Marketing Techniques To Elevate Brand Visibility Organization Performance Analysis Background PDF is perfect for any presentation, be it in front of clients or colleagues. It is a versatile and stylish solution for organizing your meetings. The product features a modern design for your presentation meetings. The adjustable and customizable slides provide unlimited possibilities for acing up your presentation. Slidegeeks has done all the homework before launching the product for you. So, do not wait, grab the presentation templates today

KPI Dashboard To Monitor Beauty Care Products Sales Performance Ppt Outline Example Topics PDF
This slide shows the key performance indicators dashboard which can be used to analyze current financial position of cosmetic business. It includes metrics such as sales, expenses, profit, cash in hand, etc. Showcasing this set of slides titled KPI Dashboard To Monitor Beauty Care Products Sales Performance Ppt Outline Example Topics PDF. The topics addressed in these templates are Accounts Receivable, Profit Margin, Expense. All the content presented in this PPT design is completely editable. Download it and make adjustments in color, background, font etc. as per your unique business setting.

KPI Dashboard To Track Beauty Care Products Sales Performance Ppt Outline Pictures PDF
This slide shows the key performance indicators dashboard which can be used to analyze current financial position of cosmetic business. It includes metrics such as sales, expenses, profit, cash in hand, etc. Showcasing this set of slides titled KPI Dashboard To Track Beauty Care Products Sales Performance Ppt Outline Pictures PDF. The topics addressed in these templates are Sales Number, Total Sales, Total Profit, Cost. All the content presented in this PPT design is completely editable. Download it and make adjustments in color, background, font etc. as per your unique business setting.
Project Performance Dashboard With Tracking And Control Phase Background PDF
Following slide exhibits project performance dashboard with monitoring and control phase which can be used by project managers to review the overall project. It includes metrics like project cost performance, project performance, time vs project phase and percentage of project phase completed. Pitch your topic with ease and precision using this Project Performance Dashboard With Tracking And Control Phase Background PDF This layout presents information on Earned Value, Project Cost Performance, Project Performance. It is also available for immediate download and adjustment. So, changes can be made in the color, design, graphics or any other component to create a unique layout.

Agile Methodologies Team Performance Measurement After Agile Implementation Infographics Ppt Infographic Template Ideas PDF
This slide shows team iteration metrics for the measurement of team performance based on parameters such as actual and planned velocity, planned and accepted stories, number of defects and test cases, percentage of automated tests etc. Deliver an awe inspiring pitch with this creative agile methodologies team performance measurement after agile implementation infographics ppt infographic template ideas pdf bundle. Topics like Team Performance Measurement After Agile Implementation can be discussed with this completely editable template. It is available for immediate download depending on the needs and requirements of the user.

Matrix To Measurement Brand Performance For Small And Medium Business Introduction PDF
Mentioned slide highlights matrix which can be used by enterprise to measure brand performance. It provides information about key stakeholders and brand promises. The metrics covered in the slide are employee satisfaction, tools availability, response quality, response time etc. Pitch your topic with ease and precision using this matrix to measurement brand performance for small and medium business introduction pdf. This layout presents information on matrix to measurement brand performance for small and medium business. It is also available for immediate download and adjustment. So, changes can be made in the color, design, graphics or any other component to create a unique layout.

IT Service Incorporation And Administration Dashboard To Measure Business Performance Portrait PDF
Mentioned slide portrays a dashboard for measuring business performance. Performance metrics covered in the slide are average weekly sales revenue, average revenue per unit, customer lifetime value and customer acquisition cost. Deliver and pitch your topic in the best possible manner with this it service incorporation and administration dashboard to measure business performance portrait pdf. Use them to share invaluable insights on sales, revenue, target, acquisition cost and impress your audience. This template can be altered and modified as per your expectations. So, grab it now.
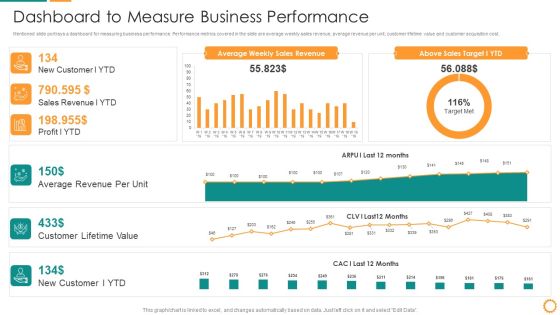
IT Consolidation Post Mergers And Acquisition Dashboard To Measure Business Performance Clipart PDF
Mentioned slide portrays a dashboard for measuring business performance. Performance metrics covered in the slide are average weekly sales revenue, average revenue per unit, customer lifetime value and customer acquisition cost. Deliver and pitch your topic in the best possible manner with this IT Consolidation Post Mergers And Acquisition Dashboard To Measure Business Performance Clipart PDF. Use them to share invaluable insights on Average Revenue, Customer Lifetime Value, Sales Revenue, Sales Target and impress your audience. This template can be altered and modified as per your expectations. So, grab it now.
Employee Performance Analysis Tracking Scorecard Ppt Summary Influencers PDF
This slide covers overall performance score of employee appraised by reporting manager. It includes scores based on metrics such as departmental performance, downtime, efficiency, setup, utilization, quality failures as per goals, actual output etc. Showcasing this set of slides titled Employee Performance Analysis Tracking Scorecard Ppt Summary Influencers PDF. The topics addressed in these templates are Employee Performance Card, Actual Performance, Goal. All the content presented in this PPT design is completely editable. Download it and make adjustments in color, background, font etc. as per your unique business setting.

Dashboard To Measure Performance Of E Commerce Marketing Strategies Structure PDF
This following slide displays the key metrics that can help an organization to measure effectiveness of e-commerce strategies. These can be revenue generated using e-commerce platform, conversion rates etc.Create an editable Dashboard To Measure Performance Of E Commerce Marketing Strategies Structure PDF that communicates your idea and engages your audience. Whether you are presenting a business or an educational presentation, pre-designed presentation templates help save time. Dashboard To Measure Performance Of E Commerce Marketing Strategies Structure PDF is highly customizable and very easy to edit, covering many different styles from creative to business presentations. Slidegeeks has creative team members who have crafted amazing templates. So, go and get them without any delay.

Analytics Dashboard To Evaluate Digital Marketing Performance Mockup PDF
The purpose of this slide is to exhibits a dashboard which can be used to examine the marketing performance. The metrics covered in the dashboard are bounce rate, page views, new sessions, total time spent on site, email marketing performance etc. Showcasing this set of slides titled Analytics Dashboard To Evaluate Digital Marketing Performance Mockup PDF. The topics addressed in these templates are Conversion Funnel, Target, Marketing Performance. All the content presented in this PPT design is completely editable. Download it and make adjustments in color, background, font etc. as per your unique business setting.

Digital Performance In Shared Business Services Back Office Functions Formats PDF
Following slide provides information regarding performance measure utilized by organizations for various back office function which benefits them to drive better productivity and efficiency. Share service center, digital performance metrics and key highlights are demonstrated in this slide. Pitch your topic with ease and precision using this Digital Performance In Shared Business Services Back Office Functions Formats PDF. This layout presents information on Volume Productivity, Service, Maturity. It is also available for immediate download and adjustment. So, changes can be made in the color, design, graphics or any other component to create a unique layout.

Content Marketing Campaign Performance Measuring Scorecard Social Media Content Icons PDF
This slide illustrates the scorecard that is being used by the organization to measure the performance of content marketing campaign. Major metrics covered are related to brand and lead.Want to ace your presentation in front of a live audience Our Content Marketing Campaign Performance Measuring Scorecard Social Media Content Icons PDF can help you do that by engaging all the users towards you. Slidegeeks experts have put their efforts and expertise into creating these impeccable powerpoint presentations so that you can communicate your ideas clearly. Moreover, all the templates are customizable, and easytoedit and downloadable. Use these for both personal and commercial use.

Developing Content Marketing Defining Content Marketing Goals And Objectives Inspiration PDF
This slide represents content marketing goals, objectives, strategies and metrics to measure performance across customer lifecycle stages such as reach, act and convert. Present like a pro with Developing Content Marketing Defining Content Marketing Goals And Objectives Inspiration PDF Create beautiful presentations together with your team, using our easy-to-use presentation slides. Share your ideas in real-time and make changes on the fly by downloading our templates. So whether youre in the office, on the go, or in a remote location, you can stay in sync with your team and present your ideas with confidence. With Slidegeeks presentation got a whole lot easier. Grab these presentations today.
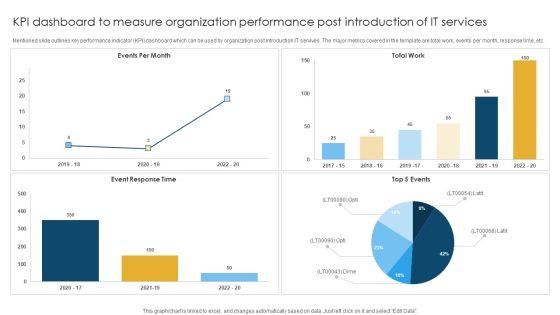
KPI Dashboard To Measure Organization Performance Post Introduction Of IT Services Rules PDF
Mentioned slide outlines key performance indicator KPI dashboard which can be used by organization post introduction IT servives. The major metrics covered in the template are total work, events per month, response time, etc. Showcasing this set of slides titled KPI Dashboard To Measure Organization Performance Post Introduction Of IT Services Rules PDF. The topics addressed in these templates are Event Response, Total Work, Events Per. All the content presented in this PPT design is completely editable. Download it and make adjustments in color, background, font etc. as per your unique business setting.
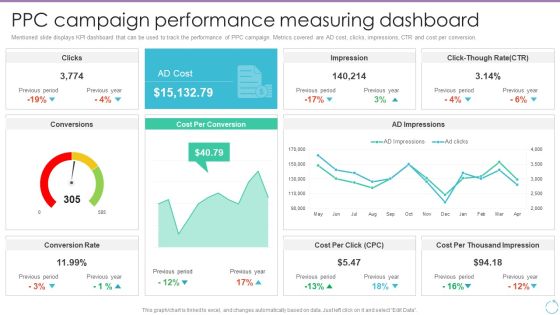
Personal Branding Plan For Executives Ppc Campaign Performance Measuring Download PDF
Mentioned slide displays KPI dashboard that can be used to track the performance of PPC campaign. Metrics covered are AD cost, clicks, impressions, CTR and cost per conversion. Take your projects to the next level with our ultimate collection of Personal Branding Plan For Executives Ppc Campaign Performance Measuring Download PDF. Slidegeeks has designed a range of layouts that are perfect for representing task or activity duration, keeping track of all your deadlines at a glance. Tailor these designs to your exact needs and give them a truly corporate look with your own brand colors theyll make your projects stand out from the rest.
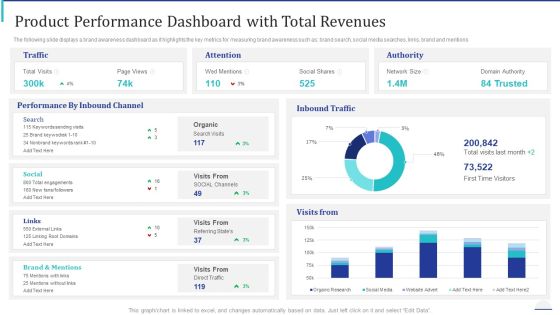
How Make Impactful Product Marketing Message Build Product Differentiation Product Performance Dashboard With Total Revenues Information PDF
The following slide displays a brand awareness dashboard as it highlights the key metrics for measuring brand awareness such as brand search, social media searches, links, brand and mentions. Deliver and pitch your topic in the best possible manner with this how make impactful product marketing message build product differentiation product performance dashboard with total revenues information pdf. Use them to share invaluable insights on social, organic, performance, traffic and impress your audience. This template can be altered and modified as per your expectations. So, grab it now.
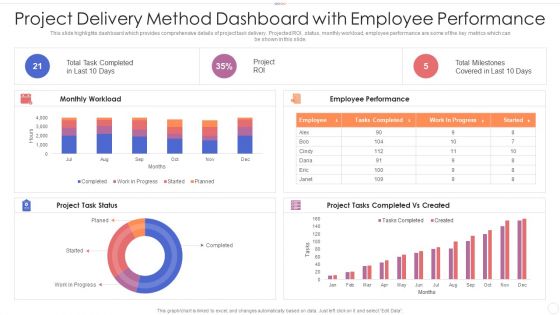
Project Delivery Method Dashboard With Employee Performance Introduction PDF
This slide highlights dashboard which provides comprehensive details of project task delivery. Projected ROI, status, monthly workload, employee performance are some of the key metrics which can be shown in this slide. Showcasing this set of slides titled project delivery method dashboard with employee performance introduction pdf. The topics addressed in these templates are project delivery method dashboard with employee performance. All the content presented in this PPT design is completely editable. Download it and make adjustments in color, background, font etc. as per your unique business setting.
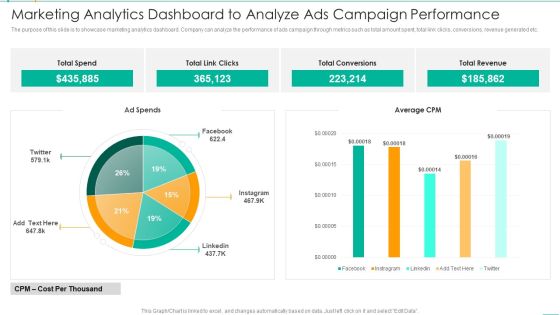
Marketing Analytics Dashboard To Analyze Ads Campaign Performance Microsoft PDF
The purpose of this slide is to showcase marketing analytics dashboard. Company can analyze the performance of ads campaign through metrics such as total amount spent, total link clicks, conversions, revenue generated etc. Showcasing this set of slides titled Marketing Analytics Dashboard To Analyze Ads Campaign Performance Microsoft PDF. The topics addressed in these templates are Marketing Analytics Dashboard To Analyze Ads Campaign Performance. All the content presented in this PPT design is completely editable. Download it and make adjustments in color, background, font etc. as per your unique business setting.
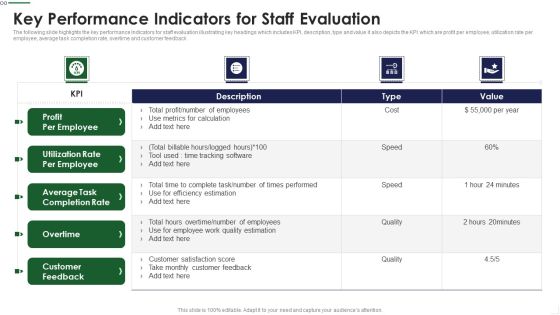
Key Performance Indicators For Staff Evaluation Infographics PDF
The following slide highlights the key performance Indicators for staff evaluation illustrating key headings which includes KPI, description, type and value it also depicts the KPI which are profit per employee, utilization rate per employee, average task completion rate, overtime and customer feedback Showcasing this set of slides titled Key Performance Indicators For Staff Evaluation Infographics PDF The topics addressed in these templates are Metrics Calculation, Times Performed, Customer Satisfaction All the content presented in this PPT design is completely editable. Download it and make adjustments in color, background, font etc. as per your unique business setting.
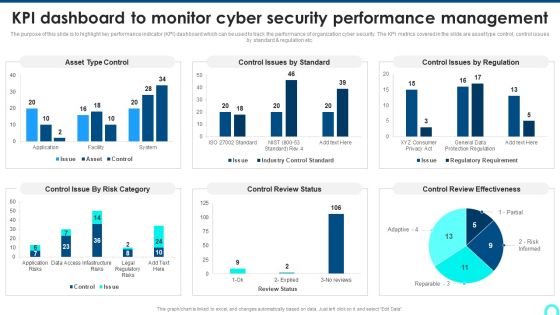
KPI Dashboard To Monitor Cyber Security Performance Management Background PDF
The purpose of this slide is to highlight key performance indicator KPI dashboard which can be used to track the performance of organization cyber security. The KPI metrics covered in the slide are asset type control, control issues by standard and regulation etc.Deliver and pitch your topic in the best possible manner with this KPI Dashboard To Monitor Cyber Security Performance Management Background PDF. Use them to share invaluable insights on Control Issue, Control Review, Review Effectiveness and impress your audience. This template can be altered and modified as per your expectations. So, grab it now.

Dashboard For Tracking Customer Service Team Performance Clipart PDF
This slide covers the KPI dashboard for analyzing the performance of client support department. It includes metrics such as first call resolution, unresolved calls, average response rate, the best day to call, average time to solve issues, etc. Deliver an awe inspiring pitch with this creative Dashboard For Tracking Customer Service Team Performance Clipart PDF bundle. Topics like Dashboard For Tracking Customer, Service Team Performance can be discussed with this completely editable template. It is available for immediate download depending on the needs and requirements of the user.

Dashboard For Tracking Customer Service Team Performance Information PDF
This slide covers the KPI dashboard for analyzing the performance of client support department. It includes metrics such as first call resolution, unresolved calls, average response rate, the best day to call, average time to solve issues, etc. Deliver an awe inspiring pitch with this creative Dashboard For Tracking Customer Service Team Performance Information PDF bundle. Topics like Dashboard For Tracking Customer, Service Team Performance can be discussed with this completely editable template. It is available for immediate download depending on the needs and requirements of the user.

Comparative Matrix Of Actual And Projected Financial Performance Brochure PDF
This slide shows matrix which can be used to compare actual and expected financial performance of an organization. It covers metrics such as gross profit margin, net profit margin, working capital, etc. Pitch your topic with ease and precision using this Comparative Matrix Of Actual And Projected Financial Performance Brochure PDF. This layout presents information on Comparative Matrix Actual, Projected Financial Performance. It is also available for immediate download and adjustment. So, changes can be made in the color, design, graphics or any other component to create a unique layout.
Google Adwords Strategic Campaign Performance Tracking Dashboard Icons PDF
This slide showcases KPI dashboard for real time tracking of performance metrics for google adwords campaign. It includes elements such as cost interactions, impressions, device, etc. Showcasing this set of slides titled Google Adwords Strategic Campaign Performance Tracking Dashboard Icons PDF. The topics addressed in these templates are Campaign Performance Device, Interaction Rate Cost Device, Daily Cost Device. All the content presented in this PPT design is completely editable. Download it and make adjustments in color, background, font etc. as per your unique business setting.

Website Analytics Dashboard To Track Business Performance Guidelines PDF
This slide exhibits visual report to track web performance metrics such as bounce rates, conversion rate, etc. It focuses on visualizing how effectively any website is converting traffic. It involves information related to number of users, page visitors, etc. Pitch your topic with ease and precision using this Website Analytics Dashboard To Track Business Performance Guidelines PDF. This layout presents information on Website Analytics, Dashboard To Track, Business Performance. It is also available for immediate download and adjustment. So, changes can be made in the color, design, graphics or any other component to create a unique layout.

Analyzing Impact On Performance Of Warehouse Operation Graphics PDF
This slide analyzes the operations management efficiency of the warehouse. It assesses the performance of metrics including, receiving, put-away, pick-n-pack, shipping, inventory and order management. From laying roadmaps to briefing everything in detail, our templates are perfect for you. You can set the stage with your presentation slides. All you have to do is download these easy-to-edit and customizable templates. Analyzing Impact On Performance Of Warehouse Operation Graphics PDF will help you deliver an outstanding performance that everyone would remember and praise you for. Do download this presentation today.
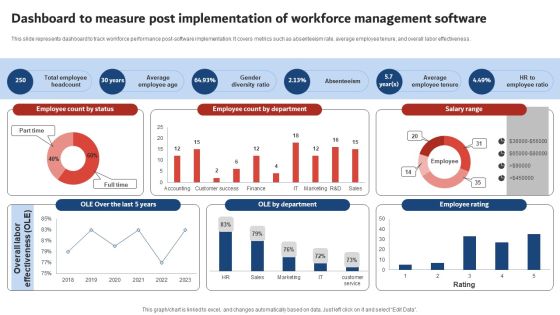
Dashboard To Measure Post Implementation Of Workforce Management Software Designs PDF
This slide represents dashboard to track workforce performance post-software implementation. It covers metrics such as absenteeism rate, average employee tenure, and overall labor effectiveness. Find a pre designed and impeccable Dashboard To Measure Post Implementation Of Workforce Management Software Designs PDF. The templates can ace your presentation without additional effort. You can download these easy to edit presentation templates to make your presentation stand out from others. So, what are you waiting for Download the template from Slidegeeks today and give a unique touch to your presentation.

Business Performance Review With Target Actual Results And Future Goals Professional PDF
This slide shows organizational review covering set targets of past year, measuring present performance and deciding future goals on basis of metrics . It includes cost of goods sold, production target, projected customer demand, quarterly sales, monthly new leads, scrap reduction target and customer engagement rate. Showcasing this set of slides titled Business Performance Review With Target Actual Results And Future Goals Professional PDF. The topics addressed in these templates are Previous Target, Projected Customer Demand, Production Target. All the content presented in this PPT design is completely editable. Download it and make adjustments in color, background, font etc. as per your unique business setting.

Dashboard To Measure Performance Of E Commerce Retail Business Growth Marketing Techniques Icons PDF
This following slide displays the key metrics that can help an organization to measure effectiveness of e-commerce strategies. These can be revenue generated using e-commerce platform, conversion rates etc. If your project calls for a presentation, then Slidegeeks is your go to partner because we have professionally designed, easy to edit templates that are perfect for any presentation. After downloading, you can easily edit Dashboard To Measure Performance Of E Commerce Retail Business Growth Marketing Techniques Icons PDF and make the changes accordingly. You can rearrange slides or fill them with different images. Check out all the handy templates

Dashboard To Measure Performance Of Social Media Marketing Strategies Pictures PDF
This following slide displays the key metrics that can help an organization to measure effectiveness of social media strategies. These can be leads generated, leads by region, web traffic targets etc.Slidegeeks is one of the best resources for PowerPoint templates. You can download easily and regulate Dashboard To Measure Performance Of Social Media Marketing Strategies Pictures PDF for your personal presentations from our wonderful collection. A few clicks is all it takes to discover and get the most relevant and appropriate templates. Use our Templates to add a unique zing and appeal to your presentation and meetings. All the slides are easy to edit and you can use them even for advertisement purposes.

Online Marketing Techniques For Acquiring Clients Dashboard To Measure Performance Information PDF
This following slide displays the key metrics that can help an organization to measure effectiveness of social media strategies. These can be leads generated, leads by region, web traffic targets etc. Take your projects to the next level with our ultimate collection of Online Marketing Techniques For Acquiring Clients Dashboard To Measure Performance Information PDF. Slidegeeks has designed a range of layouts that are perfect for representing task or activity duration, keeping track of all your deadlines at a glance. Tailor these designs to your exact needs and give them a truly corporate look with your own brand colors they will make your projects stand out from the rest.

Implementing Digital Marketing Dashboard To Measure Performance Of Social Media Professional PDF
This following slide displays the key metrics that can help an organization to measure effectiveness of social media strategies. These can be leads generated, leads by region, web traffic targets etc. Want to ace your presentation in front of a live audience Our Implementing Digital Marketing Dashboard To Measure Performance Of Social Media Professional PDF can help you do that by engaging all the users towards you. Slidegeeks experts have put their efforts and expertise into creating these impeccable powerpoint presentations so that you can communicate your ideas clearly. Moreover, all the templates are customizable, and easy-to-edit and downloadable. Use these for both personal and commercial use.

KPI Dashboard Highlighting Off Page Seo Performance Rules PDF
The purpose of this template is to outline KPI reporting dashboard showing results of off page SEO. The dashboard covers key metrics such as website ranking on search engine, traffic, sessions, backlinks and site audit. Showcasing this set of slides titled kpi dashboard highlighting off page seo performance rules pdf. The topics addressed in these templates are kpi dashboard highlighting off page seo performance. All the content presented in this PPT design is completely editable. Download it and make adjustments in color, background, font etc. as per your unique business setting.

Comparative Assessment Of Sales Performance With Competitors Infographics PDF
This slide shows the comparative assessment of sales performance with competitors on the basis of certain metrics such as lead qualification rate, marketing effectiveness, sales forecast accuracy, pipeline thickness, etc. Presenting Comparative Assessment Of Sales Performance With Competitors Infographics PDF to provide visual cues and insights. Share and navigate important information on five stages that need your due attention. This template can be used to pitch topics like Industry Benchmark, Marketing Effectiveness, Sales Forecast Accuracy. In addtion, this PPT design contains high resolution images, graphics, etc, that are easily editable and available for immediate download.
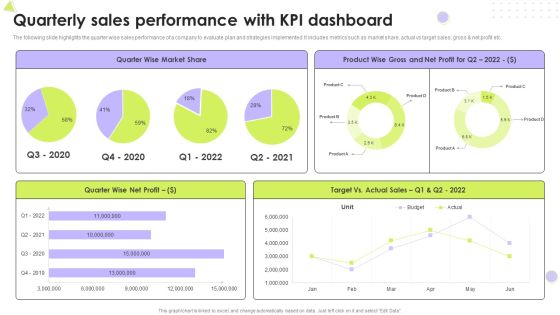
Quarterly Sales Performance With Kpi Dashboard Introduction PDF
The following slide highlights the quarter wise sales performance of a company to evaluate plan and strategies implemented. It includes metrics such as market share, actual vs target sales, gross and net profit etc. Pitch your topic with ease and precision using this Quarterly Sales Performance With Kpi Dashboard Introduction PDF. This layout presents information on Market Share, Net Profit, Target. It is also available for immediate download and adjustment. So, changes can be made in the color, design, graphics or any other component to create a unique layout.

Essential Key Performance Indicators In Investment Summary Demonstration PDF
The following slide showcases dashboard of portfolio summary with important key performance indicators to provide an oversight of the project. Key metrics covered are cost, work, variance, active risk and issues. Showcasing this set of slides titled Essential Key Performance Indicators In Investment Summary Demonstration PDF. The topics addressed in these templates are Cost, Active Risks, Projects. All the content presented in this PPT design is completely editable. Download it and make adjustments in color, background, font etc. as per your unique business setting.

Prospective Buyer Retention Dashboard With Key Performance Indicators Themes PDF
This slide shows the dashboard representing the key performance metrics for retention of potential customers of the organization. It shows no. of active users, churn rate, cost of customer acquisition, their life time value, monthly recurring revenue etc.Pitch your topic with ease and precision using this Prospective Buyer Retention Dashboard With Key Performance Indicators Themes PDF. This layout presents information on Recurring Revenue, Revenue Growth, Customer Acquisition. It is also available for immediate download and adjustment. So, changes can be made in the color, design, graphics or any other component to create a unique layout.

Business Analytics Application Workforce Performance Analysis KPI Dashboard Template PDF
This slide represents the dashboard representing key metrics to analyze the performance of overall workforce. It includes details related to absence rate, benefits satisfaction, engagement index etc. Take your projects to the next level with our ultimate collection of Business Analytics Application Workforce Performance Analysis KPI Dashboard Template PDF. Slidegeeks has designed a range of layouts that are perfect for representing task or activity duration, keeping track of all your deadlines at a glance. Tailor these designs to your exact needs and give them a truly corporate look with your own brand colors theyll make your projects stand out from the rest.

Business To Business E Commerce Performance Tracking Matrix Information PDF
This slide shows the b2b E Commerce business performance tracking table. It includes metrics such as customer acquisition cost, customer retention cost, average order value, order frequency and returns percentage. Showcasing this set of slides titled Business To Business E Commerce Performance Tracking Matrix Information PDF. The topics addressed in these templates are Customer Acquisition Cost, Customer Retention Rate, Order Frequency . All the content presented in this PPT design is completely editable. Download it and make adjustments in color, background, font etc. as per your unique business setting.

Business Newsletter Referral Marketing Program Performance KPI Dashboard Formats PDF
This slide represents KPI dashboard designed to track performance of the program conducted to attract new leads at lower cost with the help of existing customers to generate leads that best fit the organization. It includes key metrics such as total revenue generated, monthly recurring revenue, paying customers etc. Showcasing this set of slides titled Business Newsletter Referral Marketing Program Performance KPI Dashboard Formats PDF. The topics addressed in these templates are Dashboard, Paying Customers, Monthly Recurring Revenue, Total Revenue Generated. All the content presented in this PPT design is completely editable. Download it and make adjustments in color, background, font etc. as per your unique business setting.
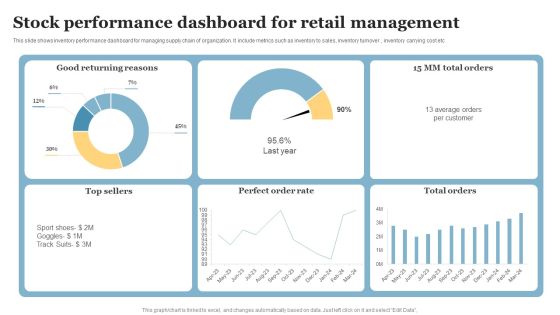
Stock Performance Dashboard For Retail Management Pictures PDF
This slide shows inventory performance dashboard for managing supply chain of organization. It include metrics such as inventory to sales, inventory turnover , inventory carrying cost etc. Pitch your topic with ease and precision using this Stock Performance Dashboard For Retail Management Pictures PDF. This layout presents information on Good Returning Reasons, Perfect Order Rate, Top Sellers. It is also available for immediate download and adjustment. So, changes can be made in the color, design, graphics or any other component to create a unique layout.

Media Advertising Social Media Channel Performance Dashboard Pictures PDF
This slide depicts the key metrics used to track the performance of social media channels in form of increase in followers, clicks and likes. This modern and well-arranged Media Advertising Social Media Channel Performance Dashboard Pictures PDF provides lots of creative possibilities. It is very simple to customize and edit with the Powerpoint Software. Just drag and drop your pictures into the shapes. All facets of this template can be edited with Powerpoint, no extra software is necessary. Add your own material, put your images in the places assigned for them, adjust the colors, and then you can show your slides to the world, with an animated slide included.

Performance Indicators For Effective Traditional Marketing Guidelines PDF
This slide showcases key metrics of traditional media for marketers. Major indicators covered are cost per lead, customer retention, marketing ROI. Sales revenue, customer lifetime value and website traffic. Create an editable Performance Indicators For Effective Traditional Marketing Guidelines PDF that communicates your idea and engages your audience. Whether you are presenting a business or an educational presentation, pre-designed presentation templates help save time. Performance Indicators For Effective Traditional Marketing Guidelines PDF is highly customizable and very easy to edit, covering many different styles from creative to business presentations. Slidegeeks has creative team members who have crafted amazing templates. So, go and get them without any delay.
Performance Evaluation KPI Dashboard For 360 Degree Review Icons PDF
This slide covers 360 degree employee feedback dashboard. It includes metrics such as highest rated area, lowest rated area, potential blind spots, peer ratings, self rating, gap analysis, etc. Showcasing this set of slides titled Performance Evaluation KPI Dashboard For 360 Degree Review Icons PDF. The topics addressed in these templates are Highest Rated, Lowest Areas, Potential Spots. All the content presented in this PPT design is completely editable. Download it and make adjustments in color, background, font etc. as per your unique business setting.

Google Adwords Strategic Campaign Performance Analysis Download PDF
The following slide displays google adwords campaign KPI trends to help company review change in values over time. It includes key metrics such as impressions, clicks, click through rate and conversions. Pitch your topic with ease and precision using this Google Adwords Strategic Campaign Performance Analysis Download PDF. This layout presents information on Google Ads Impression, Google Ads Clicks, Google Ads Conversions. It is also available for immediate download and adjustment. So, changes can be made in the color, design, graphics or any other component to create a unique layout.

Dashboard For Tracking Aftersales Customer Services Team Performance Designs PDF
This slide covers the KPI dashboard for ticket tracking. It includes metrics such as tickets by month, service level, and details of customer service department agents. Boost your pitch with our creative Dashboard For Tracking Aftersales Customer Services Team Performance Designs PDF. Deliver an awe inspiring pitch that will mesmerize everyone. Using these presentation templates you will surely catch everyones attention. You can browse the ppts collection on our website. We have researchers who are experts at creating the right content for the templates. So you do not have to invest time in any additional work. Just grab the template now and use them.

Industry Wise Email Marketing Performance Statistics Analysis Graphics PDF
This slide includes email marketing benchmarks and statistics for the year 2022 based on various industries. It includes email metrics such as open rate, CTR, unsubscribes rate in industries like automobile, finance, retail, food, legal services, etc. Pitch your topic with ease and precision using this Industry Wise Email Marketing Performance Statistics Analysis Graphics PDF. This layout presents information on Automobile, Financial Service, Legal Services. It is also available for immediate download and adjustment. So, changes can be made in the color, design, graphics or any other component to create a unique layout.
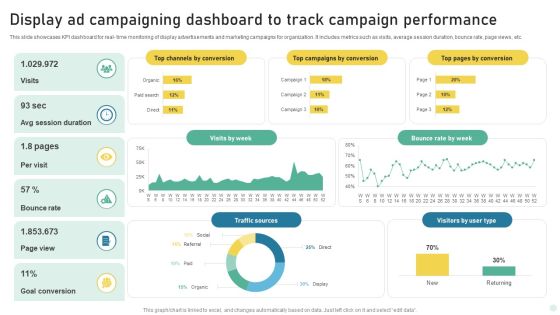
Display Ad Campaigning Dashboard To Track Campaign Performance Background PDF
This slide showcases KPI dashboard for real- time monitoring of display advertisements and marketing campaigns for organization. It includes metrics such as visits, average session duration, bounce rate, page views, etc. Showcasing this set of slides titled Display Ad Campaigning Dashboard To Track Campaign Performance Background PDF. The topics addressed in these templates are Traffic Sources, Bounce Rate, Goal Conversion. All the content presented in this PPT design is completely editable. Download it and make adjustments in color, background, font etc. as per your unique business setting.
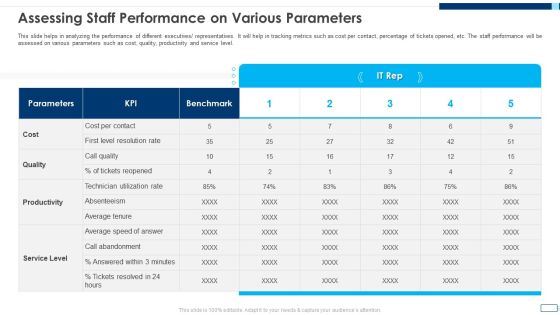
Evolving BI Infrastructure Assessing Staff Performance On Various Parameters Infographics PDF
This slide helps in analyzing the performance of different executives or representatives. It will help in tracking metrics such as cost per contact, percentage of tickets opened, etc. The staff performance will be assessed on various parameters such as cost, quality, productivity and service level. Deliver an awe inspiring pitch with this creative evolving bi infrastructure assessing staff performance on various parameters infographics pdf bundle. Topics like cost, quality, productivity, service level, parameters can be discussed with this completely editable template. It is available for immediate download depending on the needs and requirements of the user.
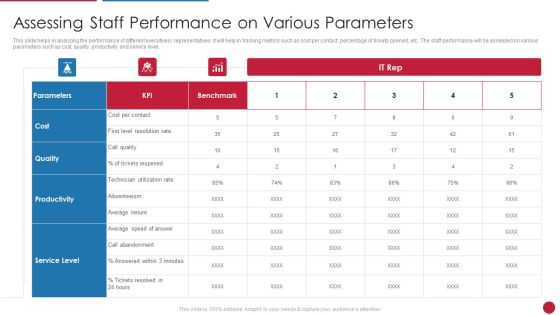
Facilitating IT Intelligence Architecture Assessing Staff Performance On Various Parameters Structure PDF
This slide helps in analyzing the performance of different executives representatives. It will help in tracking metrics such as cost per contact, percentage of tickets opened, etc. The staff performance will be assessed on various parameters such as cost, quality, productivity and service level. Deliver and pitch your topic in the best possible manner with this Facilitating IT Intelligence Architecture Assessing Staff Performance On Various Parameters Structure PDF Use them to share invaluable insights on Absenteeism, Productivity, Parameters and impress your audience. This template can be altered and modified as per your expectations. So, grab it now.

Competitive Sales Strategy Development Plan For Revenue Growth Comparative Assessment Of Sales Professional PDF
This slide shows the comparative assessment of sales performance metrics such as total revenue, average revenue per customer, market share, win rate, year-over-year growth, customer lifetime value, etc. Deliver and pitch your topic in the best possible manner with this Competitive Sales Strategy Development Plan For Revenue Growth Comparative Assessment Of Sales Professional PDF. Use them to share invaluable insights on Total Revenue, Market Share, Customer Lifetime Value and impress your audience. This template can be altered and modified as per your expectations. So, grab it now.

Retail KPI Dashboard To Evaluate Merchandising Sales Plan Performance Rules PDF
Mentioned slide showcases merchandising dashboard which can be used to analyze sales performance of various products. It covers metrics such as different types of product sold, revenue earned, payment methods used, sales in different years etc.Showcasing this set of slides titled Retail KPI Dashboard To Evaluate Merchandising Sales Plan Performance Rules PDF. The topics addressed in these templates are Clothing Apparel, Trend Merchandise, Items Sold. All the content presented in this PPT design is completely editable. Download it and make adjustments in color, background, font etc. as per your unique business setting.

Employee Performance Ratings Of Organizational Departments Table Ppt Portfolio Inspiration PDF
This slide represents table showing the performance ratings of all employees of the organization from various departments. It includes details related to employee ID, name, department and their ratings on the basis of various key metrics such as quality of work, productivity, job knowledge etc. Showcasing this set of slides titled Employee Performance Ratings Of Organizational Departments Table Ppt Portfolio Inspiration PDF. The topics addressed in these templates are Employee, Department, Quality Work. All the content presented in this PPT design is completely editable. Download it and make adjustments in color, background, font etc. as per your unique business setting.

Best Practices For Online Campaign Analysis Pictures PDF
This slide presents best practices for digital campaign analysis, that would help to review and manage metrics carefully to extract relevant information. It includes reviewing digital media, tracking KPIs, providing analysis take-outs and making future campaign analysis Persuade your audience using this Best Practices For Online Campaign Analysis Pictures PDF. This PPT design covers four stages, thus making it a great tool to use. It also caters to a variety of topics including Performance Indicators, Analysis, Campaign Analysis. Download this PPT design now to present a convincing pitch that not only emphasizes the topic but also showcases your presentation skills.
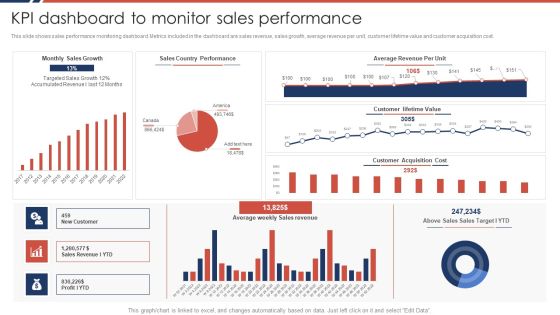
Effective Sales Plan For New Product Introduction In Market KPI Dashboard To Monitor Sales Performance Portrait PDF
This slide shows sales performance monitoring dashboard. Metrics included in the dashboard are sales revenue, sales growth, average revenue per unit, customer lifetime value and customer acquisition cost.Deliver an awe inspiring pitch with this creative Effective Sales Plan For New Product Introduction In Market KPI Dashboard To Monitor Sales Performance Portrait PDF bundle. Topics like Average Revenue, Country Performance, Customer Lifetime can be discussed with this completely editable template. It is available for immediate download depending on the needs and requirements of the user.

Creating And Introducing A Web Based Application Performance Dashboard Guidelines PDF
This slide covers application performance in market KPIs and metrics such as impressions, clicks, searches for app, conversion rate etc, Get a simple yet stunning designed Creating And Introducing A Web Based Application Performance Dashboard Guidelines PDF. It is the best one to establish the tone in your meetings. It is an excellent way to make your presentations highly effective. So, download this PPT today from Slidegeeks and see the positive impacts. Our easy-to-edit Creating And Introducing A Web Based Application Performance Dashboard Guidelines PDF can be your go-to option for all upcoming conferences and meetings. So, what are you waiting for Grab this template today.
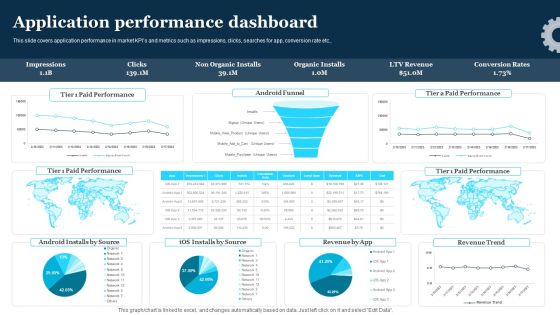
Play Store Launch Techniques For Shopping Apps Application Performance Dashboard Template PDF
This slide covers application performance in market KPIs and metrics such as impressions, clicks, searches for app, conversion rate etc., Present like a pro with Play Store Launch Techniques For Shopping Apps Application Performance Dashboard Template PDF Create beautiful presentations together with your team, using our easy to use presentation slides. Share your ideas in real time and make changes on the fly by downloading our templates. So whether you are in the office, on the go, or in a remote location, you can stay in sync with your team and present your ideas with confidence. With Slidegeeks presentation got a whole lot easier. Grab these presentations today.
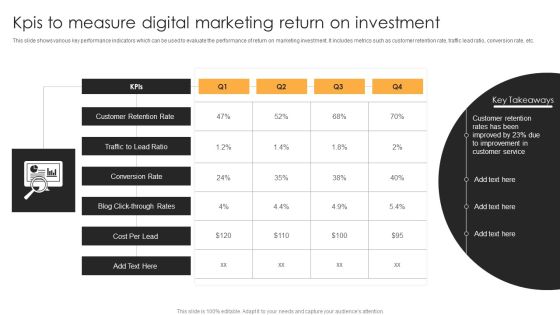
Kpis To Measure Digital Marketing Return On Investment Mockup PDF
This slide shows various key performance indicators which can be used to evaluate the performance of return on marketing investment. It includes metrics such as customer retention rate, traffic lead ratio, conversion rate, etc. Pitch your topic with ease and precision using this Kpis To Measure Digital Marketing Return On Investment Mockup PDF. This layout presents information on Conversion Rate, Traffic To Lead Ratio, Customer Retention Rate. It is also available for immediate download and adjustment. So, changes can be made in the color, design, graphics or any other component to create a unique layout.
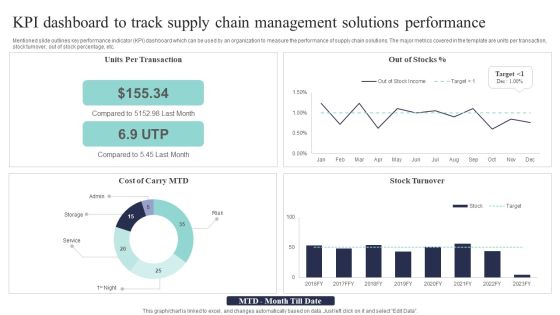
KPI Dashboard To Track Supply Chain Management Solutions Performance Background PDF
Mentioned slide outlines key performance indicator KPI dashboard which can be used by an organization to measure the performance of supply chain solutions. The major metrics covered in the template are units per transaction, stock turnover, out of stock percentage, etc. Pitch your topic with ease and precision using this KPI Dashboard To Track Supply Chain Management Solutions Performance Background PDF. This layout presents information on Per Transaction, Compared Last, Stock Turnover. It is also available for immediate download and adjustment. So, changes can be made in the color, design, graphics or any other component to create a unique layout.

KPI Dashboard To Track Marketing Return On Investment Performance Background PDF
This slide shows key performance indicators dashboard to measure the performs of marketing campaign. It includes metrics such as campaign score, standard customers, growth rate, campaign income, etc. Showcasing this set of slides titled KPI Dashboard To Track Marketing Return On Investment Performance Background PDF. The topics addressed in these templates are Customer Distribution, Standard Customers, Growth Rate. All the content presented in this PPT design is completely editable. Download it and make adjustments in color, background, font etc. as per your unique business setting.
Social Media Influencer Marketing Campaign Performance Tracking Report Ppt PowerPoint Presentation File Backgrounds PDF
This slide represents the dashboard representing the lead generation through the social media influencer marketing campaign carried out by the organization. It shows measurement of performance through key metrics of post impressions, engagements, clicks and video views etc.Showcasing this set of slides titled Social Media Influencer Marketing Campaign Performance Tracking Report Ppt PowerPoint Presentation File Backgrounds PDF. The topics addressed in these templates are Post Impressions, Post Engagements, Massages During Publishing. All the content presented in this PPT design is completely editable. Download it and make adjustments in color, background, font etc. as per your unique business setting.
Online Customer Interaction Online Ad Campaign Performance Tracking Dashboard Demonstration PDF
This slide covers the KPI dashboard for measuring digital campaign results. It includes metrics such as Ad cost, clicks, impressions, CTR, cost per click, conversions, conversion rate, cost per click, cost per thousand impressions, etc. Deliver and pitch your topic in the best possible manner with this Online Customer Interaction Online Ad Campaign Performance Tracking Dashboard Demonstration PDF. Use them to share invaluable insights on Conversations, Impressions, Conversation Rate and impress your audience. This template can be altered and modified as per your expectations. So, grab it now.
Consumer Journey Mapping Techniques Online Ad Campaign Performance Tracking Dashboard Topics PDF
This slide covers the KPI dashboard for measuring digital campaign results. It includes metrics such as Ad cost, clicks, impressions, CTR, cost per click, conversions, conversion rate, cost per click, cost per thousand impressions, etc. Showcasing this set of slides titled Consumer Journey Mapping Techniques Online Ad Campaign Performance Tracking Dashboard Topics PDF. The topics addressed in these templates are Conversation Rate, Cost Per Conversion. All the content presented in this PPT design is completely editable. Download it and make adjustments in color, background, font etc. as per your unique business setting.
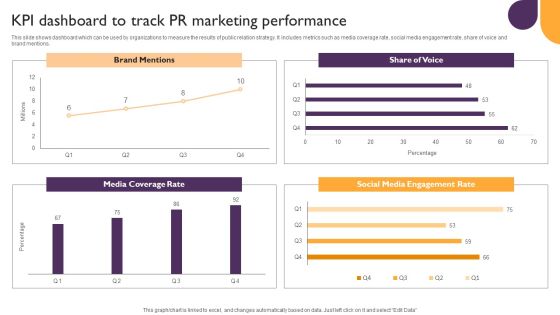
Public Relations Guide To Enhance Brand Credibility KPI Dashboard To Track PR Marketing Performance Diagrams PDF
This slide shows dashboard which can be used by organizations to measure the results of public relation strategy. It includes metrics such as media coverage rate, social media engagement rate, share of voice and brand mentions. Make sure to capture your audiences attention in your business displays with our gratis customizable Public Relations Guide To Enhance Brand Credibility KPI Dashboard To Track PR Marketing Performance Diagrams PDF. These are great for business strategies, office conferences, capital raising or task suggestions. If you desire to acquire more customers for your tech business and ensure they stay satisfied, create your own sales presentation with these plain slides.
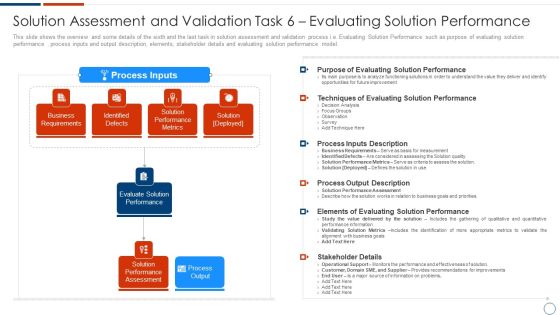
Solution Assessment And Validation Task 6 Evaluating Solution Performance Inspiration PDF
This slide shows the overview and some details of the sixth and the last task in solution assessment and validation process i.e. Evaluating Solution Performance such as purpose of evaluating solution performance , process inputs and output description, elements, stakeholder details and evaluating solution performance model.Deliver and pitch your topic in the best possible manner with this solution assessment and validation task 6 evaluating solution performance inspiration pdf Use them to share invaluable insights on business requirements, identified defects, solution performance metrics and impress your audience. This template can be altered and modified as per your expectations. So, grab it now.

B2B Lead Generation Plan Addressing Performance Delivery Gap At Present Mockup PDF
This slide provides information regarding present performance delivery by assessing it on various performance metrics such as marketing spend on B2B account management, B2B accounts closed, conversion rate and comparing these to industry benchmarks and competitors performances. Deliver an awe inspiring pitch with this creative b2b lead generation plan addressing performance delivery gap at present mockup pdf bundle. Topics like addressing performance delivery gap at present can be discussed with this completely editable template. It is available for immediate download depending on the needs and requirements of the user.

How To Build A Revenue Funnel Present Performance Delivery Gap Formats PDF
This slide provides information regarding the present delivery gap that firm is facing in terms of its performance as compared to the industry standards. The firms performance is assessed on metrics such as response rate, forecast accuracy, lead qualification rate, etc. Deliver an awe inspiring pitch with this creative how to build a revenue funnel present performance delivery gap formats pdf bundle. Topics like present performance delivery gap can be discussed with this completely editable template. It is available for immediate download depending on the needs and requirements of the user.
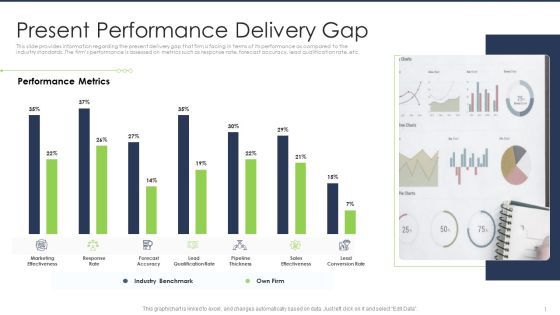
Lead Scoring AI Model Present Performance Delivery Gap Ppt File Slides PDF
This slide provides information regarding the present delivery gap that firm is facing in terms of its performance as compared to the industry standards. The firms performance is assessed on metrics such as response rate, forecast accuracy, lead qualification rate, etc. Deliver an awe inspiring pitch with this creative lead scoring ai model present performance delivery gap ppt file slides pdf bundle. Topics like marketing, effectiveness, sales, accuracy, performance can be discussed with this completely editable template. It is available for immediate download depending on the needs and requirements of the user.
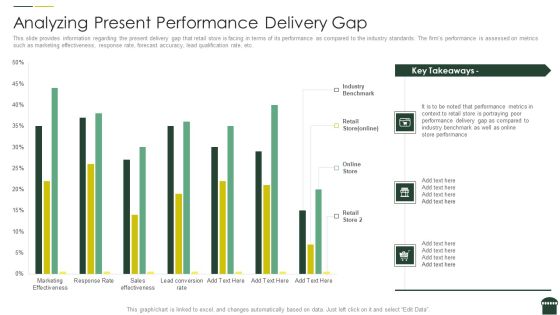
Transforming Physical Retail Outlet Analyzing Present Performance Delivery Gap Introduction PDF
This slide provides information regarding the present delivery gap that retail store is facing in terms of its performance as compared to the industry standards. The firms performance is assessed on metrics such as marketing effectiveness, response rate, forecast accuracy, lead qualification rate, etc. Deliver an awe inspiring pitch with this creative transforming physical retail outlet analyzing present performance delivery gap introduction pdf bundle. Topics like industry, performance, retail can be discussed with this completely editable template. It is available for immediate download depending on the needs and requirements of the user.
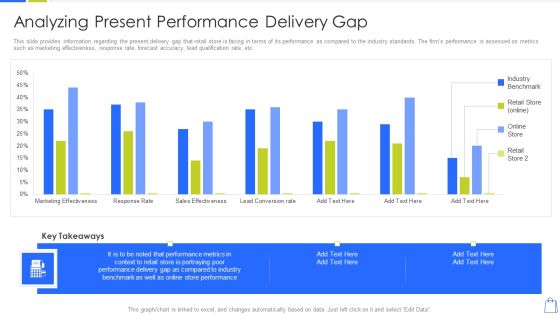
Redefining Experiential Retail Marketing Analyzing Present Performance Delivery Gap Microsoft PDF
This slide provides information regarding the present delivery gap that retail store is facing in terms of its performance as compared to the industry standards. The firms performance is assessed on metrics such as marketing effectiveness, response rate, forecast accuracy, lead qualification rate, etc. Deliver and pitch your topic in the best possible manner with this redefining experiential retail marketing analyzing present performance delivery gap microsoft pdf. Use them to share invaluable insights on analyzing present performance delivery gap and impress your audience. This template can be altered and modified as per your expectations. So, grab it now.

KPI Dashboard To Track Automation Performance In Employee Onboarding Introduction PDF
The following slide outlines performance key performance indicator KPI which can be used to evaluate business process automation performance in employee onboarding. The metrics highlighted in the slide are onboarding completion status, hires per office, etc. Deliver an awe inspiring pitch with this creative KPI Dashboard To Track Automation Performance In Employee Onboarding Introduction PDF bundle. Topics like Onboarding Completion Status, Onboardings In Progress, Employee Onboarding can be discussed with this completely editable template. It is available for immediate download depending on the needs and requirements of the user.

KPI Dashboard To Track Automation Performance In Employee Onboarding Achieving Operational Efficiency Download PDF
The following slide outlines performance key performance indicator KPI which can be used to evaluate business process automation performance in employee onboarding. The metrics highlighted in the slide are onboarding completion status, hires per office, etc.Deliver an awe inspiring pitch with this creative KPI Dashboard To Track Automation Performance In Employee Onboarding Achieving Operational Efficiency Download PDF bundle. Topics like Onboarding Completion, Onboarding, Onboarding Completion can be discussed with this completely editable template. It is available for immediate download depending on the needs and requirements of the user.

Commercial Banking Template Collection Valuation Summary Along With Stock Price Performance Diagrams PDF
The slide provides the target companys valuation summary along with stock price performance 9in comparison with index, key valuation metrics and share price estimates by the brokers for Dec 2021. Deliver and pitch your topic in the best possible manner with this commercial banking template collection valuation summary along with stock price performance diagrams pdf. Use them to share invaluable insights on stock price performance, revenues, target prices and impress your audience. This template can be altered and modified as per your expectations. So, grab it now.

Retailing Approaches For Excellent End User Engagement And Experiences Analyzing Present Performance Delivery Gap Information PDF
This slide provides information regarding the present delivery gap that retail store is facing in terms of its performance as compared to the industry standards. The firms performance is assessed on metrics such as marketing effectiveness, response rate, forecast accuracy, lead qualification rate, etc. Deliver an awe inspiring pitch with this creative retailing approaches for excellent end user engagement and experiences analyzing present performance delivery gap information pdf bundle. Topics like marketing effectiveness, sales effectiveness, lead conversion rate can be discussed with this completely editable template. It is available for immediate download depending on the needs and requirements of the user.

Sales Funnel Management For Revenue Generation Addressing Present Performance Delivery Gap Pictures PDF
This slide provides information regarding the present delivery gap that firm is facing in terms of its performance as compared to the industry standards. The firms performance is assessed on metrics such as response rate, forecast accuracy, lead qualification rate, etc. Deliver and pitch your topic in the best possible manner with this sales funnel management for revenue generation addressing present performance delivery gap pictures pdf Use them to share invaluable insights on marketing effectiveness, lead qualification rate, sales effectiveness and impress your audience. This template can be altered and modified as per your expectations. So, grab it now.

Consumer Journey Mapping Techniques Dashboard For Tracking Customer Service Team Performance Summary PDF
This slide covers the KPI dashboard for analyzing the performance of client support department. It includes metrics such as first call resolution, unresolved calls, average response rate, the best day to call, average time to solve issues, etc. Pitch your topic with ease and precision using this Consumer Journey Mapping Techniques Dashboard For Tracking Customer Service Team Performance Summary PDF. This layout presents information on Dashboard For Tracking Customer, Service Team Performance. It is also available for immediate download and adjustment. So, changes can be made in the color, design, graphics or any other component to create a unique layout.
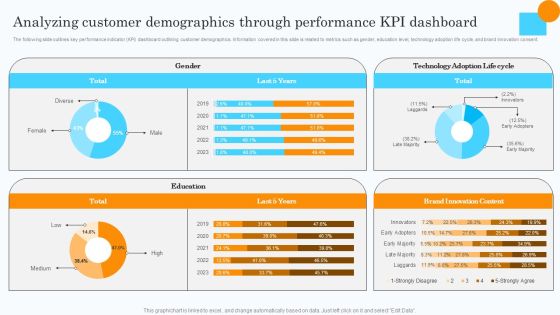
Market Research Assessment Of Target Market Requirements Analyzing Customer Demographics Clipart PDF
The following slide outlines key performance indicator KPI dashboard outlining customer demographics. Information covered in this slide is related to metrics such as gender, education level, technology adoption life cycle, and brand innovation consent. There are so many reasons you need a Market Research Assessment Of Target Market Requirements Analyzing Customer Demographics Clipart PDF. The first reason is you cannot spend time making everything from scratch, Thus, Slidegeeks has made presentation templates for you too. You can easily download these templates from our website easily.

Marketing Research Dashboard For Customer Demographics Guidelines PDF
Following slide consists of a dashboard which can be used for conducting market research of customer demographics in order to strategize accordingly. The key performance metrics include customer gender, education level, technology adopters and brand innovators. Showcasing this set of slides titled Marketing Research Dashboard For Customer Demographics Guidelines PDF. The topics addressed in these templates are Customer Gender, Technology Adopters, Education Level. All the content presented in this PPT design is completely editable. Download it and make adjustments in color, background, font etc. as per your unique business setting.
Email Marketing Dashboard Illustrating Campaign Performance Results Ppt PowerPoint Presentation File Icon PDF
Mentioned slide displays email campaign dashboard which can be used by marketers to track performance of their marketing campaigns. Marketers can track metrics such as total subscribers growth, overall bounce rate, unsubscribe rate, open rate, click rate etc. Showcasing this set of slides titled email marketing dashboard illustrating campaign performance results ppt powerpoint presentation file icon pdf. The topics addressed in these templates are marketing, list health, total subscribers, percentage. All the content presented in this PPT design is completely editable. Download it and make adjustments in color, background, font etc. as per your unique business setting.
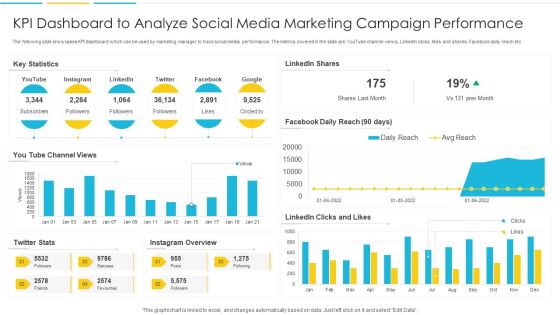
KPI Dashboard To Analyze Social Media Marketing Campaign Performance Rules PDF
The following slide showcases KPI dashboard which can be used by marketing manager to track social media performance. The metrics covered in the slide are YouTube channel views, LinkedIn clicks, likes and shares, Facebook daily reach etc. Pitch your topic with ease and precision using this KPI Dashboard To Analyze Social Media Marketing Campaign Performance Rules PDF. This layout presents information on Dashboard, Marketing, Analyze. It is also available for immediate download and adjustment. So, changes can be made in the color, design, graphics or any other component to create a unique layout.
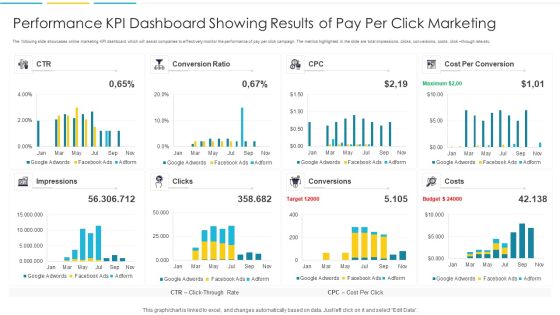
Performance KPI Dashboard Showing Results Of Pay Per Click Marketing Portrait PDF
The following slide showcases online marketing KPI dashboard which will assist companies to effectively monitor the performance of pay per click campaign. The metrics highlighted in the slide are total impressions, clicks, conversions, costs, click through rate etc. Pitch your topic with ease and precision using this Performance KPI Dashboard Showing Results Of Pay Per Click Marketing Portrait PDF. This layout presents information on Impressions, Target, Budget. It is also available for immediate download and adjustment. So, changes can be made in the color, design, graphics or any other component to create a unique layout.
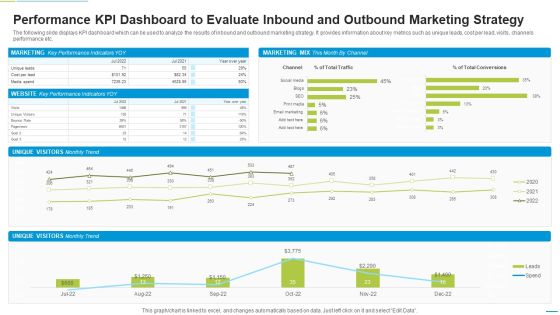
Performance KPI Dashboard To Evaluate Inbound And Outbound Marketing Strategy Mockup PDF
The following slide displays KPI dashboard which can be used to analyze the results of inbound and outbound marketing strategy. It provides information about key metrics such as unique leads, cost per lead, visits, channels performance etc. Showcasing this set of slides titled Performance KPI Dashboard To Evaluate Inbound And Outbound Marketing Strategy Mockup PDF. The topics addressed in these templates are Marketing, Unique Visitors, Cost Per Lead. All the content presented in this PPT design is completely editable. Download it and make adjustments in color, background, font etc. as per your unique business setting.

Sales Automation Procedure Comparative Assessment Of Sales Performance With Competitors Demonstration PDF
This slide shows the comparative assessment of sales performance with competitors based on certain metrics such as lead qualification rate, ,marketing effectiveness, sales forecast accuracy, pipeline thickness, etc. Deliver and pitch your topic in the best possible manner with this Sales Automation Procedure Comparative Assessment Of Sales Performance With Competitors Demonstration PDF. Use them to share invaluable insights on Industry Benchmark, Our Company, Marketing Effectiveness and impress your audience. This template can be altered and modified as per your expectations. So, grab it now.
Online Customer Interaction Dashboard For Tracking Customer Service Team Performance Infographics PDF
This slide covers the KPI dashboard for analyzing the performance of client support department. It includes metrics such as first call resolution, unresolved calls, average response rate, the best day to call, average time to solve issues, etc. Deliver and pitch your topic in the best possible manner with this Online Customer Interaction Dashboard For Tracking Customer Service Team Performance Infographics PDF. Use them to share invaluable insights on Response Time, Issue Solving, Call Resolution and impress your audience. This template can be altered and modified as per your expectations. So, grab it now.

Consumer Journey Mapping Techniques Dashboard For Tracking Digital Content Performance Clipart PDF
This slide covers the KPI dashboard for analyzing online content. It includes metrics such as blog visitors, pageviews, newsletter conversion rate, new signups, new customers, etc. Showcasing this set of slides titled Consumer Journey Mapping Techniques Dashboard For Tracking Digital Content Performance Clipart PDF. The topics addressed in these templates are Purchase Amount, Customers, Tracking Digital Content Performance. All the content presented in this PPT design is completely editable. Download it and make adjustments in color, background, font etc. as per your unique business setting.
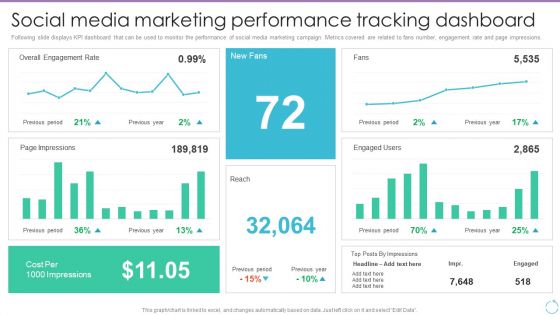
Personal Branding Plan For Executives Social Media Marketing Performance Clipart PDF
Following slide displays KPI dashboard that can be used to monitor the performance of social media marketing campaign. Metrics covered are related to fans number, engagement rate and page impressions. Slidegeeks is one of the best resources for PowerPoint templates. You can download easily and regulate Personal Branding Plan For Executives Social Media Marketing Performance Clipart PDF for your personal presentations from our wonderful collection. A few clicks is all it takes to discover and get the most relevant and appropriate templates. Use our Templates to add a unique zing and appeal to your presentation and meetings. All the slides are easy to edit and you can use them even for advertisement purposes.

KPI Dashboard To Monitor E Commerce Revenue Analysis Performance Mockup PDF
This slide shows the key performance indicators dashboard which can be used to analyze current financial position of e-commerce business. It includes metrics such as revenue, expenses, profit, cash in hand, etc. Showcasing this set of slides titled KPI Dashboard To Monitor E Commerce Revenue Analysis Performance Mockup PDF. The topics addressed in these templates are Accounts Receivable, Accounts Payable, Revenue, Expenses. All the content presented in this PPT design is completely editable. Download it and make adjustments in color, background, font etc. as per your unique business setting.
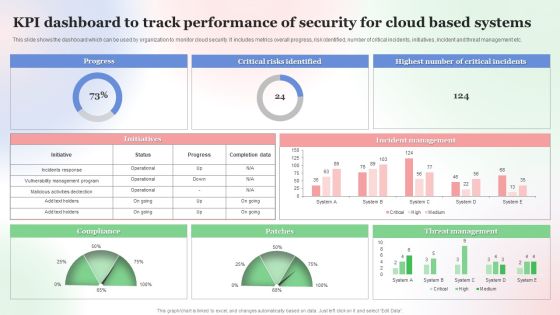
KPI Dashboard To Track Performance Of Security For Cloud Based Systems Clipart PDF
This slide shows the dashboard which can be used by organization to monitor cloud security. It includes metrics overall progress, risk identified, number of critical incidents, initiatives, incident and threat management etc. Showcasing this set of slides titled KPI Dashboard To Track Performance Of Security For Cloud Based Systems Clipart PDF. The topics addressed in these templates are Kpi Dashboard To Track, Performance Of Security, Cloud Based Systems . All the content presented in this PPT design is completely editable. Download it and make adjustments in color, background, font etc. as per your unique business setting.

Conventional Media Channels Performance Indicators For Effective Traditional Marketing Themes PDF
This slide showcases key metrics of traditional media for marketers. Major indicators covered are cost per lead, customer retention, marketing ROI. Sales revenue, customer lifetime value and website traffic. From laying roadmaps to briefing everything in detail, our templates are perfect for you. You can set the stage with your presentation slides. All you have to do is download these easy to edit and customizable templates. Conventional Media Channels Performance Indicators For Effective Traditional Marketing Themes PDF will help you deliver an outstanding performance that everyone would remember and praise you for. Do download this presentation today.
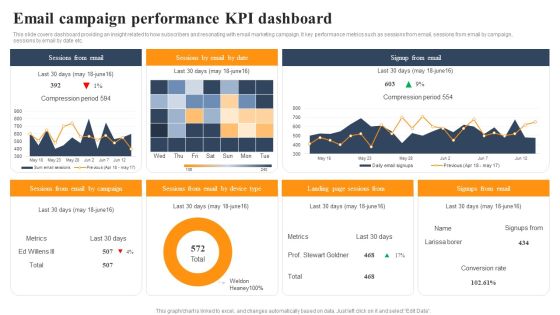
Implementing An Effective Ecommerce Management Framework Email Campaign Performance KPI Dashboard Introduction PDF
This slide covers dashboard providing an insight related to how subscribers and resonating with email marketing campaign. It key performance metrics such as sessions from email, sessions from email by campaign, sessions by email by date etc. If your project calls for a presentation, then Slidegeeks is your go-to partner because we have professionally designed, easy-to-edit templates that are perfect for any presentation. After downloading, you can easily edit Implementing An Effective Ecommerce Management Framework Email Campaign Performance KPI Dashboard Introduction PDF and make the changes accordingly. You can rearrange slides or fill them with different images. Check out all the handy templates
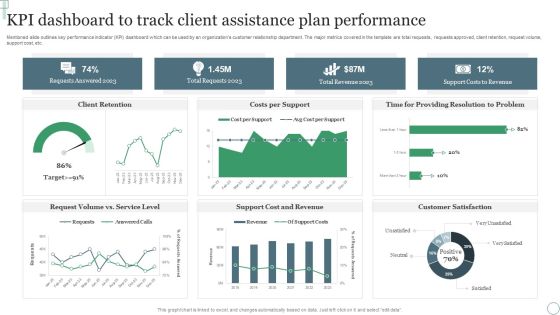
KPI Dashboard To Track Client Assistance Plan Performance Ppt Professional Outfit PDF
Mentioned slide outlines key performance indicator KPI dashboard which can be used by an organizations customer relationship department. The major metrics covered in the template are total requests, requests approved, client retention, request volume, support cost, etc. Pitch your topic with ease and precision using this KPI Dashboard To Track Client Assistance Plan Performance Ppt Professional Outfit PDF. This layout presents information on Requests Answered 2023, Total Requests 2023, Total Revenue 2023. It is also available for immediate download and adjustment. So, changes can be made in the color, design, graphics or any other component to create a unique layout.

Strategies For Implementing CPA Marketing Dashboard To Monitor CPA Marketing Campaign Performance Topics PDF
This slide showcases the dashboard to track and monitor performance of CPA marketing campaign. It incorporates metrics such as link clicks, CTR, marketing cost, overall CPA cost, website conversion rate, overall conversion rate, advertising sources, etc. The best PPT templates are a great way to save time, energy, and resources. Slidegeeks have 100 percent editable powerpoint slides making them incredibly versatile. With these quality presentation templates, you can create a captivating and memorable presentation by combining visually appealing slides and effectively communicating your message. Download Strategies For Implementing CPA Marketing Dashboard To Monitor CPA Marketing Campaign Performance Topics PDF from Slidegeeks and deliver a wonderful presentation.
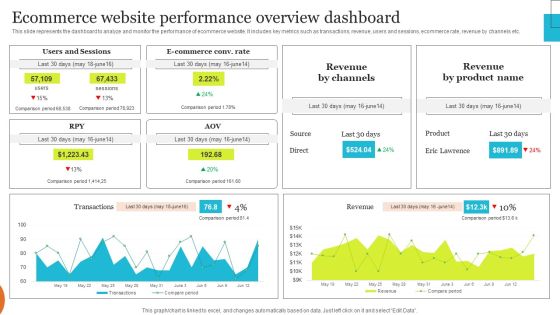
Implementing Effective Ecommerce Managemnet Platform Ecommerce Website Performance Overview Template PDF
This slide represents the dashboard to analyze and monitor the performance of ecommerce website. It includes key metrics such as transactions, revenue, users and sessions, ecommerce rate, revenue by channels etc. Boost your pitch with our creative Implementing Effective Ecommerce Managemnet Platform Ecommerce Website Performance Overview Template PDF. Deliver an awe-inspiring pitch that will mesmerize everyone. Using these presentation templates you will surely catch everyones attention. You can browse the ppts collection on our website. We have researchers who are experts at creating the right content for the templates. So you do not have to invest time in any additional work. Just grab the template now and use them.
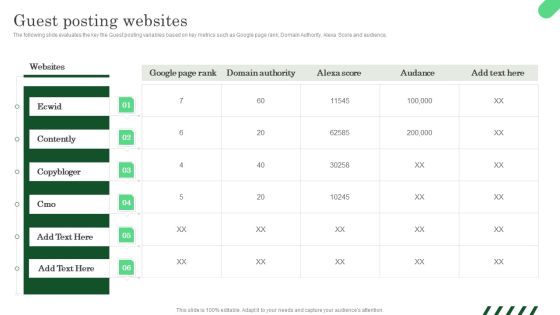
Increasing ROI And Business Performance Using Local Listing And SEO Strategy Guest Posting Portrait PDF
The following slide evaluates the key the Guest posting variables based on key metrics such as Google page rank, Domain Authority, Alexa Score and audience. From laying roadmaps to briefing everything in detail, our templates are perfect for you. You can set the stage with your presentation slides. All you have to do is download these easy to edit and customizable templates. Increasing ROI And Business Performance Using Local Listing And SEO Strategy Guest Posting Portrait PDF will help you deliver an outstanding performance that everyone would remember and praise you for. Do download this presentation today.

Building Market Brand Leadership Strategies Kpi Dashboard To Track Brand Performance Designs PDF
Mentioned slide showcases KPI dashboard that can be used to check the financial performance of a brand. Metrics covered in the dashboard are return on assets, working capital ratio, return on equity etc. There are so many reasons you need a Building Market Brand Leadership Strategies Kpi Dashboard To Track Brand Performance Designs PDF. The first reason is you cannot spend time making everything from scratch, Thus, Slidegeeks has made presentation templates for you too. You can easily download these templates from our website easily.

Media Advertising Action Plan For Twitter Advertising Campaign Brochure PDF
In this slide, we are showcasing the action plan for twitter marketing campaign covering the key strategies, key actions, and metrics used to track the performance. Find a pre-designed and impeccable Media Advertising Action Plan For Twitter Advertising Campaign Brochure PDF. The templates can ace your presentation without additional effort. You can download these easy-to-edit presentation templates to make your presentation stand out from others. So, what are you waiting for Download the template from Slidegeeks today and give a unique touch to your presentation.

Cyber Security Incident Response KPI Dashboard Microsoft PDF
This slide represents dashboard showing the key metrics of cyber security incident response. It includes key performance indicators such as risk score, compliance status, threat level etc. Slidegeeks has constructed Cyber Security Incident Response KPI Dashboard Microsoft PDF after conducting extensive research and examination. These presentation templates are constantly being generated and modified based on user preferences and critiques from editors. Here, you will find the most attractive templates for a range of purposes while taking into account ratings and remarks from users regarding the content. This is an excellent jumping off point to explore our content and will give new users an insight into our top notch PowerPoint Templates.

Implementing Marketing Mix Strategy To Enhance Overall Performance Competitor Benchmarking For Effective Analysis Themes PDF
Competitive benchmarking is a technique used by multiple organizations to understand the basic industry standards, the following slide helps the organization in understanding competitive benchmarking by carefully analyzing various metrics of the competitors. Deliver and pitch your topic in the best possible manner with this Implementing Marketing Mix Strategy To Enhance Overall Performance Competitor Benchmarking For Effective Analysis Themes PDF. Use them to share invaluable insights on Purchase, Bounce Rate, Effective Analysis and impress your audience. This template can be altered and modified as per your expectations. So, grab it now.

Yearly Company Financial Performance Indicators Of Organization Ppt Infographics Outline PDF
This slide showcases to past years values of organization for future prediction. Key metrics covered are revenue, net profit, cash flow, sales and EBITDA. Persuade your audience using this Yearly Company Financial Performance Indicators Of Organization Ppt Infographics Outline PDF. This PPT design covers five stages, thus making it a great tool to use. It also caters to a variety of topics including Revenue, Net Profit, Cash Flow. Download this PPT design now to present a convincing pitch that not only emphasizes the topic but also showcases your presentation skills.

Consumer Journey Mapping Techniques Loyalty Program Performance Tracking Dashboard Portrait PDF
This slide covers the KPI dashboard for analyzing customer loyalty campaign results. It includes metrics such as revenue, liability, NQP accrued, transaction count, members, redemption ratio, etc. Pitch your topic with ease and precision using this Consumer Journey Mapping Techniques Loyalty Program Performance Tracking Dashboard Portrait PDF. This layout presents information on Transaction Count, Revenue, Redemption Ratio. It is also available for immediate download and adjustment. So, changes can be made in the color, design, graphics or any other component to create a unique layout.
Consumer Journey Mapping Techniques Referral Program Performance Tracking Dashboard Formats PDF
This slide covers the KPI dashboard for analyzing referral campaign results. It includes metrics such as total revenue generated, monthly recurring revenue, new customers, clicks, cancelled customers, paying customers, etc. Showcasing this set of slides titled Consumer Journey Mapping Techniques Referral Program Performance Tracking Dashboard Formats PDF. The topics addressed in these templates are Revenue, New Customers, Paying Customers. All the content presented in this PPT design is completely editable. Download it and make adjustments in color, background, font etc. as per your unique business setting.

Offline Media Channel Analysis Performance Indicators For Effective Traditional Marketing Elements PDF
This slide showcases key metrics of traditional media for marketers. Major indicators covered are cost per lead, customer retention, marketing ROI. Sales revenue, customer lifetime value and website traffic. Want to ace your presentation in front of a live audience Our Offline Media Channel Analysis Performance Indicators For Effective Traditional Marketing Elements PDF can help you do that by engaging all the users towards you.. Slidegeeks experts have put their efforts and expertise into creating these impeccable powerpoint presentations so that you can communicate your ideas clearly. Moreover, all the templates are customizable, and easy-to-edit and downloadable. Use these for both personal and commercial use.

Strategies Employing PPC Advertising Performing A B Testing For Boosting Conversion Rate Rules PDF
This slide provides glimpse about running multiple A or B tests on different pay per click metrics that help the businesses to select the right hypothesis for increasing large audiences. It includes experiment hypothesis, audience builder, campaigns, A or B testing tool, etc. There are so many reasons you need a Strategies Employing PPC Advertising Performing A B Testing For Boosting Conversion Rate Rules PDF. The first reason is you can not spend time making everything from scratch, Thus, Slidegeeks has made presentation templates for you too. You can easily download these templates from our website easily.

Cashless Payment Strategies To Enhance Business Performance Impact Of Accepting Cryptocurrency Payments Background PDF
Mentioned slide showcases statistics associates with impact of cryptocurrency implementation in business. It includes key metrics such as transaction cost, merchant protection, customer convenience and business sales. Make sure to capture your audiences attention in your business displays with our gratis customizable Cashless Payment Strategies To Enhance Business Performance Impact Of Accepting Cryptocurrency Payments Background PDF. These are great for business strategies, office conferences, capital raising or task suggestions. If you desire to acquire more customers for your tech business and ensure they stay satisfied, create your own sales presentation with these plain slides.
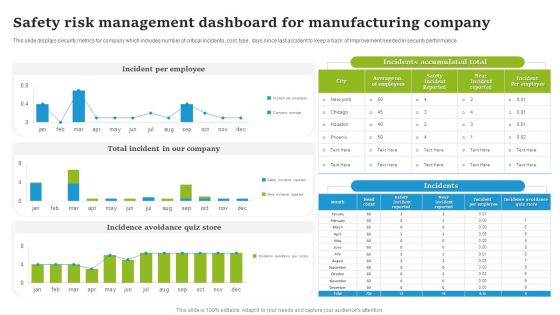
Safety Risk Management Dashboard For Manufacturing Company Introduction PDF
This slide displays security metrics for company which includes number of critical incidents, cost, type, days since last accident to keep a track of Improvement needed in security performance. Showcasing this set of slides titled Safety Risk Management Dashboard For Manufacturing Company Introduction PDF. The topics addressed in these templates are Incident Per Employee, Total Incident Our Company, Incidence Avoidance Quiz Store. All the content presented in this PPT design is completely editable. Download it and make adjustments in color, background, font etc. as per your unique business setting.
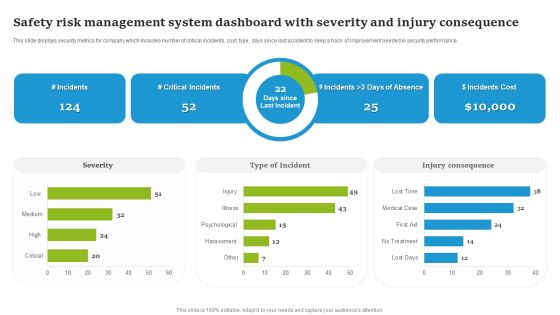
Safety Risk Management System Dashboard With Severity And Injury Consequence Clipart PDF
This slide displays security metrics for company which includes number of critical incidents, cost, type, days since last accident to keep a track of Improvement needed in security performance. Pitch your topic with ease and precision using this Safety Risk Management System Dashboard With Severity And Injury Consequence Clipart PDF. This layout presents information on Severity, Type Of Incident, Injury Consequence . It is also available for immediate download and adjustment. So, changes can be made in the color, design, graphics or any other component to create a unique layout.

Project Earned Value Analysis Management Report Ppt PowerPoint Presentation Gallery Outline PDF
This slide represents project earned value analysis report showcasing project task, budget cost, planned value, actual cost, earned value, project performance metrics etc. Pitch your topic with ease and precision using this Project Earned Value Analysis Management Report Ppt PowerPoint Presentation Gallery Outline PDF. This layout presents information on Project Software Development, Phase Management, Communication Planning. It is also available for immediate download and adjustment. So, changes can be made in the color, design, graphics or any other component to create a unique layout.

BPA Tools For Process Enhancement And Cost Minimization KPI Dashboard To Track Automation Performance In Employee Onboarding Graphics PDF
The following slide outlines performance key performance indicator KPI which can be used to evaluate business process automation performance in employee onboarding. The metrics highlighted in the slide are onboarding completion status, hires per office, etc. There are so many reasons you need a BPA Tools For Process Enhancement And Cost Minimization KPI Dashboard To Track Automation Performance In Employee Onboarding Graphics PDF. The first reason is you can not spend time making everything from scratch, Thus, Slidegeeks has made presentation templates for you too. You can easily download these templates from our website easily.

Various Kpis To Measure Effectiveness Of Risk Management Course Guidelines PDF
The following slide exhibits multiple key performance indicator kPIs metrics which can assist the real estate company to measure the effectiveness of online risk management course. The KPIs are risks identified, monitored, mitigated and cost incurred. Deliver an awe inspiring pitch with this creative Various Kpis To Measure Effectiveness Of Risk Management Course Guidelines PDF bundle. Topics like Systematic Risks Identified, Key Risks Mitigated, Management Course can be discussed with this completely editable template. It is available for immediate download depending on the needs and requirements of the user.
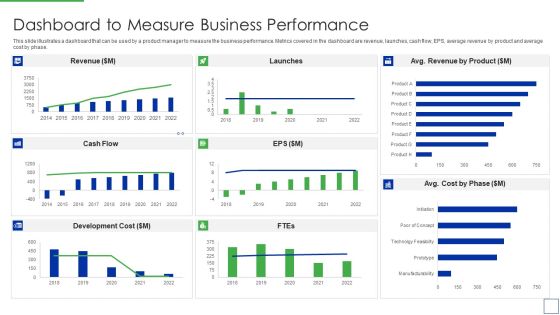
Product Portfolio Management For New Target Region Dashboard To Measure Business Rules PDF
This slide illustrates a dashboard that can be used by a product manager to measure the business performance. Metrics covered in the dashboard are revenue, launches, cash flow, EPS, average revenue by product and average cost by phase.Deliver and pitch your topic in the best possible manner with this Product Portfolio Management For New Target Region Dashboard To Measure Business Rules PDF Use them to share invaluable insights on Dashboard to Measure Business Performance and impress your audience. This template can be altered and modified as per your expectations. So, grab it now.

Kpis To Track Before Raising Capital Portrait PDF
This slide presents various key performance metrics which a company should track in order to raise capital for equity. The major key performance indicators are revenue growth, gross margin, customer acquisition costs, net promoter score and burn rate. Pitch your topic with ease and precision using this Kpis To Track Before Raising Capital Portrait PDF. This layout presents information on Net Promoter Score, Customer Acquisition Costs, Gross Margin. It is also available for immediate download and adjustment. So, changes can be made in the color, design, graphics or any other component to create a unique layout.
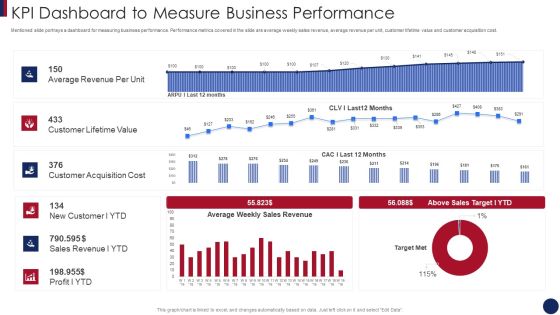
Post Merger Information Technology Service Delivery Amalgamation KPI Dashboard To Measure Business Template PDF
Mentioned slide portrays a dashboard for measuring business performance. Performance metrics covered in the slide are average weekly sales revenue, average revenue per unit, customer lifetime value and customer acquisition cost. Deliver an awe inspiring pitch with this creative post merger information technology service delivery amalgamation kpi dashboard to measure business template pdf bundle. Topics like kpi dashboard to measure business performance can be discussed with this completely editable template. It is available for immediate download depending on the needs and requirements of the user.
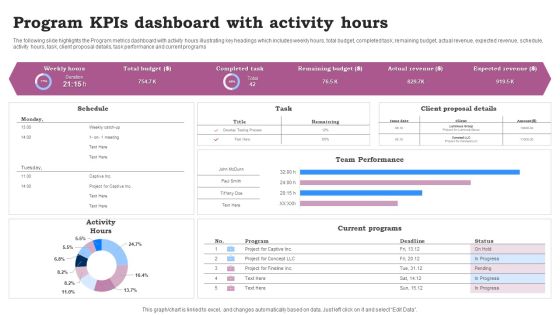
Program Kpis Dashboard With Activity Hours Ppt Infographics Clipart Images PDF
The following slide highlights the Program metrics dashboard with activity hours illustrating key headings which includes weekly hours, total budget, completed task, remaining budget, actual revenue, expected revenue, schedule, activity hours, task, client proposal details, task performance and current programs. Pitch your topic with ease and precision using this Program Kpis Dashboard With Activity Hours Ppt Infographics Clipart Images PDF. This layout presents information on Team Performance, Current Programs, Activity Hours. It is also available for immediate download and adjustment. So, changes can be made in the color, design, graphics or any other component to create a unique layout.
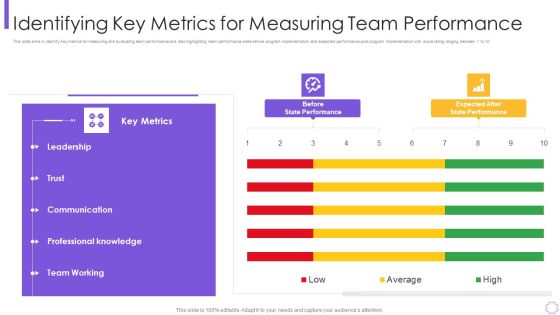
Process Optimization Through Product Life Process Management Techniques Identifying Sample PDF
This slide aims to identify key metrics for measuring and evaluating team performance and also highlighting team performance state before program implementation and expected performance post program implementation with score rating ranging between 1 to 10.Deliver and pitch your topic in the best possible manner with this process optimization through product life process management techniques identifying sample pdf Use them to share invaluable insights on communication, professional knowledge, team working and impress your audience. This template can be altered and modified as per your expectations. So, grab it now.
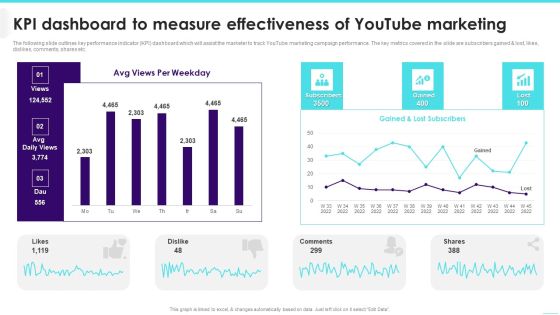
KPI Dashboard To Measure Effectiveness Of Youtube Marketing Inspiration PDF
The following slide outlines key performance indicator KPI dashboard which will assist the marketer to track YouTube marketing campaign performance. The key metrics covered in the slide are subscribers gained lost, likes, dislikes, comments, shares etc.Deliver an awe inspiring pitch with this creative KPI Dashboard To Measure Effectiveness Of Youtube Marketing Inspiration PDF bundle. Topics like Lost Subscribers, Comments, Per Weekday can be discussed with this completely editable template. It is available for immediate download depending on the needs and requirements of the user.

Introduction To Supply Chain Management Organization Kpis Mockup PDF
This slide showcases introduction to KPIs that can help supply chain management organization to evaluate the operational and delivery performance. Its key metrics are perfect order rate, cash to cash cycle time, on time delivery and fill rate.Showcasing this set of slides titled Introduction To Supply Chain Management Organization Kpis Mockup PDF The topics addressed in these templates are Orders Delivered, Represents Percentage, Company Shipments All the content presented in this PPT design is completely editable. Download it and make adjustments in color, background, font etc. as per your unique business setting.

Event Monitoring Kpis For Experiential Marketing Topics PDF
This slide presents KPIs Key performance indictors in event marketing for building experiential campaign for audience. It includes metrics to be tracked and best practices for different elements involved in converting leads into customers. Presenting Event Monitoring Kpis For Experiential Marketing Topics PDF to dispense important information. This template comprises three stages. It also presents valuable insights into the topics including Revenue, Sales, E Commerce. This is a completely customizable PowerPoint theme that can be put to use immediately. So, download it and address the topic impactfully.

Effective Sales Plan For New Product Introduction In Market Dashboard To Measure Sales Download PDF
This slide illustrates sales representative performance measurement dashboard with key metrics such as average first contact resolution rate, occupancy rate, NPS and top agents by solved tickets.Deliver and pitch your topic in the best possible manner with this Effective Sales Plan For New Product Introduction In Market Dashboard To Measure Sales Download PDF Use them to share invaluable insights on Sales Enquiry, Feature Request, Setup Request and impress your audience. This template can be altered and modified as per your expectations. So, grab it now.
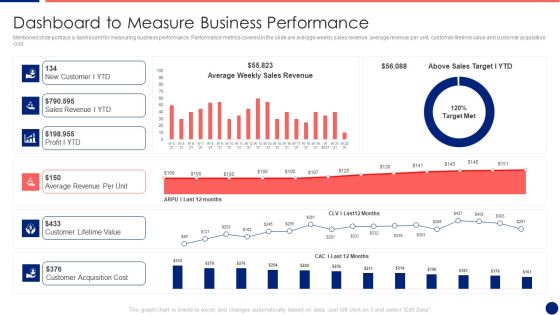
Information Technology Service Integration Post Acquisition Merger Dashboard To Measure Business Pictures PDF
Mentioned slide portrays a dashboard for measuring business performance. Performance metrics covered in the slide are average weekly sales revenue, average revenue per unit, customer lifetime value and customer acquisition cost. Deliver and pitch your topic in the best possible manner with this information technology service integration post acquisition merger dashboard to measure business pictures pdf. Use them to share invaluable insights on sales revenue, average, cost and impress your audience. This template can be altered and modified as per your expectations. So, grab it now.

Brand Awareness Measuring Kpi Dashboard Brand And Equity Evaluation Techniques Ideas PDF
Mentioned slide showcases KPI dashboard that can be used to check the financial performance of a brand. Metrics covered in the dashboard are return on assets, working capital ratio, return on equity etc.From laying roadmaps to briefing everything in detail, our templates are perfect for you. You can set the stage with your presentation slides. All you have to do is download these easy-to-edit and customizable templates. Brand Awareness Measuring Kpi Dashboard Brand And Equity Evaluation Techniques Ideas PDF will help you deliver an outstanding performance that everyone would remember and praise you for. Do download this presentation today.

Measuring Brand Awareness Through Social Media Platforms Ppt PowerPoint Presentation Diagram Graph Charts PDF
The following slide outlines various key performance indicators KPIs through which marketers can evaluate brand awareness on social media channels such as Facebook, Instagram, LinkedIn, Twitter, and YouTube. The metrics mentioned are brand impressions, reach, engagement rate, followers growth, story views, etc. The best PPT templates are a great way to save time, energy, and resources. Slidegeeks have 100 percent editable powerpoint slides making them incredibly versatile. With these quality presentation templates, you can create a captivating and memorable presentation by combining visually appealing slides and effectively communicating your message. Download Measuring Brand Awareness Through Social Media Platforms Ppt PowerPoint Presentation Diagram Graph Charts PDF from Slidegeeks and deliver a wonderful presentation.

Steps To Conduct Competitor Analysis Kpis To Assess Competitor Digital Presence Ideas PDF
The following slide showcases various metrics to assess online presence of rivalry businesses for formulating digital marketing strategies of business. It highlights KPIs such as daily active users, conversion rates, abandon rates, profile impression rate, profile reach rate, followers, audience growth rate, engagement rate, etc. From laying roadmaps to briefing everything in detail, our templates are perfect for you. You can set the stage with your presentation slides. All you have to do is download these easy-to-edit and customizable templates. Steps To Conduct Competitor Analysis Kpis To Assess Competitor Digital Presence Ideas PDF will help you deliver an outstanding performance that everyone would remember and praise you for. Do download this presentation today.
Implementing Change Management Strategy To Transform Business Processes Dashboard Depicting Kpis To Track Icons PDF
This slide covers the dashboard that depicts metrics to track company sales performance that focuses on number of sales, cost breakdown, accumulated revenues, incremental sales, etc. Boost your pitch with our creative Implementing Change Management Strategy To Transform Business Processes Dashboard Depicting Kpis To Track Icons PDF. Deliver an awe-inspiring pitch that will mesmerize everyone. Using these presentation templates you will surely catch everyones attention. You can browse the ppts collection on our website. We have researchers who are experts at creating the right content for the templates. So you do not have to invest time in any additional work. Just grab the template now and use them.
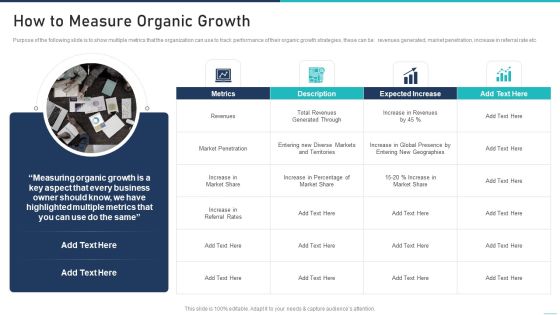
Generic Growth Playbook How To Measure Organic Growth Topics PDF
Purpose of the following slide is to show multiple metrics that the organization can use to track performance of their organic growth strategies, these can be revenues generated, market penetration, increase in referral rate etc.Deliver and pitch your topic in the best possible manner with this generic growth playbook how to measure organic growth topics pdf Use them to share invaluable insights on total revenues, increase in percentage, entering new geographies and impress your audience. This template can be altered and modified as per your expectations. So, grab it now.

Virtual Assets Investment Guide Cryptocurrency Portfolio Investment Dashboard Guidelines PDF
Identifying the metrics which help in analyzing the product performance play a crucial role when it comes to tracking performance. The following slide highlights such manor KPIs, these are total sell, total buy, etc. Deliver an awe inspiring pitch with this creative Virtual Assets Investment Guide Cryptocurrency Portfolio Investment Dashboard Guidelines PDF bundle. Topics like Bitcoin BTC, Total Sell, Total Buy can be discussed with this completely editable template. It is available for immediate download depending on the needs and requirements of the user.
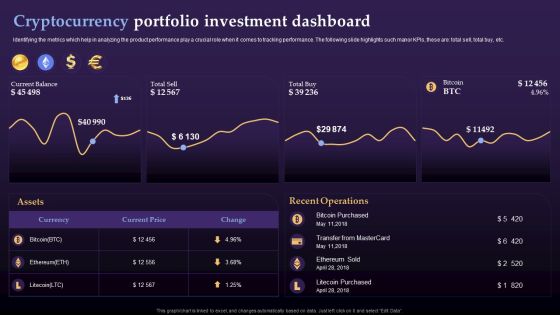
Virtual Currency Investment Guide For Companies Cryptocurrency Portfolio Investment Slides PDF
Identifying the metrics which help in analyzing the product performance play a crucial role when it comes to tracking performance. The following slide highlights such manor KPIs, these are total sell, total buy, etc. Deliver an awe inspiring pitch with this creative Virtual Currency Investment Guide For Companies Cryptocurrency Portfolio Investment Slides PDF bundle. Topics like Current Balance, Total Sell, Bitcoin BTC can be discussed with this completely editable template. It is available for immediate download depending on the needs and requirements of the user.

Plant Safety Measures Dashboard With Incidents Work Accidents And Near Misses Template PDF
This slide showcases dashboard to monitor plant safety measures performance indicators. Key metrics covered are incident and injury type, root cause, location, contributing factor, employees at risk and investigation. Pitch your topic with ease and precision using this Plant Safety Measures Dashboard With Incidents Work Accidents And Near Misses Template PDF. This layout presents information on Plant Safety Measures Dashboard, Incidents Work Accidents. It is also available for immediate download and adjustment. So, changes can be made in the color, design, graphics or any other component to create a unique layout.

Deploying Quality Assurance QA Transformation Implement Code Quality Measurements Guidelines PDF
This slide shows the details about Code Quality Measurements Approach for Effective QA Transformation along with details on Software Quality Indicators and Test Metrics such as Reliability, Security, Testability, Rate of Delivery etc.This is a Deploying Quality Assurance QA Transformation Implement Code Quality Measurements Guidelines PDF template with various stages. Focus and dispense information on seven stages using this creative set, that comes with editable features. It contains large content boxes to add your information on topics like Performance Efficiency, Maintainability, Reliability You can also showcase facts, figures, and other relevant content using this PPT layout. Grab it now.

Promoting Growth Internal Operations Techniques Playbook How To Measure Organic Growth Elements PDF
Purpose of the following slide is to show multiple metrics that the organization can use to track performance of their organic growth strategies, these can be revenues generated, market penetration, increase in referral rate etc. Deliver and pitch your topic in the best possible manner with this Promoting Growth Internal Operations Techniques Playbook How To Measure Organic Growth Elements PDF. Use them to share invaluable insights on Measuring Organic Growth, Market Penetration, Revenues and impress your audience. This template can be altered and modified as per your expectations. So, grab it now.
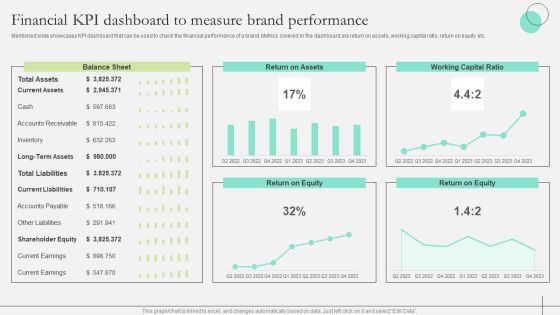
Comprehensive Guide To Strengthen Brand Equity Financial KPI Dashboard Measure Brand Structure PDF
Mentioned slide showcases KPI dashboard that can be used to check the financial performance of a brand. Metrics covered in the dashboard are return on assets, working capital ratio, return on equity etc. Take your projects to the next level with our ultimate collection of Comprehensive Guide To Strengthen Brand Equity Financial KPI Dashboard Measure Brand Structure PDF. Slidegeeks has designed a range of layouts that are perfect for representing task or activity duration, keeping track of all your deadlines at a glance. Tailor these designs to your exact needs and give them a truly corporate look with your own brand colors they will make your projects stand out from the rest
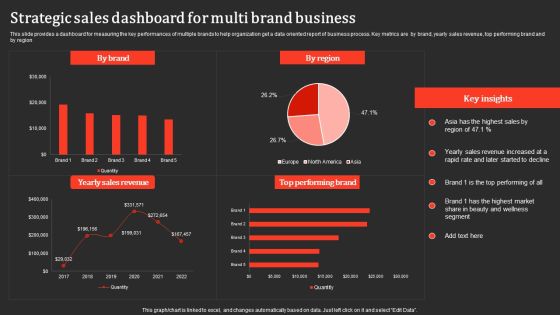
Strategic Sales Dashboard For Multi Brand Business Professional PDF
This slide provides a dashboard for measuring the key performances of multiple brands to help organization get a data oriented report of business process. Key metrics are by brand, yearly sales revenue, top performing brand and by region. Pitch your topic with ease and precision using this Strategic Sales Dashboard For Multi Brand Business Professional PDF. This layout presents information on Yearly Sales Revenue, Performing Brand. It is also available for immediate download and adjustment. So, changes can be made in the color, design, graphics or any other component to create a unique layout.
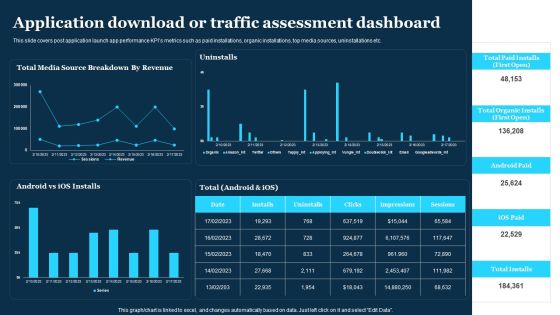
Play Store Launch Techniques For Shopping Apps Application Download Traffic Assessment Structure PDF
This slide covers post application launch app performance KPIs metrics such as paid installations, organic installations, top media sources, uninstallations etc. From laying roadmaps to briefing everything in detail, our templates are perfect for you. You can set the stage with your presentation slides. All you have to do is download these easy to edit and customizable templates. Play Store Launch Techniques For Shopping Apps Application Download Traffic Assessment Structure PDF will help you deliver an outstanding performance that everyone would remember and praise you for. Do download this presentation today.

Warehouse Key Efficiency Indicators For Operations Management Slides PDF
This slide shows the table representing key metrics for measuring the performance of warehouse by the operations management team. It includes performance measurement of four activities of receiving, pick and pack, shipping and overall management of orders. Pitch your topic with ease and precision using this Warehouse Key Efficiency Indicators For Operations Management Slides PDF. This layout presents information on Operations Mgmt Shipping, Operations Mgmt. Receiving. It is also available for immediate download and adjustment. So, changes can be made in the color, design, graphics or any other component to create a unique layout.

Consumer Intelligence Dashboard With Net Promoter Score Ppt PowerPoint Presentation File Templates PDF
Mentioned slide visually represents consumer intelligence dashboard that can be used by organization in order to understand customer journey. Customer satisfaction by product, net promotor score of last 90 and 365 days, agent performance, satisfaction by channel are some of the key metrics which are shown in this slide. Showcasing this set of slides titled Consumer Intelligence Dashboard With Net Promoter Score Ppt PowerPoint Presentation File Templates PDF. The topics addressed in these templates are Agent Performance, Satisfaction Channel, Net Promoter. All the content presented in this PPT design is completely editable. Download it and make adjustments in color, background, font etc. as per your unique business setting.

Automation Project Status Dashboard Of Consulting Firm Report Background PDF
This slide showcases project status dashboard that provides a concise visual of key indicators progress and allow to compare actual performance with pre-built objectives. Key metrics covered are cost performance, time v or s project phase, timeline v or s resource capacity. Showcasing this set of slides titled Automation Project Status Dashboard Of Consulting Firm Report Background PDF. The topics addressed in these templates are Project Phase, Planned Value, Cost Performance Index. All the content presented in this PPT design is completely editable. Download it and make adjustments in color, background, font etc. as per your unique business setting.

Comprehensive Market Research Guide Brand Analytics Kpi Dashboard For Organization Brochure PDF
The following slide outlines key performance indicator KPI dashboard that can assist marketers to evaluate brand performance on social media channels. The metrics covered are age group, gender, brand perception, branding themes, celebrity analysis, etc. From laying roadmaps to briefing everything in detail, our templates are perfect for you. You can set the stage with your presentation slides. All you have to do is download these easy-to-edit and customizable templates. Comprehensive Market Research Guide Brand Analytics Kpi Dashboard For Organization Brochure PDF will help you deliver an outstanding performance that everyone would remember and praise you for. Do download this presentation today.
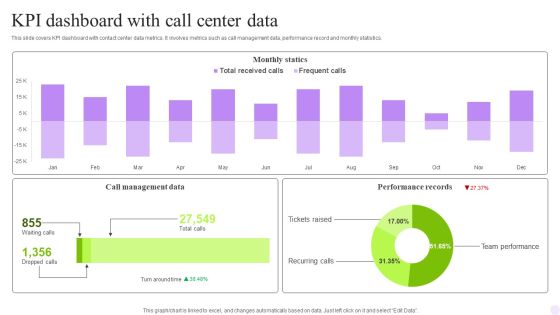
KPI Dashboard With Call Center Data Rules PDF
This slide covers contact center performance metrics KPI dashboard. It involves details such as number of total calls, average answer speed, abandon rate, data of agents performance and call abandon rate by departments. Pitch your topic with ease and precision using this KPI Dashboard With Call Center Data Rules PDF. This layout presents information on Monthly Statics, Management Data, Performance Records. It is also available for immediate download and adjustment. So, changes can be made in the color, design, graphics or any other component to create a unique layout.

Business Process Holding Roles And Responsibilities Ppt PowerPoint Presentation Gallery Infographic Template PDF
This slide exhibits business process ownership roles and responsibilities. It includes major responsibilities such as- manage process framework, assure collaboration, analyse process metrics and performance goals. Showcasing this set of slides titled business process holding roles and responsibilities ppt powerpoint presentation gallery infographic template pdf. The topics addressed in these templates are provide direction, process management, measure performance, set objectives, responsibilities. All the content presented in this PPT design is completely editable. Download it and make adjustments in color, background, font etc. as per your unique business setting.

Key Tools To Enhance Owned Media Effectiveness Summary PDF
Following slide brings forth the major key performing indicators that can be used by digital marketers to measure the effectiveness of earned media strategies. Key elements consists of dimension, description, tools and key performing indicators metrics Showcasing this set of slides titled Key Tools To Enhance Owned Media Effectiveness Summary PDF. The topics addressed in these templates are Dimension, Description, Tools . All the content presented in this PPT design is completely editable. Download it and make adjustments in color, background, font etc. as per your unique business setting.

Strategy To Improve Team Proficiency Challenges Faced By Organization Brochure PDF
This slide provides detailed interpretation of statistics metrics provided in the previous slide highlighting the downside of organization current human capital state. Presenting strategy to improve team proficiency challenges faced by organization brochure pdf to provide visual cues and insights. Share and navigate important information on four stages that need your due attention. This template can be used to pitch topics like team, marketing, cost, workplace, conflicts, attrition. In addtion, this PPT design contains high resolution images, graphics, etc, that are easily editable and available for immediate download.

Implementation Steps Establish Basic Automation Processes Slides PDF
This slide covers various KPIs that need to be measured to achieve organizational goals. It includes metrics such as salespersons performance report, number of leads converted, leads generated through campaigns, monthly sales report, number of unresolved cases, etc. Deliver and pitch your topic in the best possible manner with this Implementation Steps Establish Basic Automation Processes Slides PDF. Use them to share invaluable insights on Defined Through, Sales Managers, Projects Notifying and impress your audience. This template can be altered and modified as per your expectations. So, grab it now.

Consumer Journey Mapping Techniques Digital Content Audit And Review Results Graphics PDF
This slide covers KPIs for measuring posted content performance. It includes metrics such as page views, unique pageview, average time on page, entrances, bounce rate, exit percentage, etc. Pitch your topic with ease and precision using this Consumer Journey Mapping Techniques Digital Content Audit And Review Results Graphics PDF. This layout presents information on Digital Content Audit, Review Results. It is also available for immediate download and adjustment. So, changes can be made in the color, design, graphics or any other component to create a unique layout.

Online Customer Touchpoints Auditing And Reviewing Systems Digital Content Audit And Review Results Rules PDF
This slide covers KPIs for measuring posted content performance. It includes metrics such as page views, unique pageview, average time on page, entrances, bounce rate, exit percentage, etc. Want to ace your presentation in front of a live audience Our Online Customer Touchpoints Auditing And Reviewing Systems Digital Content Audit And Review Results Rules PDF can help you do that by engaging all the users towards you. Slidegeeks experts have put their efforts and expertise into creating these impeccable powerpoint presentations so that you can communicate your ideas clearly. Moreover, all the templates are customizable, and easy to edit and downloadable. Use these for both personal and commercial use.

Steps To Conduct Competitor Analysis Current Scenario Of Business Digital Marketing Guidelines PDF
This slide showcases various KPIs to track and measure performance of digital marketing strategies upon business. It highlights metrics such as net promoter score, website traffic, leads generation rate, page views rate, conversion rate, click-through rate, bounce rate, funnel conversion rate, retention rate, etc. If your project calls for a presentation, then Slidegeeks is your go-to partner because we have professionally designed, easy-to-edit templates that are perfect for any presentation. After downloading, you can easily edit Steps To Conduct Competitor Analysis Current Scenario Of Business Digital Marketing Guidelines PDF and make the changes accordingly. You can rearrange slides or fill them with different images. Check out all the handy templates.

Defining Content Marketing Goals And Objectives Ppt Outline Graphics Tutorials PDF
This slide represents content marketing goals, objectives, strategies and metrics to measure performance across customer lifecycle stages such as reach, act and convert. This Defining Content Marketing Goals And Objectives Ppt Outline Graphics Tutorials PDF is perfect for any presentation, be it in front of clients or colleagues. It is a versatile and stylish solution for organizing your meetings. The product features a modern design for your presentation meetings. The adjustable and customizable slides provide unlimited possibilities for acing up your presentation. Slidegeeks has done all the homework before launching the product for you. So, do not wait, grab the presentation templates today

Five Warehouse Key Efficiency Management Indicators Analysis Table Demonstration PDF
This slide shows the table representing the key metrics for measurement of performance of warehouse system of an organization. It includes data related to five activities of receiving, put away, storage, order picking and shipping of products. Showcasing this set of slides titled Five Warehouse Key Efficiency Management Indicators Analysis Table Demonstration PDF. The topics addressed in these templates are Activity, Received, Storage. All the content presented in this PPT design is completely editable. Download it and make adjustments in color, background, font etc. as per your unique business setting.
Sales Process Catalogue Template Sales Management Activities Tracking Dashboard Summary PDF
This slide provides information regarding various metrics catered to track sales team performance in terms of average revenue per account, win rate, NPS, along with sales representative performance tracking through number of opportunities created, lead response time, etc. Deliver an awe inspiring pitch with this creative sales process catalogue template sales management activities tracking dashboard summary pdf bundle. Topics like sales pipeline, sales activity by sales rep, sales pipeline by sales rep, closed business, month over month growth, forecast by month can be discussed with this completely editable template. It is available for immediate download depending on the needs and requirements of the user.
Sales Techniques Playbook Sales Management Activities Tracking Dashboard Introduction PDF
This slide provides information regarding various metrics catered to track sales team performance in terms of average revenue per account, win rate, NPS, along with sales representative performance tracking through number of opportunities created, lead response time, etc. Deliver an awe inspiring pitch with this creative sales techniques playbook sales management activities tracking dashboard introduction pdf bundle. Topics like growth, sales can be discussed with this completely editable template. It is available for immediate download depending on the needs and requirements of the user.
Marketing Playbook To Maximize ROI Sales Management Activities Tracking Dashboard Guidelines PDF
This slide provides information regarding various metrics catered to track sales team performance in terms of average revenue per account, win rate, NPS, along with sales representative performance tracking through number of opportunities created, lead response time, etc. Deliver and pitch your topic in the best possible manner with this marketing playbook to maximize roi sales management activities tracking dashboard guidelines pdf. Use them to share invaluable insights on closed business, sales pipeline, month over month growth, sales activity by sales rep and impress your audience. This template can be altered and modified as per your expectations. So, grab it now.
Salesman Principles Playbook Sales Management Activities Tracking Dashboard Ideas PDF
This slide provides information regarding various metrics catered to track sales team performance in terms of average revenue per account, win rate, NPS, along with sales representative performance tracking through number of opportunities created, lead response time, etc. Deliver and pitch your topic in the best possible manner with this salesman principles playbook sales management activities tracking dashboard ideas pdf Use them to share invaluable insights on sales management activities tracking dashboard and impress your audience. This template can be altered and modified as per your expectations. So, grab it now.
Sales Management Playbook Sales Management Activities Tracking Dashboard Themes PDF
This slide provides information regarding various metrics catered to track sales team performance in terms of average revenue per account, win rate, NPS, along with sales representative performance tracking through number of opportunities created, lead response time, etc. Deliver an awe inspiring pitch with this creative Sales Management Playbook Sales Management Activities Tracking Dashboard Themes PDF bundle. Topics like Sales Management Activities Tracking Dashboard can be discussed with this completely editable template. It is available for immediate download depending on the needs and requirements of the user.

BI Software Vendor Scan With Evaluation BI Transformation Toolset Brochure PDF
This slide tabulates the vendor performance on multiple metrics such as cost, after-sale services. Also, a comparative analysis of vendors for business intelligence solutions is performed by scoring them on key attributes. Presenting BI Software Vendor Scan With Evaluation BI Transformation Toolset Brochure PDF to provide visual cues and insights. Share and navigate important information on one stages that need your due attention. This template can be used to pitch topics like Evaluation Parameters, Costing, After Sale Services. In addtion, this PPT design contains high resolution images, graphics, etc, that are easily editable and available for immediate download.

KPI Dashboard To Track Sales And Operations Process Of Manufacturing Enterprise Brochure PDF
This slide depicts a dashboard to track the key performance metrics in sales and operations process of a manufacturing enterprise to analyze deviations in the actual and planned output. The key performing indicators are percentage deviation, dollar deviation, inventory in hand etc.Pitch your topic with ease and precision using this KPI Dashboard To Track Sales And Operations Process Of Manufacturing Enterprise Brochure PDF. This layout presents information on Planned Output, Yearly Growth, Inventory Hand. It is also available for immediate download and adjustment. So, changes can be made in the color, design, graphics or any other component to create a unique layout.
Market Evaluation Of IT Industry Marketing Campaign Dashboard For B2b Marketers Icons PDF
The following slide showcases key performance indicator KPI dashboard that can assist managers to evaluate digital marketing campaign performance. The key metrics mentioned in the slide are click through rate CTR, conversion rate, cost per click CPC, etc. Make sure to capture your audiences attention in your business displays with our gratis customizable Market Evaluation Of IT Industry Marketing Campaign Dashboard For B2b Marketers Icons PDF. These are great for business strategies, office conferences, capital raising or task suggestions. If you desire to acquire more customers for your tech business and ensure they stay satisfied, create your own sales presentation with these plain slides.
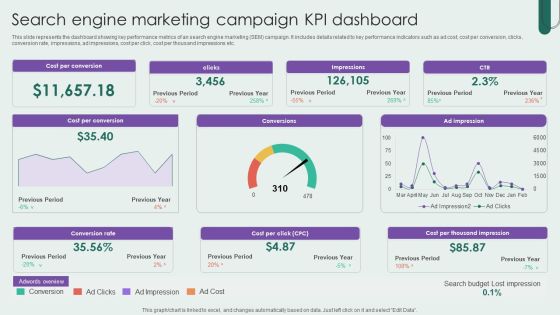
Search Engine Marketing Campaign KPI Dashboard Inspiration PDF
This slide represents the dashboard showing key performance metrics of an search engine marketing SEM campaign. It includes details related to key performance indicators such as ad cost, cost per conversion, clicks, conversion rate, impressions, ad impressions, cost per click, cost per thousand impressions etc. Showcasing this set of slides titled Search Engine Marketing Campaign KPI Dashboard Inspiration PDF. The topics addressed in these templates are Search Engine Marketing, Campaign KPI Dashboard. All the content presented in this PPT design is completely editable. Download it and make adjustments in color, background, font etc. as per your unique business setting.
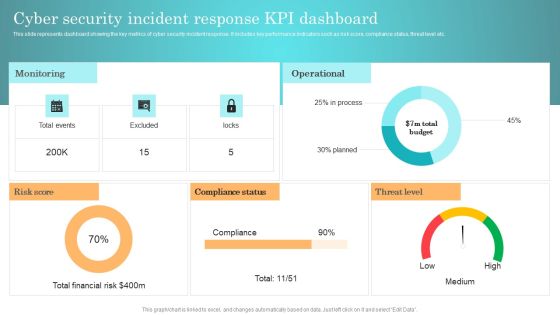
Incident Response Techniques Deployement Cyber Security Incident Response KPI Dashboard Background PDF
This slide represents dashboard showing the key metrics of cyber security incident response. It includes key performance indicators such as risk score, compliance status, threat level etc. From laying roadmaps to briefing everything in detail, our templates are perfect for you. You can set the stage with your presentation slides. All you have to do is download these easy to edit and customizable templates. Incident Response Techniques Deployement Cyber Security Incident Handler Contact Information Guidelines PDF will help you deliver an outstanding performance that everyone would remember and praise you for. Do download this presentation today.

Brand Analytics KPI Dashboard For Organization Ppt PowerPoint Presentation Diagram PDF
The following slide outlines key performance indicator KPI dashboard that can assist marketers to evaluate brand performance on social media channels. The metrics covered are age group, gender, brand perception, branding themes, celebrity analysis, etc. Take your projects to the next level with our ultimate collection of Brand Analytics KPI Dashboard For Organization Ppt PowerPoint Presentation Diagram PDF. Slidegeeks has designed a range of layouts that are perfect for representing task or activity duration, keeping track of all your deadlines at a glance. Tailor these designs to your exact needs and give them a truly corporate look with your own brand colors they will make your projects stand out from the rest.
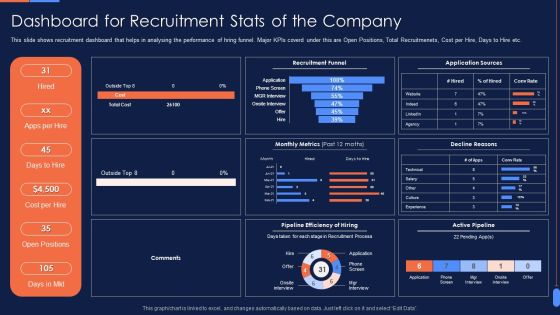
Recruitment Training To Optimize Dashboard For Recruitment Stats Of The Company Structure PDF
This slide shows recruitment dashboard that helps in analysing the performance of hring funnel. Major KPIs coverd under this are Open Positions, Total Recruitmenets, Cost per Hire, Days to Hire etc. Deliver an awe inspiring pitch with this creative Recruitment Training To Optimize Dashboard For Recruitment Stats Of The Company Structure PDF bundle. Topics like Cost Per Hire, Open Positions, Apps Per Hire, Pipeline Efficiency Of Hiring, Monthly Metrics can be discussed with this completely editable template. It is available for immediate download depending on the needs and requirements of the user.
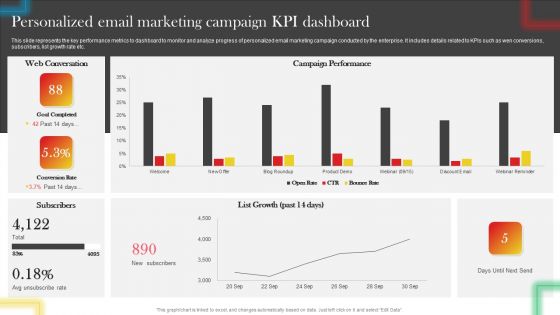
Personalized Email Marketing Campaign KPI Dashboard Inspiration PDF
This slide represents the key performance metrics to dashboard to monitor and analyze progress of personalized email marketing campaign conducted by the enterprise. It includes details related to KPIs such as wen conversions, subscribers, list growth rate etc. If your project calls for a presentation, then Slidegeeks is your go-to partner because we have professionally designed, easy-to-edit templates that are perfect for any presentation. After downloading, you can easily edit Personalized Email Marketing Campaign KPI Dashboard Inspiration PDF and make the changes accordingly. You can rearrange slides or fill them with different images. Check out all the handy templates

Property Rental Portfolio Dashboard Topics PDF
The following slide presents a real estate portfolio dashboard for rental and letting out with key performance indicator metrics to provide information at glance. The KPIs covered in this dashboard are number of property viewings, actively let properties etc. Showcasing this set of slides titled Property Rental Portfolio Dashboard Topics PDF. The topics addressed in these templates are People Registered Looking, Actively Let Properties, Average Property Letting Time. All the content presented in this PPT design is completely editable. Download it and make adjustments in color, background, font etc. as per your unique business setting.

Application Download Or Traffic Assessment Dashboard Summary PDF
This slide covers post application launch app performance KPIs metrics such as paid installations, organic installations, top media sources, uninstallations etc. Create an editable Application Download Or Traffic Assessment Dashboard Summary PDF that communicates your idea and engages your audience. Whether you are presenting a business or an educational presentation, pre designed presentation templates help save time. Application Download Or Traffic Assessment Dashboard Summary PDF is highly customizable and very easy to edit, covering many different styles from creative to business presentations. Slidegeeks has creative team members who have crafted amazing templates. So, go and get them without any delay.
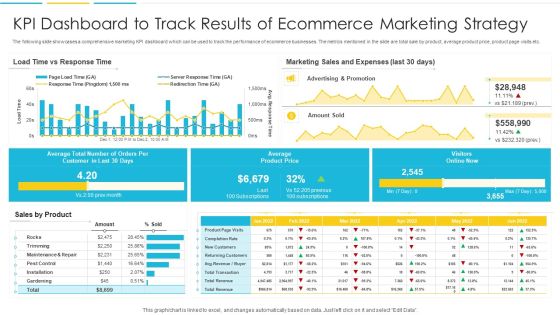
KPI Dashboard To Track Results Of Ecommerce Marketing Strategy Structure PDF
The following slide showcases a comprehensive marketing KPI dashboard which can be used to track the performance of ecommerce businesses. The metrics mentioned in the slide are total sale by product, average product price, product page visits etc. Showcasing this set of slides titled KPI Dashboard To Track Results Of Ecommerce Marketing Strategy Structure PDF. The topics addressed in these templates are Average, Customer, Marketing. All the content presented in this PPT design is completely editable. Download it and make adjustments in color, background, font etc. as per your unique business setting.

Digital Marketing KPI Dashboard With Engagement Rate Background PDF
The following slide showcases a comprehensive KPI dashboard which allows the company to track the digital marketing performance. Total visits, cost per click, engagement rate, total impressions, product sales trend, revenue by various channels are some of the key metrics mentioned in the slide. Showcasing this set of slides titled Digital Marketing KPI Dashboard With Engagement Rate Background PDF. The topics addressed in these templates are Demographics, Revenue, Sales. All the content presented in this PPT design is completely editable. Download it and make adjustments in color, background, font etc. as per your unique business setting.

Customer Behavior Analytics Dashboard With Yearly Users Ppt Portfolio Ideas PDF
The following slide showcases dashboard that provides an insight on customer buying behavior from ecommerce website. Key metrics covered are yearly users, average time on page, bounce rate, unique page views session duration, purchased products, visitors, page performance and top search terms. Showcasing this set of slides titled Customer Behavior Analytics Dashboard With Yearly Users Ppt Portfolio Ideas PDF. The topics addressed in these templates are Yearly Users, Yearly Bounce Rate, Top Search Terms. All the content presented in this PPT design is completely editable. Download it and make adjustments in color, background, font etc. as per your unique business setting.
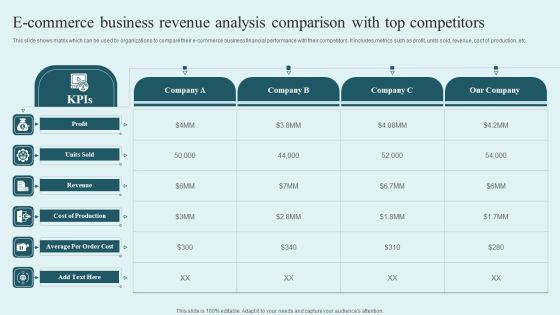
E Commerce Business Revenue Analysis Comparison With Top Competitors Rules PDF
This slide shows matrix which can be used by organizations to compare their e-commerce business financial performance with their competitors. It includes metrics such as profit, units sold, revenue, cost of production, etc. Showcasing this set of slides titled E Commerce Business Revenue Analysis Comparison With Top Competitors Rules PDF. The topics addressed in these templates are Profit, Revenue, Average Per, Order Cost . All the content presented in this PPT design is completely editable. Download it and make adjustments in color, background, font etc. as per your unique business setting.

Strategy To Enhance Buyer Intimacy Establishing Customer Advocacy For Enhancing Brand Reputation Rules PDF
Mentioned slide provides a user guide to understand key attributes of advocacy stage of customer journey. It includes touch points to be optimized and metrics to be evaluated for performance measuring. This is a strategy to enhance buyer intimacy establishing customer advocacy for enhancing brand reputation rules pdf template with various stages. Focus and dispense information on four stages using this creative set, that comes with editable features. It contains large content boxes to add your information on topics like establishing customer advocacy for enhancing brand reputation. You can also showcase facts, figures, and other relevant content using this PPT layout. Grab it now.
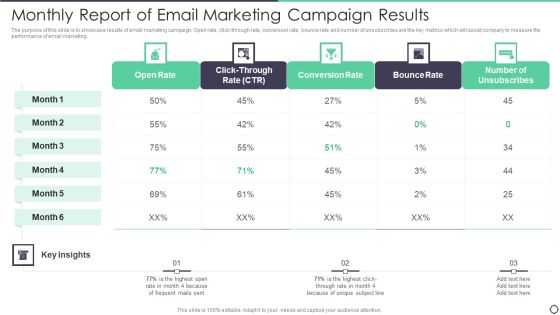
Monthly Report Of Email Marketing Campaign Results Designs PDF
The purpose of this slide is to showcase results of email marketing campaign. Open rate, click through rate, conversion rate, bounce rate and number of unsubscribes are the key metrics which will assist company to measure the performance of email marketing. Showcasing this set of slides titled Monthly Report Of Email Marketing Campaign Results Designs PDF. The topics addressed in these templates are Monthly Report Of Email Marketing Campaign Results. All the content presented in this PPT design is completely editable. Download it and make adjustments in color, background, font etc. as per your unique business setting.
 Home
Home