Success Metrics
Metrics To Measure Business Performance Product Pricing Strategy We Will Adopt Icons PDF
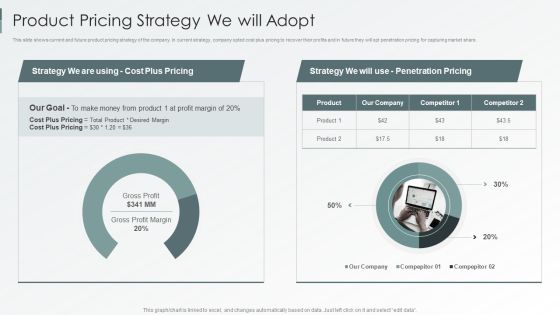
This slide shows current and future product pricing strategy of the company. In current strategy, company opted cost plus pricing to recover their profits and in future they will opt penetration pricing for capturing market share. Deliver an awe inspiring pitch with this creative Metrics To Measure Business Performance Product Pricing Strategy We Will Adopt Icons PDF bundle. Topics like Strategy, Cost Plus Pricing, Penetration Pricing, Our Goal can be discussed with this completely editable template. It is available for immediate download depending on the needs and requirements of the user.
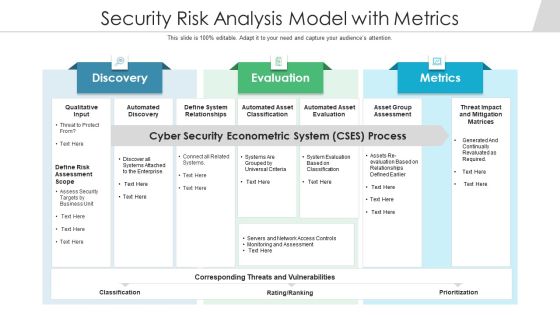
Security Risk Analysis Model With Metrics Ppt PowerPoint Presentation Outline Designs PDF
Persuade your audience using this security risk analysis model with metrics ppt powerpoint presentation outline designs pdf. This PPT design covers three stages, thus making it a great tool to use. It also caters to a variety of topics including automated discovery, define system relationships, automated asset classification. Download this PPT design now to present a convincing pitch that not only emphasizes the topic but also showcases your presentation skills.

Competitive Assessment Of Social Recruitment Metrics Enhancing Social Media Recruitment Process Clipart PDF
This slide represents competitive assessment of social recruitment metrics which includes cost per hire, engagement, quality and time to hire, sourcing channel efficiency and candidate experience.Welcome to our selection of the Competitive Assessment Of Social Recruitment Metrics Enhancing Social Media Recruitment Process Clipart PDF. These are designed to help you showcase your creativity and bring your sphere to life. Planning and Innovation are essential for any business that is just starting out. This collection contains the designs that you need for your everyday presentations. All of our PowerPoints are 100 Precent editable, so you can customize them to suit your needs. This multi-purpose template can be used in various situations. Grab these presentation templates today.
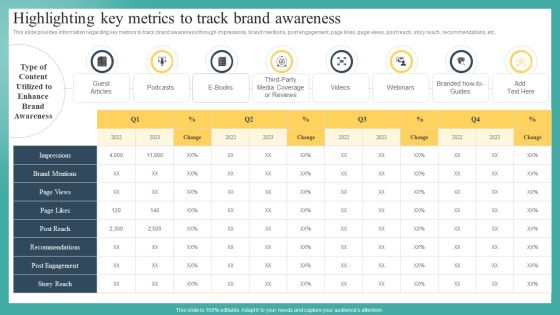
Highlighting Key Metrics To Track Brand Awareness Ppt File Background Images PDF
This slide provides information regarding key metrics to track brand awareness through impressions, brand mentions, post engagement, page likes, page views, post reach, story reach, recommendations, etc. Welcome to our selection of the Highlighting Key Metrics To Track Brand Awareness Ppt File Background Images PDF. These are designed to help you showcase your creativity and bring your sphere to life. Planning and Innovation are essential for any business that is just starting out. This collection contains the designs that you need for your everyday presentations. All of our PowerPoints are 100 percent editable, so you can customize them to suit your needs. This multi purpose template can be used in various situations. Grab these presentation templates today.

Brand Management To Enhance Highlighting Key Metrics To Track Brand Awareness Designs PDF
This slide provides information regarding key metrics to track brand awareness through impressions, brand mentions, post engagement, page likes, page views, post reach, story reach, recommendations, etc. Slidegeeks is here to make your presentations a breeze with Brand Management To Enhance Highlighting Key Metrics To Track Brand Awareness Designs PDF With our easy-to-use and customizable templates, you can focus on delivering your ideas rather than worrying about formatting. With a variety of designs to choose from, youre sure to find one that suits your needs. And with animations and unique photos, illustrations, and fonts, you can make your presentation pop. So whether youre giving a sales pitch or presenting to the board, make sure to check out Slidegeeks first.

Techniques To Monitor Transactions Mis Report Highlighting Risk And Fraud Metrics Structure PDF
The following slide depicts management information system MIS report highlighting risk and fraud metrics. It provides information about regulatory environment, risk analysis, high risk customers, suspicious transaction reporting STR, transaction monitoring alerts, etc. Slidegeeks has constructed Techniques To Monitor Transactions Mis Report Highlighting Risk And Fraud Metrics Structure PDF after conducting extensive research and examination. These presentation templates are constantly being generated and modified based on user preferences and critiques from editors. Here, you will find the most attractive templates for a range of purposes while taking into account ratings and remarks from users regarding the content. This is an excellent jumping-off point to explore our content and will give new users an insight into our top-notch PowerPoint Templates.

Core Components Of Strategic Brand Administration Highlighting Key Metrics To Track Elements PDF
This slide provides information regarding key metrics to track brand awareness through impressions, brand mentions, post engagement, page likes, page views, post reach, story reach, recommendations, etc. Slidegeeks is here to make your presentations a breeze with Core Components Of Strategic Brand Administration Highlighting Key Metrics To Track Elements PDF With our easy-to-use and customizable templates, you can focus on delivering your ideas rather than worrying about formatting. With a variety of designs to choose from, you are sure to find one that suits your needs. And with animations and unique photos, illustrations, and fonts, you can make your presentation pop. So whether you are giving a sales pitch or presenting to the board, make sure to check out Slidegeeks first

Streamlining Operations Through Clothing Business Strategy Track Metrics To Analyze Social Media Pictures PDF
This slide showcases key indicators to track and analyze social media engagement. The metrics covered are reach, impressions, audience growth rate, click-through and average engagement rate, share of voice and conversion rate. Slidegeeks is here to make your presentations a breeze with Streamlining Operations Through Clothing Business Strategy Track Metrics To Analyze Social Media Pictures PDF With our easy to use and customizable templates, you can focus on delivering your ideas rather than worrying about formatting. With a variety of designs to choose from, you are sure to find one that suits your needs. And with animations and unique photos, illustrations, and fonts, you can make your presentation pop. So whether you are giving a sales pitch or presenting to the board, make sure to check out Slidegeeks first.
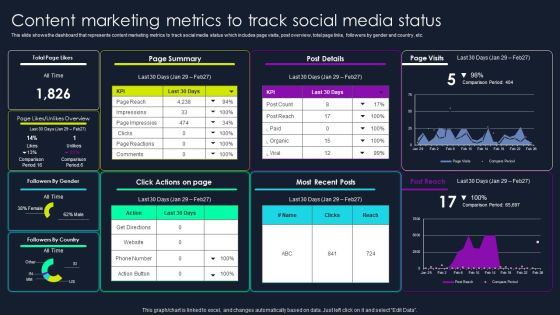
Lead Nurturing Tactics For Lead Generation Content Marketing Metrics To Track Social Media Status Topics PDF
This slide shows the dashboard that represents content marketing metrics to track social media status which includes page visits, post overview, total page links, followers by gender and country, etc. Slidegeeks is here to make your presentations a breeze with Lead Nurturing Tactics For Lead Generation Content Marketing Metrics To Track Social Media Status Topics PDF With our easy to use and customizable templates, you can focus on delivering your ideas rather than worrying about formatting. With a variety of designs to choose from, you are sure to find one that suits your needs. And with animations and unique photos, illustrations, and fonts, you can make your presentation pop. So whether you are giving a sales pitch or presenting to the board, make sure to check out Slidegeeks first.

Apparel Ecommerce Business Strategy Track Metrics To Analyze Social Media Engagement Portrait PDF
This slide showcases key indicators to track and analyze social media engagement. The metrics covered are reach, impressions, audience growth rate, click through and average engagement rate, share of voice and conversion rate. Slidegeeks is here to make your presentations a breeze with Apparel Ecommerce Business Strategy Track Metrics To Analyze Social Media Engagement Portrait PDF With our easy to use and customizable templates, you can focus on delivering your ideas rather than worrying about formatting. With a variety of designs to choose from, you are sure to find one that suits your needs. And with animations and unique photos, illustrations, and fonts, you can make your presentation pop. So whether you are giving a sales pitch or presenting to the board, make sure to check out Slidegeeks first.
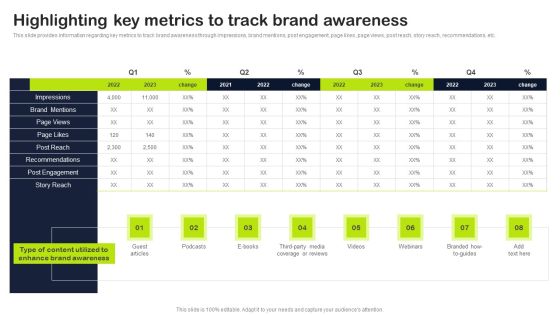
Key Elements Of Strategic Brand Administration Highlighting Key Metrics To Track Brand Awareness Demonstration PDF
This slide provides information regarding key metrics to track brand awareness through impressions, brand mentions, post engagement, page likes, page views, post reach, story reach, recommendations, etc. Slidegeeks has constructed Key Elements Of Strategic Brand Administration Highlighting Key Metrics To Track Brand Awareness Demonstration PDF after conducting extensive research and examination. These presentation templates are constantly being generated and modified based on user preferences and critiques from editors. Here, you will find the most attractive templates for a range of purposes while taking into account ratings and remarks from users regarding the content. This is an excellent jumping-off point to explore our content and will give new users an insight into our top-notch PowerPoint Templates.
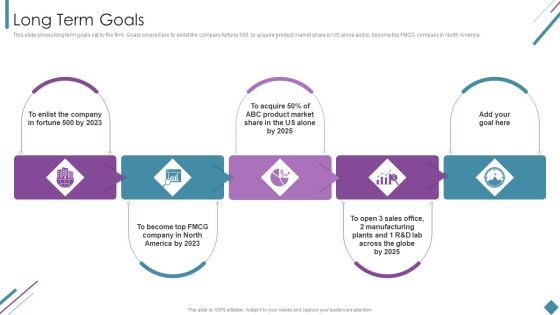
Metrics To Measure Business Performance Long Term Goals Ppt Gallery Templates PDF
This slide shows long term goals set by the firm. Goals covered are to enlist the company fortune 500, to acquire product market share in US alone and to become top FMCG company in North America. Presenting Metrics To Measure Business Performance Long Term Goals Ppt Gallery Templates PDF to provide visual cues and insights. Share and navigate important information on five stages that need your due attention. This template can be used to pitch topics like Product Market, Sales Office, Goal. In addtion, this PPT design contains high resolution images, graphics, etc, that are easily editable and available for immediate download.
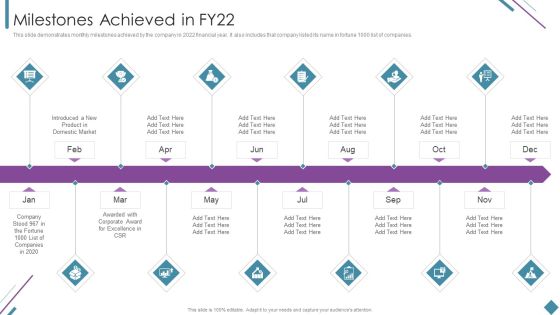
Metrics To Measure Business Performance Milestones Achieved In Fy22 Introduction PDF
This slide demonstrates monthly milestones achieved by the company in 2022 financial year. It also includes that company listed its name in fortune 1000 list of companies. This is a Metrics To Measure Business Performance Milestones Achieved In Fy22 Introduction PDF template with various stages. Focus and dispense information on twelve stages using this creative set, that comes with editable features. It contains large content boxes to add your information on topics like Corporate Award, Excellence CSR, Introduced New Product, Domestic Market. You can also showcase facts, figures, and other relevant content using this PPT layout. Grab it now.
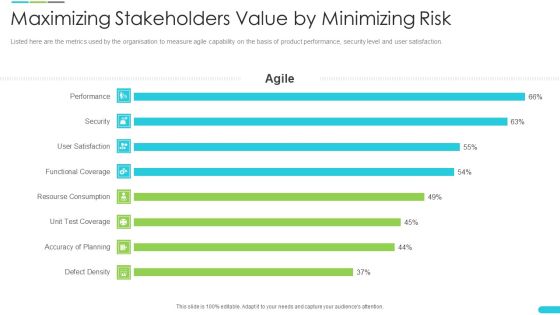
Discipline Agile Delivery Software Development Maximizing Stakeholders Value By Minimizing Risk Metrics Pictures PDF
This graph includes various factors that deal with the disciplined agile delivery resulting decrease in risk and increase in value throughout the project. Deliver an awe-inspiring pitch with this creative discipline agile delivery software development maximizing stakeholders value by minimizing risk metrics pictures pdf bundle. Topics like maximizing stakeholders value by minimizing risk can be discussed with this completely editable template. It is available for immediate download depending on the needs and requirements of the user.

Agile Development Approach IT Metrics For Effective Use Of Agile Methodology Icons PDF
Presenting Agile Development Approach IT Metrics For Effective Use Of Agile Methodology Icons PDF to provide visual cues and insights. Share and navigate important information on eight stages that need your due attention. This template can be used to pitch topics like Drag Factor, Velocity, Bugs Discovered, Previous Iterations, Prior Version. In addtion, this PPT design contains high resolution images, graphics, etc, that are easily editable and available for immediate download.

KPI Metrics Dashboard To Measure Automation Performance In Customer Support Professional PDF
The following slide outlines a comprehensive KPI dashboard which can be used by the organization to measure the automation performance in customer support department. It covers kpis such as customer retention, costs per support, customer satisfaction, etc. Deliver and pitch your topic in the best possible manner with this KPI Metrics Dashboard To Measure Automation Performance In Customer Support Professional PDF. Use them to share invaluable insights on Customer Retention, Cost Per Support, Support Costs To Revenue and impress your audience. This template can be altered and modified as per your expectations. So, grab it now.

KPI Metrics Dashboard To Measure Automation Performance Achieving Operational Efficiency Guidelines PDF
The following slide outlines a comprehensive KPI dashboard which can be used by the organization to measure the automation performance in customer support department. It covers kpis such as customer retention, costs per support, customer satisfaction, etcDeliver and pitch your topic in the best possible manner with this KPI Metrics Dashboard To Measure Automation Performance Achieving Operational Efficiency Guidelines PDF. Use them to share invaluable insights on Customer Retention, Cost Per Support, Request Volume and impress your audience. This template can be altered and modified as per your expectations. So, grab it now.

Sales Implementation Report With Metrics Ppt PowerPoint Presentation Portfolio Aids PDF
Pitch your topic with ease and precision using this sales implementation report with metrics ppt powerpoint presentation portfolio aids pdf. This layout presents information on key sales objectives, key management objectives, challenges to overcome, capture new accounts, increase penetration. It is also available for immediate download and adjustment. So, changes can be made in the color, design, graphics or any other component to create a unique layout.
WQM System Water Management KPI Metrics Showing Domestic Water Consumption Icons PDF
Presenting this set of slides with name wqm system water management kpi metrics showing domestic water consumption icons pdf. This is a three stage process. The stages in this process are percentage population having access, piped drinking water, water delivery, customers meeting who guidelines, water quality , per capita domestic water consumption. This is a completely editable PowerPoint presentation and is available for immediate download. Download now and impress your audience.
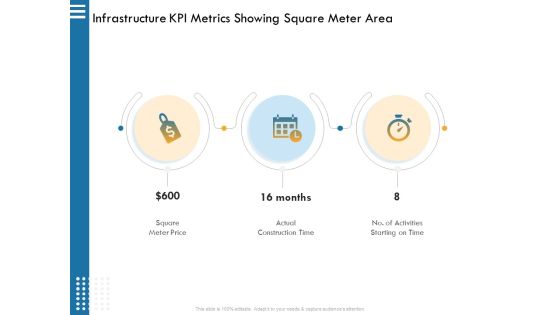
IT Infrastructure Governance Infrastructure KPI Metrics Showing Square Meter Area Ppt Infographics Guide PDF
Presenting it infrastructure governance infrastructure kpi metrics showing square meter area ppt infographics guide pdf. to provide visual cues and insights. Share and navigate important information on three stages that need your due attention. This template can be used to pitch topics like square meter price actual, construction time, no. activities starting time. In addtion, this PPT design contains high resolution images, graphics, etc, that are easily editable and available for immediate download.
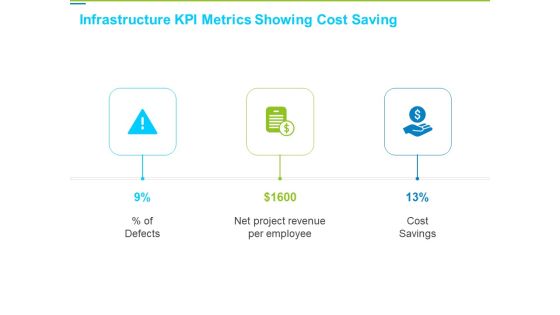
Framework Administration Infrastructure Kpi Metrics Showing Cost Saving Ppt Styles Master Slide PDF
This is a framework administration infrastructure kpi metrics showing cost saving ppt styles master slide pdf template with various stages. Focus and dispense information on three stages using this creative set, that comes with editable features. It contains large content boxes to add your information on topics like net project revenue per employee, cost savings, defects. You can also showcase facts, figures, and other relevant content using this PPT layout. Grab it now.

Framework Administration Infrastructure KPI Metrics Showing Square Meter Area Elements PDF
Presenting framework administration infrastructure kpi metrics showing square meter area elements pdf to provide visual cues and insights. Share and navigate important information on three stages that need your due attention. This template can be used to pitch topics like square meter price, actual construction time, no. of activities starting on time. In addition, this PPT design contains high-resolution images, graphics, etc, that are easily editable and available for immediate download.
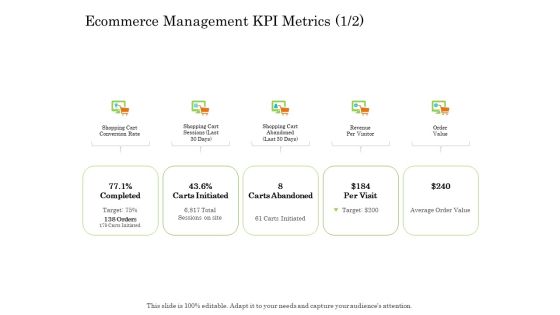
Online Trade Management System Ecommerce Management KPI Metrics Delivery Ppt Layouts Gallery PDF
This is a online trade management system ecommerce management kpi metrics delivery ppt layouts gallery pdf template with various stages. Focus and dispense information on four stages using this creative set, that comes with editable features. It contains large content boxes to add your information on topics like average order value, gross profit margin, cart abandonment, viral coefficient. You can also showcase facts, figures, and other relevant content using this PPT layout. Grab it now.

Facility Management Infrastructure KPI Metrics Showing Square Meter Area Ppt Inspiration Example PDF
Presenting facility management infrastructure kpi metrics showing square meter area ppt inspiration example pdf to provide visual cues and insights. Share and navigate important information on three stages that need your due attention. This template can be used to pitch topics like square meter price, actual construction time, no of activities starting on time. In addtion, this PPT design contains high resolution images, graphics, etc, that are easily editable and available for immediate download.
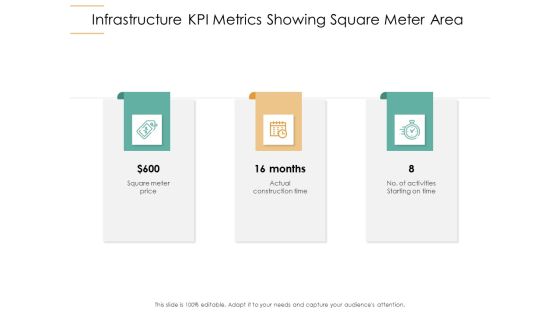
Infrastructure Strategies Infrastructure KPI Metrics Showing Square Meter Area Ppt Outline Graphics Pictures PDF
Presenting infrastructure strategies infrastructure kpi metrics showing square meter area ppt outline graphics pictures pdf to provide visual cues and insights. Share and navigate important information on three stages that need your due attention. This template can be used to pitch topics like square meter price, actual construction time, no of activities starting on time. In addtion, this PPT design contains high resolution images, graphics, etc, that are easily editable and available for immediate download.
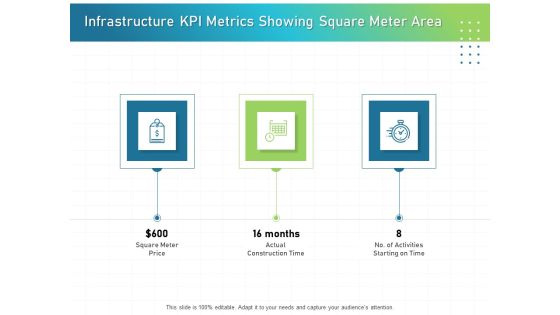
IT Infrastructure Administration Infrastructure KPI Metrics Showing Square Meter Area Guidelines PDF
Presenting it infrastructure administration infrastructure kpi metrics showing square meter area guidelines pdf to provide visual cues and insights. Share and navigate important information on three stages that need your due attention. This template can be used to pitch topics like square meter price, actual construction time, no of activities starting on time. In addtion, this PPT design contains high resolution images, graphics, etc, that are easily editable and available for immediate download.
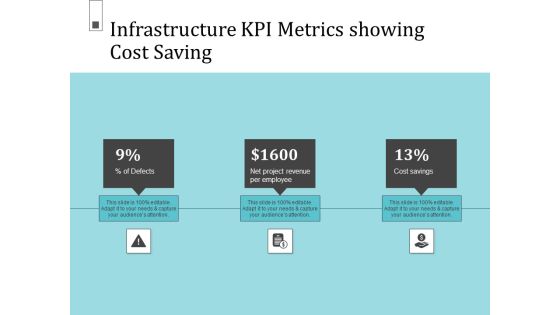
Infrastructure Project Management In Construction Infrastructure KPI Metrics Showing Cost Saving Background PDF
This is a infrastructure project management in construction infrastructure kpi metrics showing cost saving background pdf. template with various stages. Focus and dispense information on three stages using this creative set, that comes with editable features. It contains large content boxes to add your information on topics like net project revenue per employee, cost savings. You can also showcase facts, figures, and other relevant content using this PPT layout. Grab it now.

Infrastructure Project Management In Construction Infrastructure KPI Metrics Showing Square Meter Area Portrait PDF
Presenting infrastructure project management in construction infrastructure kpi metrics showing square meter area portrait pdf. to provide visual cues and insights. Share and navigate important information on three stages that need your due attention. This template can be used to pitch topics like Square Meter Price, Actual Construction Time. In addtion, this PPT design contains high resolution images, graphics, etc, that are easily editable and available for immediate download.

Customer Relationship Management Dashboard Customer Relationship Management KPI Metrics Form Elements PDF
Presenting customer relationship management dashboard customer relationship management kpi metrics form elements pdf to provide visual cues and insights. Share and navigate important information on four stages that need your due attention. This template can be used to pitch topics like customer, feedback form, total orders, mails in 30 days. In addtion, this PPT design contains high resolution images, graphics, etc, that are easily editable and available for immediate download.
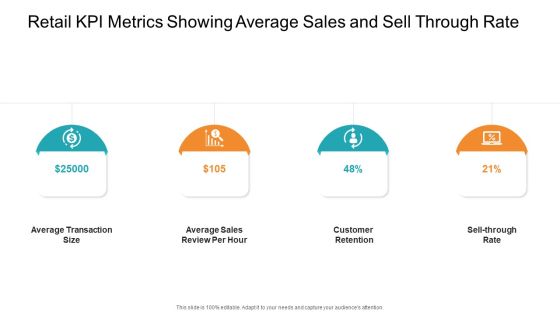
Retail KPI Metrics Showing Average Sales And Sell Through Rate Sample PDF
Presenting retail kpi metrics showing average sales and sell through rate sample pdf. to provide visual cues and insights. Share and navigate important information on four stages that need your due attention. This template can be used to pitch topics like average transaction size, average sales, review per hour, customer retention. In addtion, this PPT design contains high resolution images, graphics, etc, that are easily editable and available for immediate download.

Business Activities Assessment Examples Infrastructure KPI Metrics Showing Square Meter Area Elements PDF
Presenting business activities assessment examples infrastructure kpi metrics showing square meter area elements pdf to provide visual cues and insights. Share and navigate important information on three stages that need your due attention. This template can be used to pitch topics like square meter price, actual construction time, activities starting on time. In addtion, this PPT design contains high resolution images, graphics, etc, that are easily editable and available for immediate download.
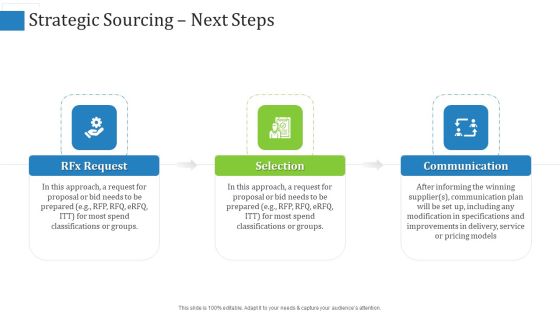
Supply Chain Management Operational Metrics Strategic Sourcing Next Steps Demonstration PDF
This is a supply chain management operational metrics strategic sourcing next steps demonstration pdf. template with various stages. Focus and dispense information on three stages using this creative set, that comes with editable features. It contains large content boxes to add your information on topics like rfx request, selection, communication. You can also showcase facts, figures, and other relevant content using this PPT layout. Grab it now.

Supply Chain Management Operational Metrics Understanding The Spent Category Brochure PDF
This is a supply chain management operational metrics understanding the spent category brochure pdf. template with various stages. Focus and dispense information on five stages using this creative set, that comes with editable features. It contains large content boxes to add your information on topics like expenditures by the supplier, future demand projections or budgets. You can also showcase facts, figures, and other relevant content using this PPT layout. Grab it now.

Supply Chain Management Operational Metrics Common Problems With SCM Ppt Outline Tips PDF
This is a supply chain management operational metrics common problems with SCM ppt outline tips pdf. template with various stages. Focus and dispense information on seven stages using this creative set, that comes with editable features. It contains large content boxes to add your information on topics like transaction errors, information delays, misplaced inventory. You can also showcase facts, figures, and other relevant content using this PPT layout. Grab it now.
Supply Chain Management Operational Metrics Company Timeline Ppt Icon Skills PDF
Presenting supply chain management operational metrics company timeline ppt icon skills pdf. to provide visual cues and insights. Share and navigate important information on seven stages that need your due attention. This template can be used to pitch topics like inbound storage transport data, outbound storage transport data, operation. In addtion, this PPT design contains high resolution images, graphics, etc, that are easily editable and available for immediate download.

Customer Relationship Management Action Plan Customer Relationship Management KPI Metrics Gride Themes PDF
Presenting customer relationship management action plan customer relationship management kpi metrics gride themes pdf to provide visual cues and insights. Share and navigate important information on five stages that need your due attention. This template can be used to pitch topics like total leads, open roles, suitable leads, recent hires. In addtion, this PPT design contains high resolution images, graphics, etc, that are easily editable and available for immediate download.

Customer Relationship Management Action Plan Customer Relationship Management KPI Metrics Icon Pictures PDF
Presenting customer relationship management action plan customer relationship management kpi metrics icon pictures pdf to provide visual cues and insights. Share and navigate important information on four stages that need your due attention. This template can be used to pitch topics like customers, feedback form, total orders. In addtion, this PPT design contains high resolution images, graphics, etc, that are easily editable and available for immediate download.

Retail KPI Metrics Showing Average Sales And Sell Through Rate Ppt Portfolio Skills PDF
This is a retail kpi metrics showing average sales and sell through rate ppt portfolio skills pdf. template with various stages. Focus and dispense information on four stages using this creative set, that comes with editable features. It contains large content boxes to add your information on topics like average transaction size, average sales review per hour. You can also showcase facts, figures, and other relevant content using this PPT layout. Grab it now.

Infrastructure Building Administration Infrastructure KPI Metrics Showing Cost Saving Demonstration PDF
This is a infrastructure building administration infrastructure kpi metrics showing cost saving demonstration pdf template with various stages. Focus and dispense information on three stages using this creative set, that comes with editable features. It contains large content boxes to add your information on topics like project revenue per employee, savings, cost defects. You can also showcase facts, figures, and other relevant content using this PPT layout. Grab it now.
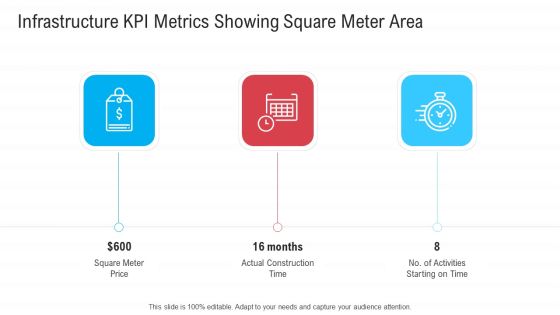
Infrastructure Designing And Administration Infrastructure KPI Metrics Showing Square Meter Area Guidelines PDF
Presenting infrastructure designing and administration infrastructure kpi metrics showing square meter area guidelines pdf to provide visual cues and insights. Share and navigate important information on three stages that need your due attention. This template can be used to pitch topics like square meter price, actual construction time, no of activities starting on time. In addtion, this PPT design contains high resolution images, graphics, etc, that are easily editable and available for immediate download.
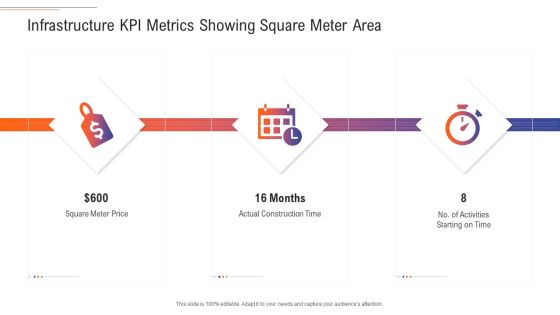
Support Services Management Infrastructure KPI Metrics Showing Square Meter Area Ideas PDF
Presenting support services management infrastructure kpi metrics showing square meter area ideas pdf to provide visual cues and insights. Share and navigate important information on three stages that need your due attention. This template can be used to pitch topics like square meter price, actual construction time, no of activities starting on time. In addtion, this PPT design contains high resolution images, graphics, etc, that are easily editable and available for immediate download.

Pharmaceutical Management Healthcare Management KPI Metrics Showing Incidents Length Of Stay Ppt Gallery Example PDF
This is a pharmaceutical management healthcare management kpi metrics showing incidents length of stay ppt gallery example pdf template with various stages. Focus and dispense information on four stages using this creative set, that comes with editable features. It contains large content boxes to add your information on topics like incidents, average waiting time, avg length of stay, overall patient satisfaction. You can also showcase facts, figures, and other relevant content using this PPT layout. Grab it now.

Pharmaceutical Management Healthcare Management KPI Metrics Showing Treatment Cost And Waiting Time Ppt Ideas Format PDF
Presenting pharmaceutical management healthcare management kpi metrics showing treatment cost and waiting time ppt ideas format pdf to provide visual cues and insights. Share and navigate important information on three stages that need your due attention. This template can be used to pitch topics like average treatment cost all ages, average nurse patient ratio, average time to see a doctor. In addtion, this PPT design contains high resolution images, graphics, etc, that are easily editable and available for immediate download.

Metrics To Evaluate Impact Of Personal Brand Reputation Management Rules PDF
This slide presents individual branding statistical analysis, helpful in highlighting key trends in their marketing and promotion. It includes reach, page visits, engagement and subscribers Presenting Metrics To Evaluate Impact Of Personal Brand Reputation Management Rules PDF to dispense important information. This template comprises four stages. It also presents valuable insights into the topics including Reach, Engagement, Subscribers. This is a completely customizable PowerPoint theme that can be put to use immediately. So, download it and address the topic impactfully.

Engineering Performance Metrics Dashboard To Track Cloud Services Cost Clipart PDF
This slide covers engineering KPI dashboard to track cost of cloud services. It involves KPIs such as average delay of product, cost of cloud services, pageview by browser and pull requests by projects. Showcasing this set of slides titled Engineering Performance Metrics Dashboard To Track Cloud Services Cost Clipart PDF. The topics addressed in these templates are Cost Of Cloud Services, Average, Product. All the content presented in this PPT design is completely editable. Download it and make adjustments in color, background, font etc. as per your unique business setting.
Enterprise Sustainability Performance Metrics Product Pricing Strategy We Will Adopt Brochure PDF
This slide shows current and future product pricing strategy of the company. In current strategy, company opted cost plus pricing to recover their profits and in future they will opt penetration pricing for capturing market share.Deliver and pitch your topic in the best possible manner with this Enterprise Sustainability Performance Metrics Product Pricing Strategy We Will Adopt Brochure PDF. Use them to share invaluable insights on Competitor, Desired Margin, Money Product and impress your audience. This template can be altered and modified as per your expectations. So, grab it now.
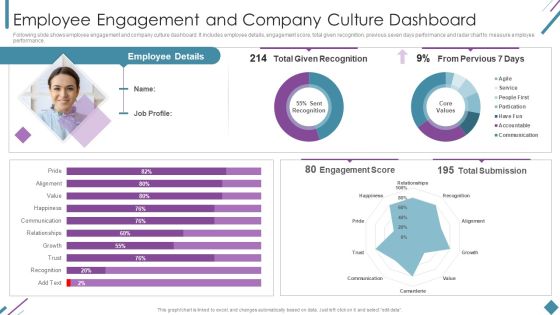
Metrics To Measure Business Performance Employee Engagement And Company Culture Demonstration PDF
Following slide shows employee engagement and company culture dashboard. It includes employee details, engagement score, total given recognition, previous seven days performance and radar chart to measure employee performance. Deliver and pitch your topic in the best possible manner with this Metrics To Measure Business Performance Employee Engagement And Company Culture Demonstration PDF. Use them to share invaluable insights on Employee Details, Total Given Recognition, Engagement Score and impress your audience. This template can be altered and modified as per your expectations. So, grab it now.
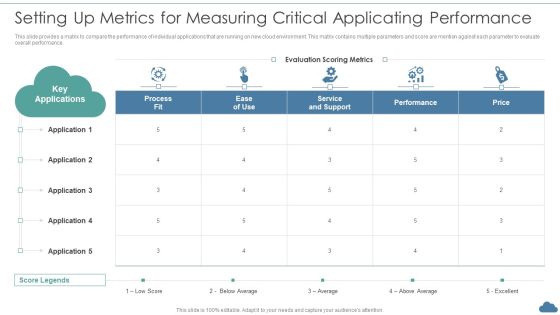
Cloud Optimization Infrastructure Model Setting Up Metrics For Measuring Critical Applicating Performance Ideas PDF
This slide provides a matrix to compare the performance of individual applications that are running on new cloud environment. This matrix contains multiple parameters and score are mention against each parameter to evaluate overall performance.Deliver and pitch your topic in the best possible manner with this Cloud Optimization Infrastructure Model Setting Up Metrics For Measuring Critical Applicating Performance Ideas PDF Use them to share invaluable insights on Key Applications, Evaluation Scoring, Service Support and impress your audience. This template can be altered and modified as per your expectations. So, grab it now.
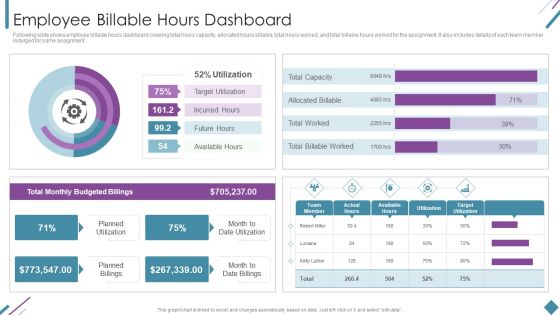
Metrics To Measure Business Performance Employee Billable Hours Dashboard Diagrams PDF
Following slide shows employee billable hours dashboard covering total hours capacity, allocated hours billable, total hours worked, and total billable hours worked for the assignment. It also includes details of each team member indulged for same assignment. Deliver an awe inspiring pitch with this creative Metrics To Measure Business Performance Employee Billable Hours Dashboard Diagrams PDF bundle. Topics like Total Monthly, Budgeted Billings, Planned Utilization can be discussed with this completely editable template. It is available for immediate download depending on the needs and requirements of the user.
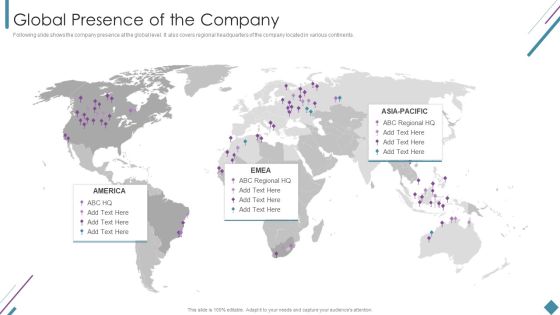
Metrics To Measure Business Performance Global Presence Of The Company Demonstration PDF
Following slide shows the company presence at the global level. It also covers regional headquarters of the company located in various continents. Presenting Metrics To Measure Business Performance Global Presence Of The Company Demonstration PDF to provide visual cues and insights. Share and navigate important information on one stages that need your due attention. This template can be used to pitch topics like Global Presence. In addtion, this PPT design contains high resolution images, graphics, etc, that are easily editable and available for immediate download.

Metrics To Measure Business Performance Short Term Goals Ppt Portfolio Good PDF
This slide covers the short term goals set by the firm for FY20. Goals covered are to capture competitors market share, reduce churn rate, increase sales revenue and to invest in CSR activities. This is a Metrics To Measure Business Performance Short Term Goals Ppt Portfolio Good PDF template with various stages. Focus and dispense information on five stages using this creative set, that comes with editable features. It contains large content boxes to add your information on topics like Reduce Customer Churn, Growth, Invest, Sales Revenue. You can also showcase facts, figures, and other relevant content using this PPT layout. Grab it now.
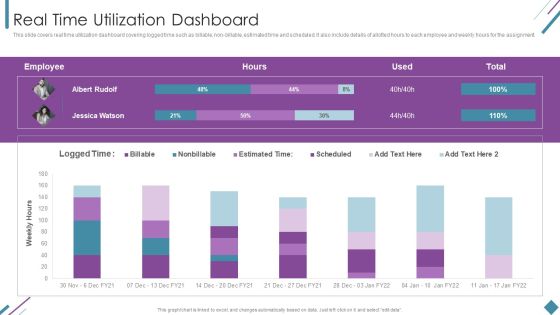
Metrics To Measure Business Performance Real Time Utilization Dashboard Topics PDF
This slide covers real time utilization dashboard covering logged time such as billable, non-billable, estimated time and scheduled. It also include details of allotted hours to each employee and weekly hours for the assignment. Deliver an awe inspiring pitch with this creative Metrics To Measure Business Performance Real Time Utilization Dashboard Topics PDF bundle. Topics like Weekly Hours, Employee, Estimated Time can be discussed with this completely editable template. It is available for immediate download depending on the needs and requirements of the user.
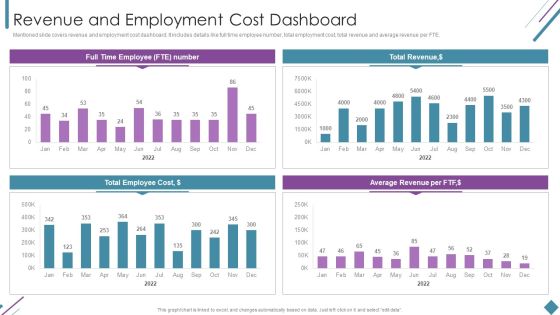
Metrics To Measure Business Performance Revenue And Employment Cost Dashboard Clipart PDF
Mentioned slide covers revenue and employment cost dashboard. It includes details like full time employee number, total employment cost, total revenue and average revenue per FTE. Deliver and pitch your topic in the best possible manner with this Metrics To Measure Business Performance Revenue And Employment Cost Dashboard Clipart PDF. Use them to share invaluable insights on Total Revenue, Average Revenue Per, Total Employee Cost and impress your audience. This template can be altered and modified as per your expectations. So, grab it now.
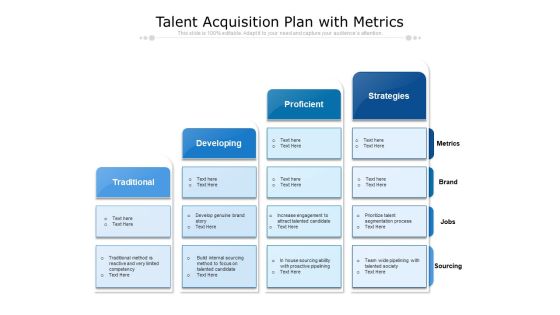
Talent Acquisition Plan With Metrics Ppt PowerPoint Presentation File Brochure PDF
Persuade your audience using this talent acquisition plan with metrics ppt powerpoint presentation file brochure pdf. This PPT design covers four stages, thus making it a great tool to use. It also caters to a variety of topics including traditional, developing, proficient, strategies. Download this PPT design now to present a convincing pitch that not only emphasizes the topic but also showcases your presentation skills.

Account Payable Metrics To Quantify Performance Of Invoice Process Management Designs PDF
This slide showcases various KPIs to measure performance of invoice process in organization to increase its efficiency. It includes key components such as processing time, cost, exception rate, working capital, discount captured, etc. Presenting Account Payable Metrics To Quantify Performance Of Invoice Process Management Designs PDF to dispense important information. This template comprises six stages. It also presents valuable insights into the topics including Invoice Processing Time, Cost to Process, Exception Rate, Working Capital. This is a completely customizable PowerPoint theme that can be put to use immediately. So, download it and address the topic impactfully.

Performance Metrics To Analyze The Impact Of Event Marketing Structure PDF
This slide showcases the key indicators used to track the impact of event advertising. Major KPIs covered are cost per lead, post-event conversions, total registrations, gross revenue and audience engagement. The best PPT templates are a great way to save time, energy, and resources. Slidegeeks have 100 percent editable powerpoint slides making them incredibly versatile. With these quality presentation templates, you can create a captivating and memorable presentation by combining visually appealing slides and effectively communicating your message. Download Performance Metrics To Analyze The Impact Of Event Marketing Structure PDF from Slidegeeks and deliver a wonderful presentation.

Key Performance Indicators Of The Internal Metrics Audit Function Infographics PDF
This slide defines the graphical representation of internal audit key performance indicators. It is a comparison of the means used to evaluate the performance of the internal audit function. Pitch your topic with ease and precision using this Key Performance Indicators Of The Internal Metrics Audit Function Infographics PDF. This layout presents information on High Variance, Budget To Actual, Audit Functions. It is also available for immediate download and adjustment. So, changes can be made in the color, design, graphics or any other component to create a unique layout.

CRM Performance Metrics Dashboard Showing Sales In Real Estate Customer Information PDF
This slide represents the dashboard showing the sales performance of a real estate company. It includes details related top 5 agents US sales, sales vs target per agent, top 5 banks-sold units, sales by top 5 agencies. Pitch your topic with ease and precision using this CRM Performance Metrics Dashboard Showing Sales In Real Estate Customer Information PDF. This layout presents information on Us Sales, Sold Units, Target Per Agent. It is also available for immediate download and adjustment. So, changes can be made in the color, design, graphics or any other component to create a unique layout.

KPI Metrics Dashboard To Evaluate Facebook Video Campaign Performance Elements PDF
The following slide outlines a comprehensive KPI dashboard which can be used to analyze the performance of Facebook video campaign. It provides information about page video views, page video views organic etc.Deliver and pitch your topic in the best possible manner with this KPI Metrics Dashboard To Evaluate Facebook Video Campaign Performance Elements PDF. Use them to share invaluable insights on Custom Range, Page Video, Views Paid and impress your audience. This template can be altered and modified as per your expectations. So, grab it now.
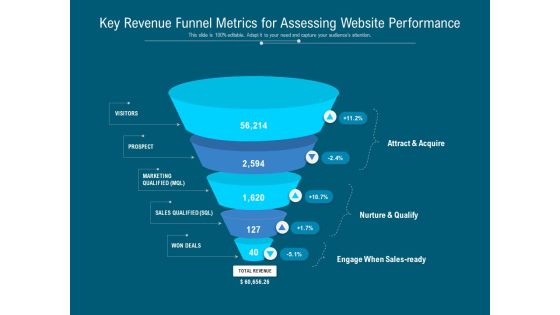
Key Revenue Funnel Metrics For Assessing Website Performance Ppt PowerPoint Presentation Infographics Master Slide PDF
Persuade your audience using this key revenue funnel metrics for assessing website performance ppt powerpoint presentation infographics master slide pdf. This PPT design covers five stages, thus making it a great tool to use. It also caters to a variety of topics including visitors, prospect, marketing qualified mql, sales qualified sql, won deals, attract and acquire, nurture and qualify, engage when sales ready. Download this PPT design now to present a convincing pitch that not only emphasizes the topic but also showcases your presentation skills.

Enterprise Sustainability Performance Metrics Domestic Presence Of The Company Structure PDF
This slide illustrates domestic presence of the firm. It also covers details of the manufacturing plant and sales office located at different locations.This is a Enterprise Sustainability Performance Metrics Domestic Presence Of The Company Structure PDF template with various stages. Focus and dispense information on one stage using this creative set, that comes with editable features. It contains large content boxes to add your information on topics like Domestic Presence, Company. You can also showcase facts, figures, and other relevant content using this PPT layout. Grab it now.
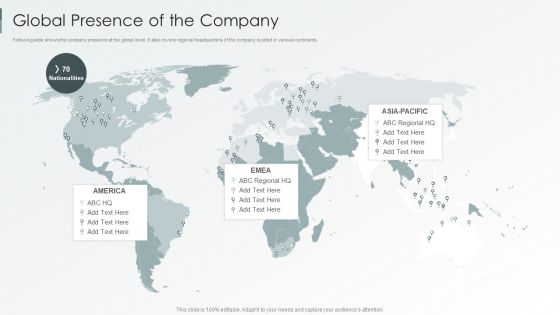
Enterprise Sustainability Performance Metrics Global Presence Of The Company Microsoft PDF
Following slide shows the company presence at the global level. It also covers regional headquarters of the company located in various continents.This is a Enterprise Sustainability Performance Metrics Global Presence Of The Company Microsoft PDF template with various stages. Focus and dispense information on one stage using this creative set, that comes with editable features. It contains large content boxes to add your information on topics like Global Presence, Company. You can also showcase facts, figures, and other relevant content using this PPT layout. Grab it now.

Strategic Guide To Build Brand Personality Highlighting Performance Metrics To Track Brand Awareness Summary PDF
Coming up with a presentation necessitates that the majority of the effort goes into the content and the message you intend to convey. The visuals of a PowerPoint presentation can only be effective if it supplements and supports the story that is being told. Keeping this in mind our experts created Strategic Guide To Build Brand Personality Highlighting Performance Metrics To Track Brand Awareness Summary PDF to reduce the time that goes into designing the presentation. This way, you can concentrate on the message while our designers take care of providing you with the right template for the situation.

Service Improvement Techniques For Client Retention Dashboard Depicting Performance Metrics Diagrams PDF
This slide provides an overview of customer feedback survey conducted to evaluate their satisfaction level. It includes description, steps and benefits which are measure customer satisfaction This modern and well arranged Service Improvement Techniques For Client Retention Dashboard Depicting Performance Metrics Diagrams PDF provides lots of creative possibilities. It is very simple to customize and edit with the Powerpoint Software. Just drag and drop your pictures into the shapes. All facets of this template can be edited with Powerpoint no extra software is necessary. Add your own material, put your images in the places assigned for them, adjust the colors, and then you can show your slides to the world, with an animated slide included.
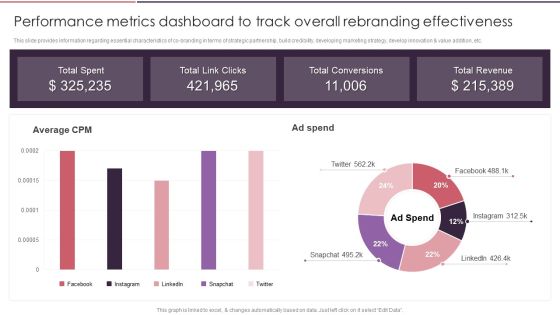
Rebranding Brand Fresh Face Development Performance Metrics Dashboard To Track Overall Rules PDF
This slide provides information regarding essential characteristics of co-branding in terms of strategic partnership, build credibility, developing marketing strategy, develop innovation and value addition, etc. Coming up with a presentation necessitates that the majority of the effort goes into the content and the message you intend to convey. The visuals of a PowerPoint presentation can only be effective if it supplements and supports the story that is being told. Keeping this in mind our experts created Rebranding Brand Fresh Face Development Performance Metrics Dashboard To Track Overall Rules PDF to reduce the time that goes into designing the presentation. This way, you can concentrate on the message while our designers take care of providing you with the right template for the situation.

Guidelines For Exhibiting Business Value Of Information And Technology Financial Fundamental Metrics IT Spend Mockup PDF
These indicators assist IT leaders in stewarding technology expenditures and investments, and they are essential to managing the IT company. These measures aid in the management of the departments financial health and may indicate levers for cost reduction, improved resource allocation, and enhanced accountability. Deliver an awe inspiring pitch with this creative guidelines for exhibiting business value of information and technology financial fundamental metrics it spend mockup pdf bundle. Topics like metric, organizations, budget, demonstrate can be discussed with this completely editable template. It is available for immediate download depending on the needs and requirements of the user.

IT Value Story Significant To Corporate Leadership Financial Fundamental Metrics Diagrams PDF
These indicators assist IT leaders in stewarding technology expenditures and investments, and they are essential to managing the IT company. These measures aid in the management of the departments financial health and may indicate levers for cost reduction, improved resource allocation, and enhanced accountability. Deliver and pitch your topic in the best possible manner with this it value story significant to corporate leadership financial fundamental metrics diagrams pdf. Use them to share invaluable insights on organizations, budget, metric, cost and impress your audience. This template can be altered and modified as per your expectations. So, grab it now.
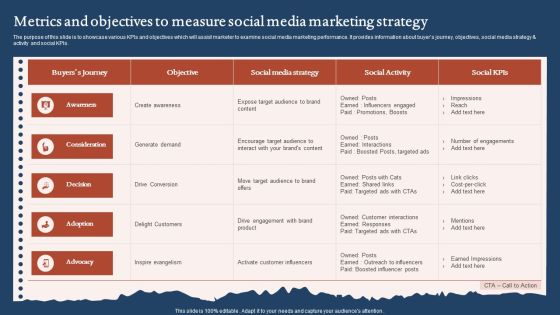
Metrics And Objectives To Measure Social Media Marketing Strategy Structure PDF
The purpose of this slide is to showcase various KPIs and objectives which will assist marketer to examine social media marketing performance. It provides information about buyers journey, objectives, social media strategy and activity and social KPIs. Pitch your topic with ease and precision using this Metrics And Objectives To Measure Social Media Marketing Strategy Structure PDF. This layout presents information on Awareness, Consideration, Advocacy. It is also available for immediate download and adjustment. So, changes can be made in the color, design, graphics or any other component to create a unique layout.

Strengthening Brand Performance Metrics Dashboard To Track Overall Rebranding Themes PDF
This slide provides information regarding essential characteristics of co-branding in terms of strategic partnership, build credibility, developing marketing strategy, develop innovation and value addition, etc. Coming up with a presentation necessitates that the majority of the effort goes into the content and the message you intend to convey. The visuals of a PowerPoint presentation can only be effective if it supplements and supports the story that is being told. Keeping this in mind our experts created Strengthening Brand Performance Metrics Dashboard To Track Overall Rebranding Themes PDF to reduce the time that goes into designing the presentation. This way, you can concentrate on the message while our designers take care of providing you with the right template for the situation.

Comprehensive Guide For Launch Performance Metrics To Analyze The Impact Of Event Diagrams PDF
This slide showcases the key indicators used to track the impact of event advertising. Major KPIs covered are cost per lead, post-event conversions, total registrations, gross revenue and audience engagement. Welcome to our selection of the Comprehensive Guide For Launch Performance Metrics To Analyze The Impact Of Event Diagrams PDF. These are designed to help you showcase your creativity and bring your sphere to life. Planning and Innovation are essential for any business that is just starting out. This collection contains the designs that you need for your everyday presentations. All of our PowerPoints are 100 percent editable, so you can customize them to suit your needs. This multi-purpose template can be used in various situations. Grab these presentation templates today.

Customer Acquisition And Conversion Key Metrics Dashboard Deploying Ecommerce Order Management Sample PDF
This slide represents the dashboard showing the key performance measures to analyze and monitor the customer acquisition and conversion rate. It includes details related to KPIs such as direct traffic, sessions by source, social networks, paid keywords etc.From laying roadmaps to briefing everything in detail, our templates are perfect for you. You can set the stage with your presentation slides. All you have to do is download these easy-to-edit and customizable templates. Customer Acquisition And Conversion Key Metrics Dashboard Deploying Ecommerce Order Management Sample PDF will help you deliver an outstanding performance that everyone would remember and praise you for. Do download this presentation today.

Internal Promotion Strategy To Enhance Brand Awareness Internal Marketing Metrics To Track Annual Brochure PDF
This slide shows various key performance indicators to evaluate yearly performance of internal marketing. It includes comparison of actual and expected performance. If your project calls for a presentation, then Slidegeeks is your go to partner because we have professionally designed, easy to edit templates that are perfect for any presentation. After downloading, you can easily edit Internal Promotion Strategy To Enhance Brand Awareness Internal Marketing Metrics To Track Annual Brochure PDF and make the changes accordingly. You can rearrange slides or fill them with different images. Check out all the handy templates
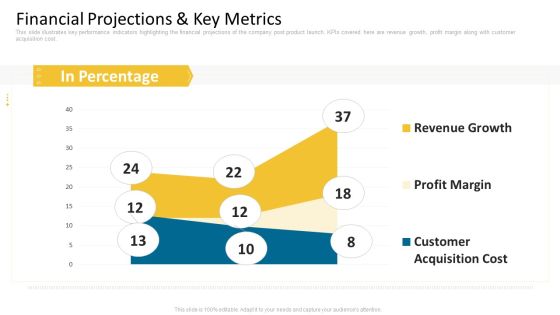
Guy Kawasaki New Venture Pitch PPT Financial Projections And Key Metrics Summary PDF
This slide illustrates key performance indicators highlighting the financial projections of the company post product launch. KPIs covered here are revenue growth, profit margin along with customer acquisition cost. Deliver and pitch your topic in the best possible manner with this guy kawasaki new venture pitch ppt financial projections and key metrics summary pdf. Use them to share invaluable insights on revenue growth, profit margin, customer acquisition cost and impress your audience. This template can be altered and modified as per your expectations. So, grab it now.
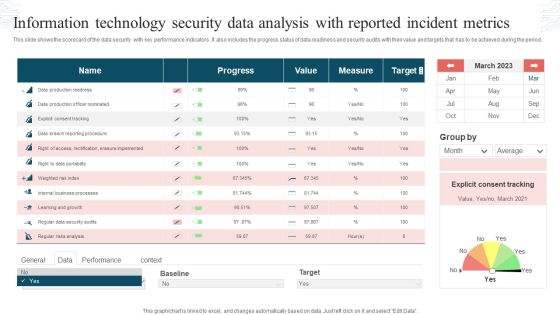
Information Technology Security Data Analysis With Reported Incident Metrics Rules PDF
This slide shows the scorecard of the data security with key performance indicators. It also includes the progress status of data readiness and security audits with their value and targets that has to be achieved during the period. Pitch your topic with ease and precision using this Information Technology Security Data Analysis With Reported Incident Metrics Rules PDF. This layout presents information on Progress, Value, Measure, Target. It is also available for immediate download and adjustment. So, changes can be made in the color, design, graphics or any other component to create a unique layout.

Company Financial Forecast And Essential Metrics Ppt Model Design Templates PDF
This slide shows the projections of the financials of a company with the key performance indicators to know exactly where the business stands and what needs to be enhanced or reduced to make the business profitable. Showcasing this set of slides titled Company Financial Forecast And Essential Metrics Ppt Model Design Templates PDF. The topics addressed in these templates are Budget, Income, Expense, 2018 To 2022. All the content presented in this PPT design is completely editable. Download it and make adjustments in color, background, font etc. as per your unique business setting.

Project Drivers Kpi Dashboard With Digital Marketing Metrics Ppt PowerPoint Presentation File Clipart PDF
This slide outlines the digital marketing project drivers dashboard which includes components such as growth, No. orders, revenue and EBITDA margin. It also provides information about the website traffic, conversion rate and new customers which can assist managers to track digital marketing performance. Showcasing this set of slides titled Project Drivers Kpi Dashboard With Digital Marketing Metrics Ppt PowerPoint Presentation File Clipart PDF. The topics addressed in these templates are Website Traffic, Conversion Rate, New Customers. All the content presented in this PPT design is completely editable. Download it and make adjustments in color, background, font etc. as per your unique business setting.

Recruitment Metrics For Data Driven Selection Process Ppt PowerPoint Presentation Inspiration Graphics Download PDF
This slide highlights the key performance indicators to analyze hiring process in organization which includes time to fill, first year attrition rate, cost per hire, candidate job satisfaction and interview to hire ratio. Persuade your audience using this Recruitment Metrics For Data-Driven Selection Process Ppt PowerPoint Presentation Inspiration Graphics Download PDF. This PPT design covers one stage, thus making it a great tool to use. It also caters to a variety of topics including Candidate Job, Satisfaction, Attrition Rate. Download this PPT design now to present a convincing pitch that not only emphasizes the topic but also showcases your presentation skills.
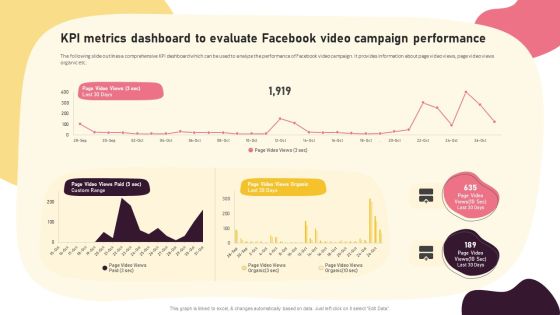
Video Promotion Techniques KPI Metrics Dashboard To Evaluate Facebook Video Introduction PDF
The following slide outlines a comprehensive KPI dashboard which can be used to analyze the performance of Facebook video campaign. It provides information about page video views, page video views organic etc. The best PPT templates are a great way to save time, energy, and resources. Slidegeeks have 100 percent editable powerpoint slides making them incredibly versatile. With these quality presentation templates, you can create a captivating and memorable presentation by combining visually appealing slides and effectively communicating your message. Download Video Promotion Techniques KPI Metrics Dashboard To Evaluate Facebook Video Introduction PDF from Slidegeeks and deliver a wonderful presentation.
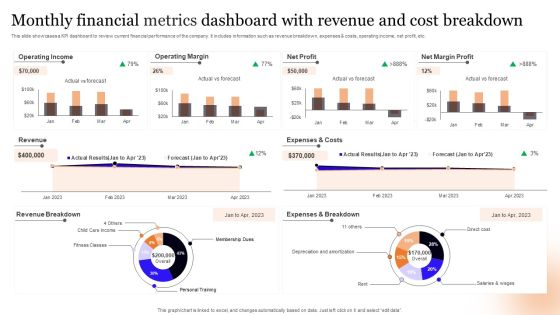
Monthly Financial Metrics Dashboard With Revenue And Cost Breakdown Information PDF
This slide showcases a KPI dashboard to review current financial performance of the company. It includes information such as revenue breakdown, expenses and costs, operating income, net profit, etc. Pitch your topic with ease and precision using this Monthly Financial Metrics Dashboard With Revenue And Cost Breakdown Information PDF. This layout presents information on Operating Income, Operating Margin, Net Profit. It is also available for immediate download and adjustment. So, changes can be made in the color, design, graphics or any other component to create a unique layout.
Performance Metrics For Project Management Office Ppt PowerPoint Presentation Complete Deck With Slides
This Performance Metrics For Project Management Office Ppt PowerPoint Presentation Complete Deck With Slides acts as backup support for your ideas, vision, thoughts, etc. Use it to present a thorough understanding of the topic. This PPT slideshow can be utilized for both in-house and outside presentations depending upon your needs and business demands. Entailing twelve slides with a consistent design and theme, this template will make a solid use case. As it is intuitively designed, it suits every business vertical and industry. All you have to do is make a few tweaks in the content or any other component to design unique presentations. The biggest advantage of this complete deck is that it can be personalized multiple times once downloaded. The color, design, shapes, and other elements are free to modify to add personal touches. You can also insert your logo design in this PPT layout. Therefore a well-thought and crafted presentation can be delivered with ease and precision by downloading this Performance Metrics For Project Management Office Ppt PowerPoint Presentation Complete Deck With Slides PPT slideshow.
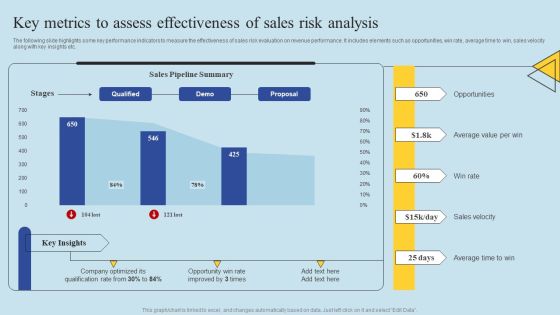
Determining Risks In Sales Administration Procedure Key Metrics To Assess Effectiveness Of Sales Pictures PDF
The following slide highlights some key performance indicators to measure the effectiveness of sales risk evaluation on revenue performance. It includes elements such as opportunities, win rate, average time to win, sales velocity along with key insights etc. This Determining Risks In Sales Administration Procedure Key Metrics To Assess Effectiveness Of Sales Pictures PDF from Slidegeeks makes it easy to present information on your topic with precision. It provides customization options, so you can make changes to the colors, design, graphics, or any other component to create a unique layout. It is also available for immediate download, so you can begin using it right away. Slidegeeks has done good research to ensure that you have everything you need to make your presentation stand out. Make a name out there for a brilliant performance.

Service Strategy Guide To Maximize Customer Experience Call Centre Metrics Improvement Techniques Brochure PDF
This slides shows effective ways which can be used by organizations to enhance the customer service department performance. It includes set clear goals, provide learning opportunities, call flows and software. Slidegeeks is one of the best resources for PowerPoint templates. You can download easily and regulate Service Strategy Guide To Maximize Customer Experience Call Centre Metrics Improvement Techniques Brochure PDF for your personal presentations from our wonderful collection. A few clicks is all it takes to discover and get the most relevant and appropriate templates. Use our Templates to add a unique zing and appeal to your presentation and meetings. All the slides are easy to edit and you can use them even for advertisement purposes.

Improving HRM Process Dashboards To Track Diversity And Inclusion Metrics Background PDF
The performance tracker includes parameters to check diversion and inclusion through gender distribution ratio, hires by gender percentage, turnover by gender, ethnicity distribution etc. Are you in need of a template that can accommodate all of your creative concepts This one is crafted professionally and can be altered to fit any style. Use it with Google Slides or PowerPoint. Include striking photographs, symbols, depictions, and other visuals. Fill, move around, or remove text boxes as desired. Test out color palettes and font mixtures. Edit and save your work, or work with colleagues. Download Improving HRM Process Dashboards To Track Diversity And Inclusion Metrics Background PDF and observe how to make your presentation outstanding. Give an impeccable presentation to your group and make your presentation unforgettable.
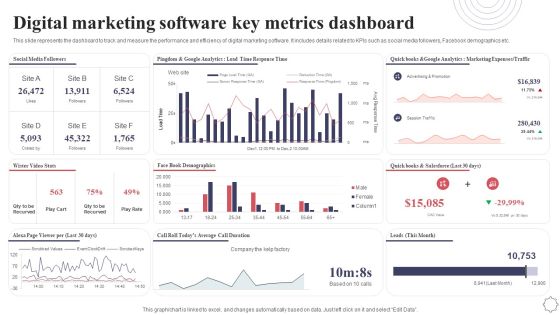
Digital Marketing Software Key Metrics Dashboard Application Deployment Project Plan Structure PDF
This slide represents the dashboard to track and measure the performance and efficiency of digital marketing software. It includes details related to KPIs such as social media followers, Facebook demographics etc. Slidegeeks is here to make your presentations a breeze with Digital Marketing Software Key Metrics Dashboard Application Deployment Project Plan Structure PDF With our easy to use and customizable templates, you can focus on delivering your ideas rather than worrying about formatting. With a variety of designs to choose from, you are sure to find one that suits your needs. And with animations and unique photos, illustrations, and fonts, you can make your presentation pop. So whether you are giving a sales pitch or presenting to the board, make sure to check out Slidegeeks first.

Cash Flow Metrics To Determine Firm Financial Health Ppt Icon PDF
This slide showcases KPIs that provides information on the potential and financial health of company. The KPIs covered are working capital, liquidity ratio, operating cashflow, days payable outstanding and account receivable turnover. Showcasing this set of slides titled Cash Flow Metrics To Determine Firm Financial Health Ppt Icon PDF. The topics addressed in these templates are Working Capital, Liquidity Ratio, Operating Cashflow. All the content presented in this PPT design is completely editable. Download it and make adjustments in color, background, font etc. as per your unique business setting.

Metrics To Measure Efficiency Of Google Adwords Strategic Campaign Pictures PDF
This slide various marketing KPIs used to measure efficiency of google adwords campaign in company. It includes elements such as conversion rate, click through rate, cost per click, etc. Persuade your audience using this Metrics To Measure Efficiency Of Google Adwords Strategic Campaign Pictures PDF. This PPT design covers eight stages, thus making it a great tool to use. It also caters to a variety of topics including Conversion Rate, Click Through Rate, Cost Per Click . Download this PPT design now to present a convincing pitch that not only emphasizes the topic but also showcases your presentation skills.

Cash Flow Metrics To Measure Firm Operations Effectiveness Ppt Outline Infographic Template PDF
This slide showcases yearly cash conversion cycle to determine companys working capital management. It includes DSO, DIO, DPO and CCC that measure the average number of days organization takes to collect payment and pay bills. Pitch your topic with ease and precision using this Cash Flow Metrics To Measure Firm Operations Effectiveness Ppt Outline Infographic Template PDF. This layout presents information on Cash Conversion Cycle, 2019 To 2022, Cash Flow. It is also available for immediate download and adjustment. So, changes can be made in the color, design, graphics or any other component to create a unique layout.

Content Marketing Applications For Nurturing Leads Metrics To Measure Content Marketing Strategy Infographics PDF
Welcome to our selection of the Content Marketing Applications For Nurturing Leads Metrics To Measure Content Marketing Strategy Infographics PDF. These are designed to help you showcase your creativity and bring your sphere to life. Planning and Innovation are essential for any business that is just starting out. This collection contains the designs that you need for your everyday presentations. All of our PowerPoints are 100 percent editable, so you can customize them to suit your needs. This multi purpose template can be used in various situations. Grab these presentation templates today.

Communicate Company Value To Your Stakeholders Metrics That Communicate The Efficiency Download PDF
This template covers the set of KPIs that most effectively represent the efficiency and effectiveness business contribution of the documented business-impacting services, apps, or projects. This is a communicate company value to your stakeholders metrics that communicate the efficiency download pdf template with various stages. Focus and dispense information on four stages using this creative set, that comes with editable features. It contains large content boxes to add your information on topics like determine, services, financial, expenses, reduce. You can also showcase facts, figures, and other relevant content using this PPT layout. Grab it now.

How To Evaluate And Develop The Organizational Value Of IT Service Financial Fundamental Metrics Slides PDF
These indicators assist IT leaders in stewarding technology expenditures and investments, and they are essential to managing the IT company. These measures aid in the management of the departments financial health and may indicate levers for cost reduction, improved resource allocation, and enhanced accountability. Deliver and pitch your topic in the best possible manner with this how to evaluate and develop the organizational value of it service financial fundamental metrics slides pdf. Use them to share invaluable insights on organizations, budget, business, efficiency and impress your audience. This template can be altered and modified as per your expectations. So, grab it now.

Customer Satisfaction Metrics With NPR And Customer Effort Score Ppt Icon Graphics Tutorials PDF
The slide carries a dashboard to evaluate customer experience for bringing advancement in existing products. Various KPIs used to measure customer experience are NPS Net Promoter Score and CES Customer Effort Score. Showcasing this set of slides titled Customer Satisfaction Metrics With NPR And Customer Effort Score Ppt Icon Graphics Tutorials PDF. The topics addressed in these templates are Net Promoter Score, Customer Effort Score, Product Service Reviews. All the content presented in this PPT design is completely editable. Download it and make adjustments in color, background, font etc. as per your unique business setting.

Metrics That Communicate The Efficiency And Effectiveness Of Business Impacting Services Ppt Ideas Grid PDF
This template covers the set of KPIs that most effectively represent the efficiency and effectiveness business contribution of the documented business impacting services, apps, or projects. Presenting metrics that communicate the efficiency and effectiveness of business impacting services ppt ideas grid pdf to provide visual cues and insights. Share and navigate important information on four stages that need your due attention. This template can be used to pitch topics like service level, application, revenue, cost efficiency, risk. In addtion, this PPT design contains high resolution images, graphics, etc, that are easily editable and available for immediate download.

KPI Metrics Dashboard To Measure Automation Performance In Customer Support Themes PDF
The following slide outlines a comprehensive KPI dashboard which can be used by the organization to measure the automation performance in customer support department. It covers kpis such as customer retention, costs per support, customer satisfaction, etc. Present like a pro with KPI Metrics Dashboard To Measure Automation Performance In Customer Support Themes PDF Create beautiful presentations together with your team, using our easy to use presentation slides. Share your ideas in real time and make changes on the fly by downloading our templates. So whether you are in the office, on the go, or in a remote location, you can stay in sync with your team and present your ideas with confidence. With Slidegeeks presentation got a whole lot easier. Grab these presentations today.

Financial Fundamental Metrics Infrastructure Unit Costs Vs Target Benchmarks Ppt Professional Example PDF
These indicators assist IT leaders in stewarding technology expenditures and investments, and they are essential to managing the IT company. These measures aid in the management of the departments financial health and may indicate levers for cost reduction, improved resource allocation, and enhanced accountability. Deliver and pitch your topic in the best possible manner with this financial fundamental metrics infrastructure unit costs vs target benchmarks ppt professional example pdf. Use them to share invaluable insights on outsourcing, organizations, budget and impress your audience. This template can be altered and modified as per your expectations. So, grab it now.

Communicate Company Value To Your Stakeholders Financial Fundamental Metrics Graphics PDF
These indicators assist IT leaders in stewarding technology expenditures and investments, and they are essential to managing the IT company. These measures aid in the management of the departments financial health and may indicate levers for cost reduction, improved resource allocation, and enhanced accountability. Deliver and pitch your topic in the best possible manner with this communicate company value to your stakeholders financial fundamental metrics graphics pdf. Use them to share invaluable insights on organizations, budget, protect and impress your audience. This template can be altered and modified as per your expectations. So, grab it now.
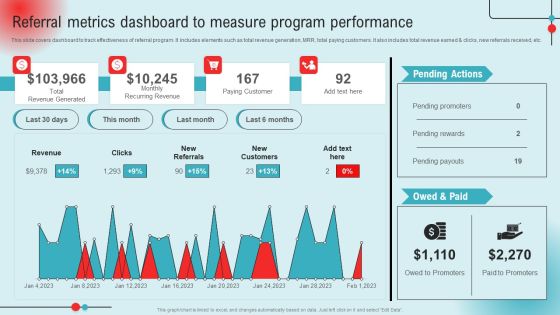
Referral Metrics Dashboard To Measure Program Performance Ppt PowerPoint Presentation Diagram Lists PDF
This slide covers dashboard to track effectiveness of referral program. It includes elements such as total revenue generation, MRR, total paying customers. It also includes total revenue earned and clicks, new referrals received, etc. This Referral Metrics Dashboard To Measure Program Performance Ppt PowerPoint Presentation Diagram Lists PDF from Slidegeeks makes it easy to present information on your topic with precision. It provides customization options, so you can make changes to the colors, design, graphics, or any other component to create a unique layout. It is also available for immediate download, so you can begin using it right away. Slidegeeks has done good research to ensure that you have everything you need to make your presentation stand out. Make a name out there for a brilliant performance.

Aligning API Design With Target Metrics Ppt File Background Images PDF
This slide covers the design aligned with business needs or goals which includes API Application Program Interface Program Manager, API Evangelist, API Architect etc. This is a aligning api design with target metrics ppt file background images pdf template with various stages. Focus and dispense information on four stages using this creative set, that comes with editable features. It contains large content boxes to add your information on topics like link with customers, better experiences for developers and end users, more security, goals. You can also showcase facts, figures, and other relevant content using this PPT layout. Grab it now.
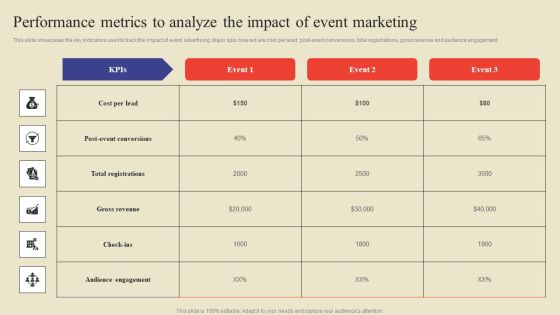
Performance Metrics To Analyze The Impact Of Event Marketing Ppt Professional Structure PDF
This slide showcases the key indicators used to track the impact of event advertising. Major kpis covered are cost per lead, post-event conversions, total registrations, gross revenue and audience engagement. This Performance Metrics To Analyze The Impact Of Event Marketing Ppt Professional Structure PDF from Slidegeeks makes it easy to present information on your topic with precision. It provides customization options, so you can make changes to the colors, design, graphics, or any other component to create a unique layout. It is also available for immediate download, so you can begin using it right away. Slidegeeks has done good research to ensure that you have everything you need to make your presentation stand out. Make a name out there for a brilliant performance.
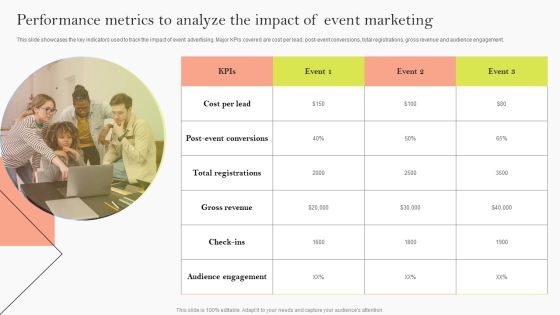
Performance Metrics To Analyze The Impact Of Event Marketing Ppt Model Good PDF
This slide showcases the key indicators used to track the impact of event advertising. Major KPIs covered are cost per lead, post-event conversions, total registrations, gross revenue and audience engagement. This modern and well arranged Performance Metrics To Analyze The Impact Of Event Marketing Ppt Model Good PDF provides lots of creative possibilities. It is very simple to customize and edit with the Powerpoint Software. Just drag and drop your pictures into the shapes. All facets of this template can be edited with Powerpoint no extra software is necessary. Add your own material, put your images in the places assigned for them, adjust the colors, and then you can show your slides to the world, with an animated slide included.
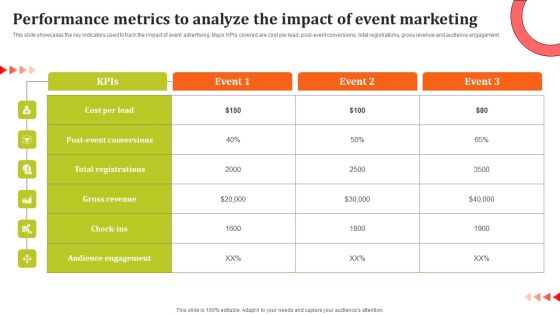
Performance Metrics To Analyze The Impact Of Event Marketing Ppt Model Layouts PDF
This slide showcases the key indicators used to track the impact of event advertising. Major KPIs covered are cost per lead, post-event conversions, total registrations, gross revenue and audience engagement. This modern and well arranged Performance Metrics To Analyze The Impact Of Event Marketing Ppt Model Layouts PDF provides lots of creative possibilities. It is very simple to customize and edit with the Powerpoint Software. Just drag and drop your pictures into the shapes. All facets of this template can be edited with Powerpoint no extra software is necessary. Add your own material, put your images in the places assigned for them, adjust the colors, and then you can show your slides to the world, with an animated slide included.
KPI Metrics Dashboard To Evaluate Facebook Video Campaign Performance Icons PDF
The following slide outlines a comprehensive KPI dashboard which can be used to analyze the performance of facebook video campaign. It provides information about page video views, page video views organic etc. Retrieve professionally designed KPI Metrics Dashboard To Evaluate Facebook Video Campaign Performance Icons PDF to effectively convey your message and captivate your listeners. Save time by selecting pre-made slideshows that are appropriate for various topics, from business to educational purposes. These themes come in many different styles, from creative to corporate, and all of them are easily adjustable and can be edited quickly. Access them as PowerPoint templates or as Google Slides themes. You do not have to go on a hunt for the perfect presentation because Slidegeeks got you covered from everywhere.
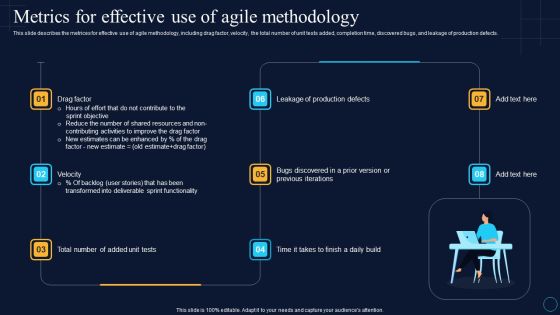
Metrics For Effective Use Of Agile Methodology Software Development Approaches Mockup PDF
This slide describes the metrices for effective use of agile methodology, including drag factor, velocity, the total number of unit tests added, completion time, discovered bugs, and leakage of production defects.Welcome to our selection of the Metrics For Effective Use Of Agile Methodology Software Development Approaches Mockup PDF. These are designed to help you showcase your creativity and bring your sphere to life. Planning and Innovation are essential for any business that is just starting out. This collection contains the designs that you need for your everyday presentations. All of our PowerPoints are 100 precent editable, so you can customize them to suit your needs. This multi-purpose template can be used in various situations. Grab these presentation templates today.

Key Metrics To Assess Effectiveness Of Sales Risk Analysis Ppt Outline Design Ideas PDF
The following slide highlights some key performance indicators to measure the effectiveness of sales risk evaluation on revenue performance. It includes elements such as opportunities, win rate, average time to win, sales velocity along with key insights etc. Retrieve professionally designed Key Metrics To Assess Effectiveness Of Sales Risk Analysis Ppt Outline Design Ideas PDF to effectively convey your message and captivate your listeners. Save time by selecting pre made slideshows that are appropriate for various topics, from business to educational purposes. These themes come in many different styles, from creative to corporate, and all of them are easily adjustable and can be edited quickly. Access them as PowerPoint templates or as Google Slides themes. You do not have to go on a hunt for the perfect presentation because Slidegeeks got you covered from everywhere.
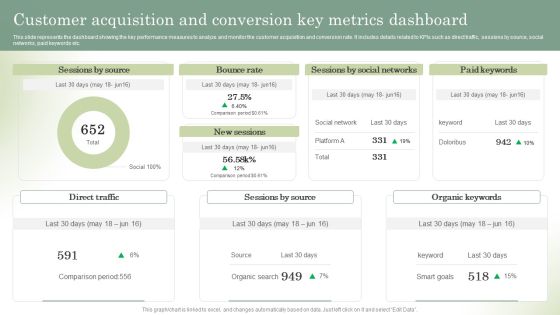
Optimizing Online Stores Customer Acquisition And Conversion Key Metrics Dashboard Formats PDF
This slide represents the dashboard showing the key performance measures to analyze and monitor the customer acquisition and conversion rate. It includes details related to KPIs such as direct traffic, sessions by source, social networks, paid keywords etc. Present like a pro with Optimizing Online Stores Customer Acquisition And Conversion Key Metrics Dashboard Formats PDF Create beautiful presentations together with your team, using our easy-to-use presentation slides. Share your ideas in real-time and make changes on the fly by downloading our templates. So whether youre in the office, on the go, or in a remote location, you can stay in sync with your team and present your ideas with confidence. With Slidegeeks presentation got a whole lot easier. Grab these presentations today.

Software Implementation Technique Digital Marketing Software Key Metrics Dashboard Download PDF
This slide represents the dashboard to track and measure the performance and efficiency of digital marketing software. It includes details related to KPIs such as social media followers, Facebook demographics etc. Present like a pro with Software Implementation Technique Digital Marketing Software Key Metrics Dashboard Download PDF Create beautiful presentations together with your team, using our easy to use presentation slides. Share your ideas in real time and make changes on the fly by downloading our templates. So whether you are in the office, on the go, or in a remote location, you can stay in sync with your team and present your ideas with confidence. With Slidegeeks presentation got a whole lot easier. Grab these presentations today.
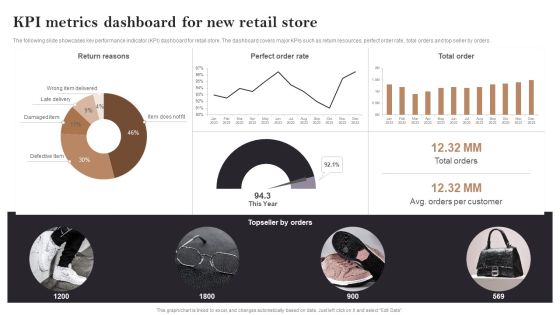
Kpi Metrics Dashboard For New Retail Store Opening Retail Store In Untapped Demonstration PDF
The following slide showcases key performance indicator KPI dashboard for retail store. The dashboard covers major KPIs such as return resources, perfect order rate, total orders and top seller by orders. Slidegeeks is one of the best resources for PowerPoint templates. You can download easily and regulate Kpi Metrics Dashboard For New Retail Store Opening Retail Store In Untapped Demonstration PDF for your personal presentations from our wonderful collection. A few clicks is all it takes to discover and get the most relevant and appropriate templates. Use our Templates to add a unique zing and appeal to your presentation and meetings. All the slides are easy to edit and you can use them even for advertisement purposes.

Executing Video Promotional KPI Metrics Dashboard To Evaluate Facebook Video Campaign Summary PDF
The following slide outlines a comprehensive KPI dashboard which can be used to analyze the performance of Facebook video campaign. It provides information about page video views, page video views organic etc. Coming up with a presentation necessitates that the majority of the effort goes into the content and the message you intend to convey. The visuals of a PowerPoint presentation can only be effective if it supplements and supports the story that is being told. Keeping this in mind our experts created Executing Video Promotional KPI Metrics Dashboard To Evaluate Facebook Video Campaign Summary PDF to reduce the time that goes into designing the presentation. This way, you can concentrate on the message while our designers take care of providing you with the right template for the situation.

Optimizing Social Networks Social Media Platforms Dashboard With Key Metrics Structure PDF
This slide shows KPI dashboard for assessing performance of social media platforms. It provides information about followers, likes, clicks, shares, impressions, engaged users, new followers, etc. Retrieve professionally designed Optimizing Social Networks Social Media Platforms Dashboard With Key Metrics Structure PDF to effectively convey your message and captivate your listeners. Save time by selecting pre-made slideshows that are appropriate for various topics, from business to educational purposes. These themes come in many different styles, from creative to corporate, and all of them are easily adjustable and can be edited quickly. Access them as PowerPoint templates or as Google Slides themes. You dont have to go on a hunt for the perfect presentation because Slidegeeks got you covered from everywhere.

Leadership Improvement Program Global Metrics Ppt PowerPoint Presentation Complete Deck With Slides
Boost your confidence and team morale with this well-structured leadership improvement program global metrics ppt powerpoint presentation complete deck with slides. This prefabricated set gives a voice to your presentation because of its well-researched content and graphics. Our experts have added all the components very carefully, thus helping you deliver great presentations with a single click. Not only that, it contains a set of twelve slides that are designed using the right visuals, graphics, etc. Various topics can be discussed, and effective brainstorming sessions can be conducted using the wide variety of slides added in this complete deck. Apart from this, our PPT design contains clear instructions to help you restructure your presentations and create multiple variations. The color, format, design anything can be modified as deemed fit by the user. Not only this, it is available for immediate download. So, grab it now.
Essential Initiatives Consistency Metrics Arrow Icon Ppt PowerPoint Presentation Complete Deck
Improve your presentation delivery using this essential initiatives consistency metrics arrow icon ppt powerpoint presentation complete deck. Support your business vision and objectives using this well-structured PPT deck. This template offers a great starting point for delivering beautifully designed presentations on the topic of your choice. Comprising fouteen this professionally designed template is all you need to host discussion and meetings with collaborators. Each slide is self-explanatory and equipped with high-quality graphics that can be adjusted to your needs. Therefore, you will face no difficulty in portraying your desired content using this PPT slideshow. This PowerPoint slideshow contains every important element that you need for a great pitch. It is not only editable but also available for immediate download and utilization. The color, font size, background, shapes everything can be modified to create your unique presentation layout. Therefore, download it now.

Business Financial Metrics Data Analysis Ppt PowerPoint Presentation Complete Deck With Slides
Improve your presentation delivery using this business financial metrics data analysis ppt powerpoint presentation complete deck with slides. Support your business vision and objectives using this well-structured PPT deck. This template offers a great starting point for delivering beautifully designed presentations on the topic of your choice. Comprising twenty nine this professionally designed template is all you need to host discussion and meetings with collaborators. Each slide is self-explanatory and equipped with high-quality graphics that can be adjusted to your needs. Therefore, you will face no difficulty in portraying your desired content using this PPT slideshow. This PowerPoint slideshow contains every important element that you need for a great pitch. It is not only editable but also available for immediate download and utilization. The color, font size, background, shapes everything can be modified to create your unique presentation layout. Therefore, download it now.

Metrics To Measure Business Performance Ppt PowerPoint Presentation Complete Deck With Slides
Induce strategic thinking by presenting this complete deck. Enthrall your audience by deploying this thought provoking PPT deck. It can be downloaded in both standard and widescreen aspect ratios, thus making it a complete package to use and deploy. Convey your thoughts and actions using the fourty three slides presented in this complete deck. Additionally, feel free to alter its components like color, graphics, design, etc, to create a great first impression. Grab it now by clicking on the download button below.

Enterprise Sustainability Performance Metrics Ppt PowerPoint Presentation Complete Deck With Slides
This complete presentation has PPT slides on wide range of topics highlighting the core areas of your business needs. It has professionally designed templates with relevant visuals and subject driven content. This presentation deck has total of fourty eight slides. Get access to the customizable templates. Our designers have created editable templates for your convenience. You can edit the colour, text and font size as per your need. You can add or delete the content if required. You are just a click to away to have this ready made presentation. Click the download button now.

Guide To Create Advertising Campaign For Client Engagement Step 7 Track Impact Metrics To Measure Slides PDF
This slide provides an overview of impact metrics used to determine the success of campaign. The metrics covered are impressions, bounce rate, conversions, gross profit, active users, referrals, and customer lifetime value. Boost your pitch with our creative Guide To Create Advertising Campaign For Client Engagement Step 7 Track Impact Metrics To Measure Slides PDF. Deliver an awe inspiring pitch that will mesmerize everyone. Using these presentation templates you will surely catch everyones attention. You can browse the ppts collection on our website. We have researchers who are experts at creating the right content for the templates. So you do not have to invest time in any additional work. Just grab the template now and use them.
Software Development Performance Metric Icon Brochure PDF
Showcasing this set of slides titled Software Development Performance Metric Icon Brochure PDF. The topics addressed in these templates are Software Development, Performance, Metric Icon. All the content presented in this PPT design is completely editable. Download it and make adjustments in color, background, font etc. as per your unique business setting.
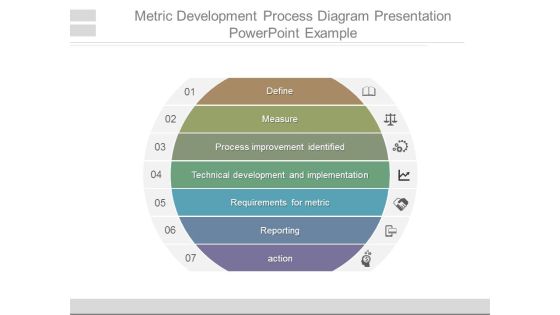
Metric Development Process Diagram Presentation Powerpoint Example
This is a metric development process diagram presentation powerpoint example. This is a seven stage process. The stages in this process are define, measure, process improvement identified, technical development and implementation, requirements for metric, reporting, action.

Business Software Performance Metric Icon Demonstration PDF
Presenting Business Software Performance Metric Icon Demonstration PDF to dispense important information. This template comprises Three stages. It also presents valuable insights into the topics including Business Software, Performance, Metric Icon. This is a completely customizable PowerPoint theme that can be put to use immediately. So, download it and address the topic impactfully.

Metric Progress Model Ppt Diagram Powerpoint Image
This is a metric progress model ppt diagram powerpoint image. This is a five stage process. The stages in this process are goals, overall business strategy, key business drivers, reporting, technical development.

Kpi Metrics Dashboard To Analyze The Effectiveness Of New Product Launch Launching New Beverage Product Diagrams PDF
The following slide outlines key performance indicator KPI dashboard which can be used to measure the success of product launch. The kpis are total units, revenue, average selling price ASP, number of penetrated planned customers etc. Create an editable Kpi Metrics Dashboard To Analyze The Effectiveness Of New Product Launch Launching New Beverage Product Diagrams PDF that communicates your idea and engages your audience. Whether you are presenting a business or an educational presentation, pre-designed presentation templates help save time. Kpi Metrics Dashboard To Analyze The Effectiveness Of New Product Launch Launching New Beverage Product Diagrams PDF is highly customizable and very easy to edit, covering many different styles from creative to business presentations. Slidegeeks has creative team members who have crafted amazing templates. So, go and get them without any delay.

Staff Retention Techniques To Minimize Hiring Expenses KPI Metrics To Analyze The Effectiveness Of Employee Formats PDF
The purpose of this slide is to delineate different key performance indicators KPI which will assist HR professionals to measure the success of staff retention tactics. The KPIs are employee turnover rate, employee satisfaction rate, employee productivity rate, customer experience rate and average time per recruitment Get a simple yet stunning designed Staff Retention Techniques To Minimize Hiring Expenses KPI Metrics To Analyze The Effectiveness Of Employee Formats PDF. It is the best one to establish the tone in your meetings. It is an excellent way to make your presentations highly effective. So, download this PPT today from Slidegeeks and see the positive impacts. Our easy to edit Staff Retention Techniques To Minimize Hiring Expenses KPI Metrics To Analyze The Effectiveness Of Employee Formats PDF can be your go to option for all upcoming conferences and meetings. So, what are you waiting for Grab this template today.
 Home
Home