Strategy Pillars

Put And Call Options Ppt PowerPoint Presentation Infographics Elements
This is a put and call options ppt powerpoint presentation infographics elements. This is a seven stage process. The stages in this process are marketing, business, management.

Risk And Return Of Portfolio Managers Tabular Form Ppt PowerPoint Presentation Ideas Display
This is a risk and return of portfolio managers tabular form ppt powerpoint presentation ideas display. This is a five stage process. The stages in this process are business, management, marketing, compare.

Stock Index Futures And Options Ppt PowerPoint Presentation Styles Design Templates
This is a stock index futures and options ppt powerpoint presentation styles design templates. This is a five stage process. The stages in this process are business, management, marketing, compare.
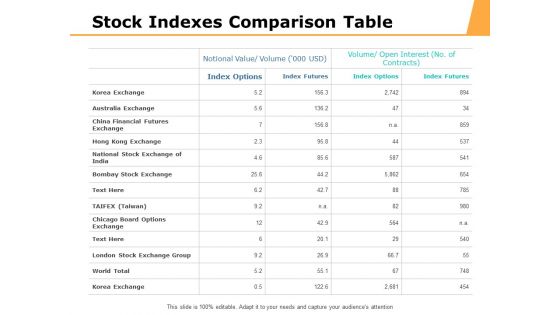
Stock Indexes Comparison Table Ppt PowerPoint Presentation Portfolio Graphics Template
This is a stock indexes comparison table ppt powerpoint presentation portfolio graphics template. This is a four stage process. The stages in this process are business, management, marketing, compare.

Thank You Funds Analysis Ppt PowerPoint Presentation Outline Mockup
This is a thank you funds analysis ppt powerpoint presentation outline mockup. This is a one stage process. The stages in this process are thank you, word, greeting.

Top 5 Mutual Funds To Invest In 2018 To 19 Ppt PowerPoint Presentation Backgrounds
This is a top 5 mutual funds to invest in 2018 to 19 ppt powerpoint presentation backgrounds. This is a nine stage process. The stages in this process are business, management, marketing, compare.

Top Performing Bonds Ppt PowerPoint Presentation Slides Example Introduction
This is a top performing bonds ppt powerpoint presentation slides example introduction. This is a three stage process. The stages in this process are business, management, marketing, compare.
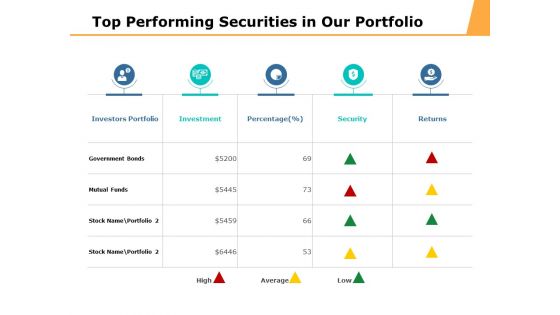
Top Performing Securities In Our Portfolio Ppt PowerPoint Presentation Professional Topics
This is a top performing securities in our portfolio ppt powerpoint presentation professional topics. This is a five stage process. The stages in this process are business, management, marketing, compare.
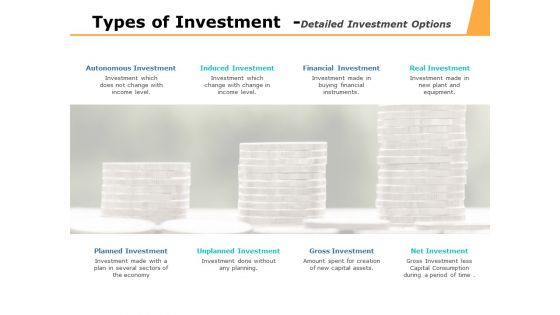
Types Of Investment Detailed Investment Options Ppt PowerPoint Presentation Pictures Master Slide
This is a types of investment detailed investment options ppt powerpoint presentation pictures master slide. This is a eight stage process. The stages in this process are business, management, marketing.
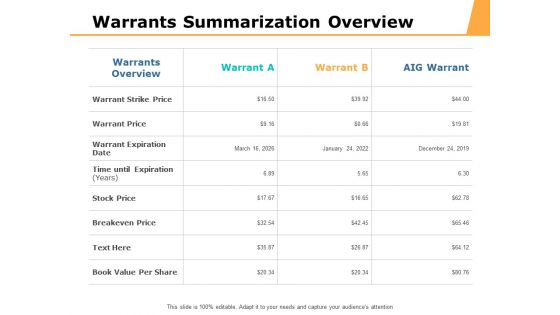
Warrants Summarization Overview Ppt PowerPoint Presentation Infographic Template Vector
This is a warrants summarization overview ppt powerpoint presentation infographic template vector. This is a four stage process. The stages in this process are business, management, marketing, compare.
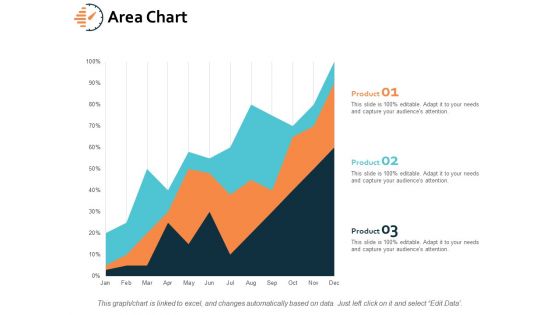
Area Chart Finance Marketing Ppt PowerPoint Presentation Gallery Graphics Design
This is a area chart finance marketing ppt powerpoint presentation gallery graphics design. This is a three stage process. The stages in this process are finance, analysis, business, investment, marketing.
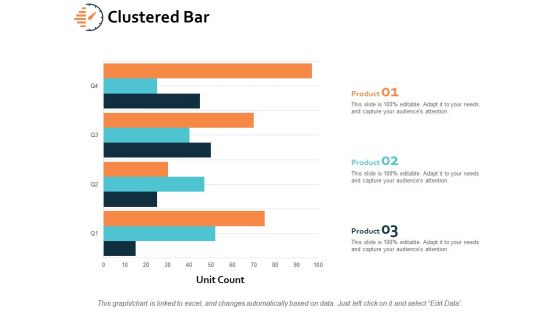
Clustered Bar Investment Ppt PowerPoint Presentation File Templates
This is a clustered bar investment ppt powerpoint presentation file templates. This is a three stage process. The stages in this process are finance, analysis, business, investment, marketing.

Employee Performance Measurement KPI Ppt PowerPoint Presentation Ideas Mockup
This is a employee performance measurement kpi ppt powerpoint presentation ideas mockup. This is a eight stage process. The stages in this process are finance, analysis, business, investment, marketing.

Employee Weekly Efficiency Dashboard Ppt PowerPoint Presentation Infographics Microsoft
This is a employee weekly efficiency dashboard ppt powerpoint presentation infographics microsoft. This is a six stage process. The stages in this process are finance, analysis, business, investment, marketing.
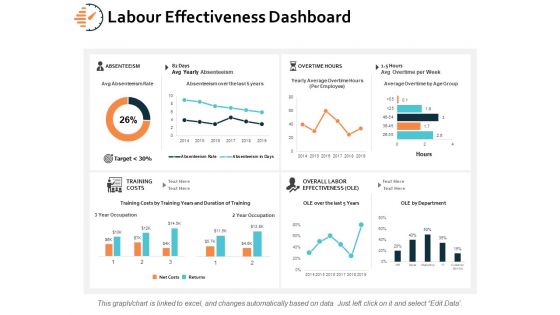
Labour Effectiveness Dashboard Ppt PowerPoint Presentation Model Objects
This is a labour effectiveness dashboard ppt powerpoint presentation model objects. This is a eight stage process. The stages in this process are finance, analysis, business, investment, marketing.
Negative Impacts Of Workplace Stress Finance Ppt PowerPoint Presentation Icon Inspiration
This is a negative impacts of workplace stress finance ppt powerpoint presentation icon inspiration. This is a five stage process. The stages in this process are finance, analysis, business, investment, marketing.
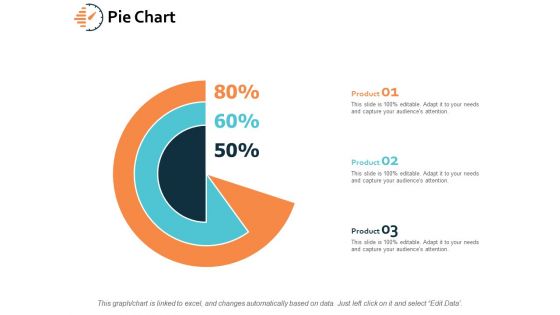
Pie Chart Investment Finance Ppt PowerPoint Presentation File Influencers
This is a pie chart investment finance ppt powerpoint presentation file influencers. This is a three stage process. The stages in this process are finance, analysis, business, investment, marketing.
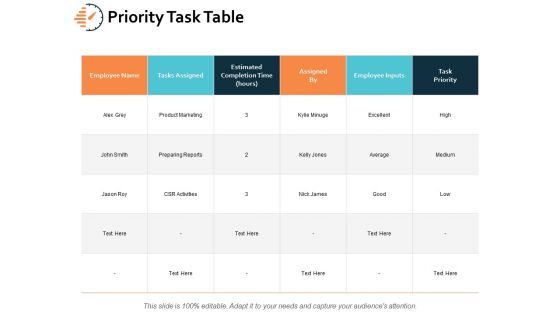
Priority Task Table Ppt PowerPoint Presentation File Vector
This is a priority task table ppt powerpoint presentation file vector. This is a six stage process. The stages in this process are tasks assigned, employee inputs, product marketing, preparing reports, task priority.
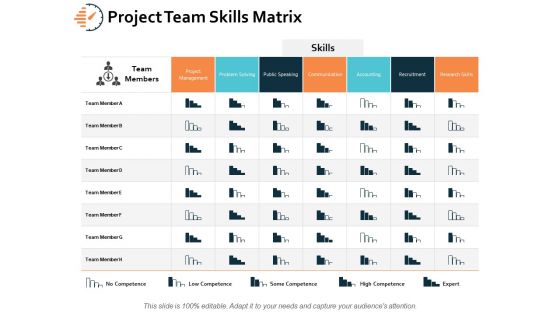
Project Team Skills Matrix Ppt PowerPoint Presentation Styles Example Introduction
This is a project team skills matrix ppt powerpoint presentation styles example introduction. This is a seven stage process. The stages in this process are communication, accounting, problem solving, project management, recruitment.
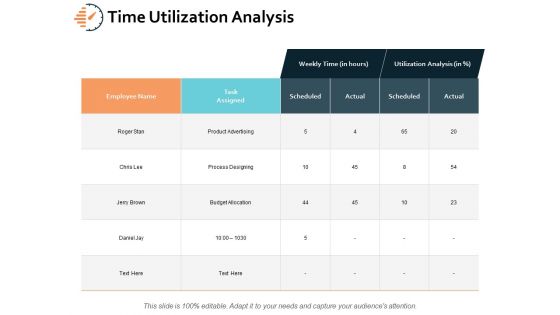
Time Utilization Analysis Ppt PowerPoint Presentation Professional File Formats
This is a time utilization analysis ppt powerpoint presentation professional file formats. This is a four stage process. The stages in this process are process designing, product advertising, task assigned, budget allocation, utilization analysis.
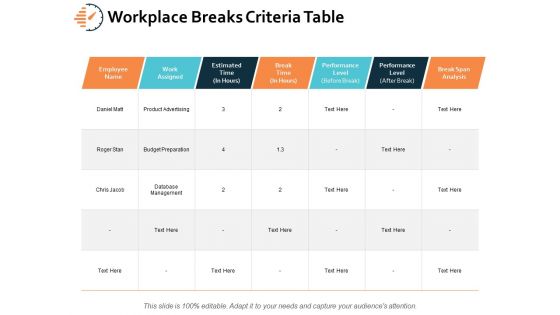
Workplace Breaks Criteria Table Ppt PowerPoint Presentation Gallery Graphic Images
This is a workplace breaks criteria table ppt powerpoint presentation gallery graphic images. This is a seven stage process. The stages in this process are work assigned, performance level, budget preparation, product advertising, database management.
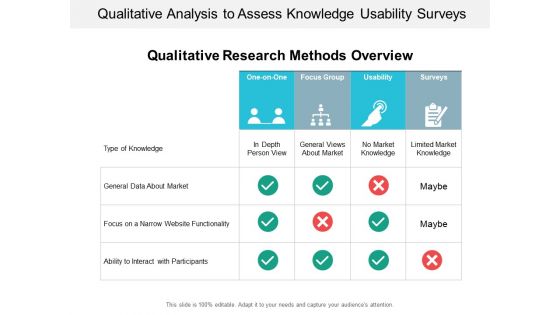
Qualitative Analysis To Assess Knowledge Usability Surveys Ppt PowerPoint Presentation Portfolio Graphic Images
This is a qualitative analysis to assess knowledge usability surveys ppt powerpoint presentation portfolio graphic images. This is a four stage process. The stages in this process are analysis, observation, qualitative.
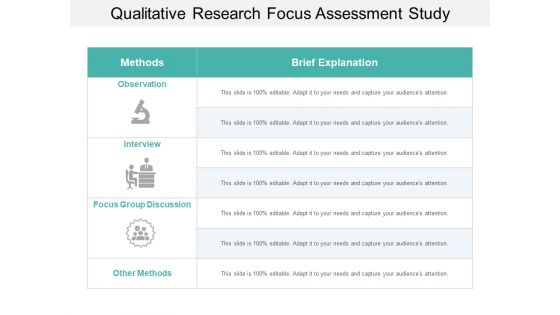
Qualitative Research Focus Assessment Study Ppt PowerPoint Presentation Ideas Slide Portrait
This is a qualitative research focus assessment study ppt powerpoint presentation ideas slide portrait. This is a three stage process. The stages in this process are analysis, observation, qualitative.

Risk Probability And Impact Matrix Severity And Consequences Ppt PowerPoint Presentation Layouts Clipart
This is a risk probability and impact matrix severity and consequences ppt powerpoint presentation layouts clipart. This is a five stage process. The stages in this process are analysis, observation, qualitative.
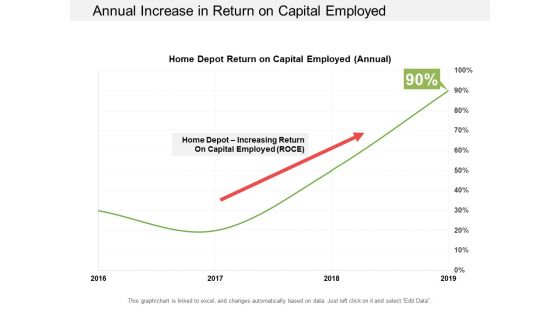
Annual Increase In Return On Capital Employed Ppt PowerPoint Presentation Outline Objects
This is a annual increase in return on capital employed ppt powerpoint presentation outline objects. This is a four stage process. The stages in this process are accounting ratio, roce, return on capital employed.

Return On Capital Employed Product Performance Chart Ppt PowerPoint Presentation Portfolio Visuals
This is a return on capital employed product performance chart ppt powerpoint presentation portfolio visuals. This is a three stage process. The stages in this process are accounting ratio, roce, return on capital employed.

Return On Capital Employed Trend Graph Ppt PowerPoint Presentation Professional Example Topics
This is a return on capital employed trend graph ppt powerpoint presentation professional example topics. This is a one stage process. The stages in this process are accounting ratio, roce, return on capital employed.

Digital Marketing Analysis Ecommerce Conversion Rate Ppt PowerPoint Presentation Outline Example File
This is a digital marketing analysis ecommerce conversion rate ppt powerpoint presentation outline example file. This is a three stage process. The stages in this process are digital analytics, digital dashboard, marketing.
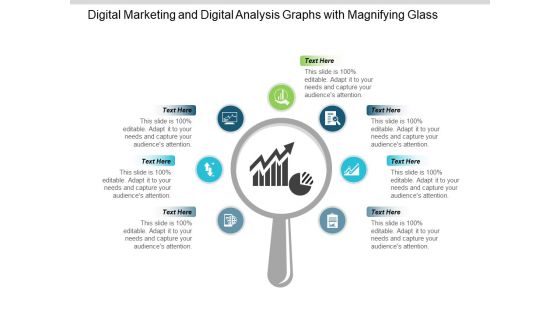
Digital Marketing And Digital Analysis Graphs With Magnifying Glass Ppt PowerPoint Presentation Portfolio Show
This is a digital marketing and digital analysis graphs with magnifying glass ppt powerpoint presentation portfolio show. This is a seven stage process. The stages in this process are digital analytics, digital dashboard, marketing.

Web Analytics For Seo Marketing Ppt PowerPoint Presentation Examples
This is a web analytics for seo marketing ppt powerpoint presentation examples. This is a five stage process. The stages in this process are digital analytics, digital dashboard, marketing.

Web Analytics Traffic Sources And Conversion Rate Ppt PowerPoint Presentation Picture
This is a web analytics traffic sources and conversion rate ppt powerpoint presentation picture. This is a four stage process. The stages in this process are digital analytics, digital dashboard, marketing.
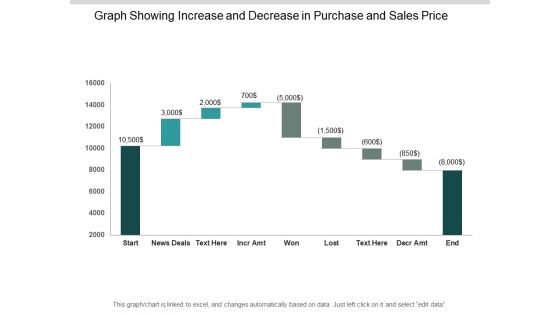
Graph Showing Increase And Decrease In Purchase And Sales Price Ppt PowerPoint Presentation Outline Gallery
This is a graph showing increase and decrease in purchase and sales price ppt powerpoint presentation outline gallery. This is a nine stage process. The stages in this process are sales waterfall, waterfall chart, business.

Revenue Waterfall Chart Showing Fixed And Variable Cost Ppt PowerPoint Presentation Infographic Template Images
This is a revenue waterfall chart showing fixed and variable cost ppt powerpoint presentation infographic template images. This is a five stage process. The stages in this process are sales waterfall, waterfall chart, business.

Sales Graph Showing Payouts Losses And Wins Ppt PowerPoint Presentation Pictures Designs Download
This is a sales graph showing payouts losses and wins ppt powerpoint presentation pictures designs download. This is a eight stage process. The stages in this process are sales waterfall, waterfall chart, business.

Waterfall Chart Indicating Sales Performance Ppt PowerPoint Presentation Outline Templates
This is a waterfall chart indicating sales performance ppt powerpoint presentation outline templates. This is a seven stage process. The stages in this process are sales waterfall, waterfall chart, business.
Waterfall Chart Showing Effective Pricing And Profitability Insight Ppt PowerPoint Presentation Icon Graphics
This is a waterfall chart showing effective pricing and profitability insight ppt powerpoint presentation icon graphics. This is a seven stage process. The stages in this process are sales waterfall, waterfall chart, business.

Waterfall Chart Showing Ytd Sales Change Ppt PowerPoint Presentation Professional Format
This is a waterfall chart showing ytd sales change ppt powerpoint presentation professional format. This is a ten stage process. The stages in this process are sales waterfall, waterfall chart, business.

Waterfall Chart With Merchandising Sales Cost And Net Revenue Ppt PowerPoint Presentation Summary Show
This is a waterfall chart with merchandising sales cost and net revenue ppt powerpoint presentation summary show. This is a three stage process. The stages in this process are sales waterfall, waterfall chart, business.
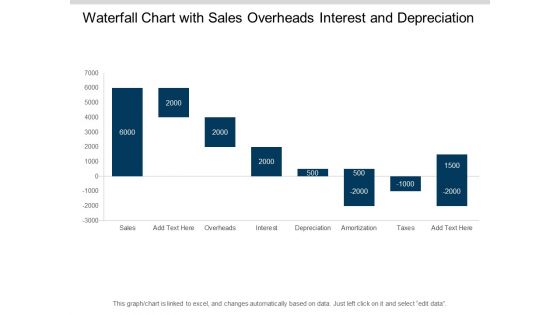
Waterfall Chart With Sales Overheads Interest And Depreciation Ppt PowerPoint Presentation File Display
This is a waterfall chart with sales overheads interest and depreciation ppt powerpoint presentation file display. This is a eight stage process. The stages in this process are sales waterfall, waterfall chart, business.

Waterfall Graph For Income And Expense Analysis Ppt PowerPoint Presentation File Deck
This is a waterfall graph for income and expense analysis ppt powerpoint presentation file deck. This is a eight stage process. The stages in this process are sales waterfall, waterfall chart, business.
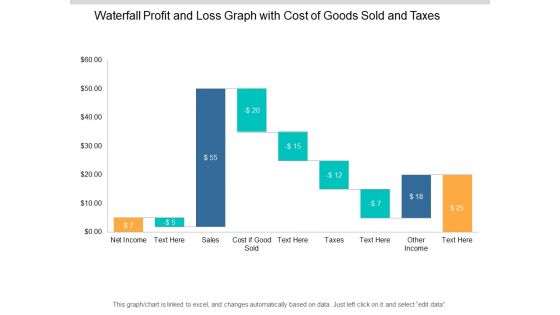
Waterfall Profit And Loss Graph With Cost Of Goods Sold And Taxes Ppt PowerPoint Presentation Show Slideshow
This is a waterfall profit and loss graph with cost of goods sold and taxes ppt powerpoint presentation show slideshow. This is a nine stage process. The stages in this process are sales waterfall, waterfall chart, business.

Business Continuity Framework Ppt PowerPoint Presentation Gallery Design Templates Cpb
This is a business continuity framework ppt powerpoint presentation gallery design templates cpb. This is a five stage process. The stages in this process are business continuity framework.
Business Transformation Assurance Ppt PowerPoint Presentation Pictures Show Cpb
This is a business transformation assurance ppt powerpoint presentation pictures show cpb. This is a four stage process. The stages in this process are business transformation assurance.

Capital Program Management Ppt PowerPoint Presentation Gallery Deck Cpb
This is a capital program management ppt powerpoint presentation gallery deck cpb. This is a eight stage process. The stages in this process are capital program management.

Email Marketing Ppt PowerPoint Presentation Styles Slide Cpb
This is a email marketing ppt powerpoint presentation styles slide cpb. This is a four stage process. The stages in this process are email marketing.
Employee Evaluations Ppt PowerPoint Presentation Layouts Icons Cpb
This is a employee evaluations ppt powerpoint presentation layouts icons cpb. This is a four stage process. The stages in this process are employee evaluations.

Finance Metrics Ppt PowerPoint Presentation Outline Professional Cpb
This is a finance metrics ppt powerpoint presentation outline professional cpb. This is a five stage process. The stages in this process are finance metrics.

Law Enforcement Analytics Ppt PowerPoint Presentation Tips Cpb
This is a law enforcement analytics ppt powerpoint presentation tips cpb. This is a four stage process. The stages in this process are law enforcement analytics.

Leasing Business Model Ppt PowerPoint Presentation Professional Demonstration Cpb
This is a leasing business model ppt powerpoint presentation professional demonstration cpb. This is a four stage process. The stages in this process are leasing business model.
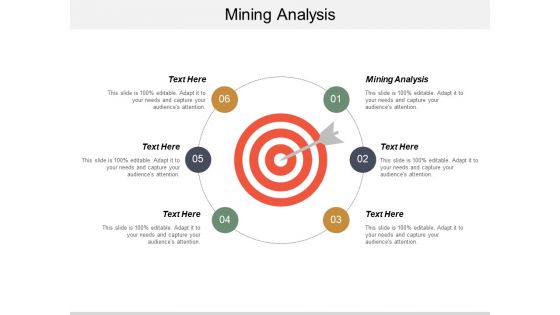
Mining Analysis Ppt PowerPoint Presentation Professional Slide Cpb
This is a mining analysis ppt powerpoint presentation professional slide cpb. This is a six stage process. The stages in this process are mining analysis.
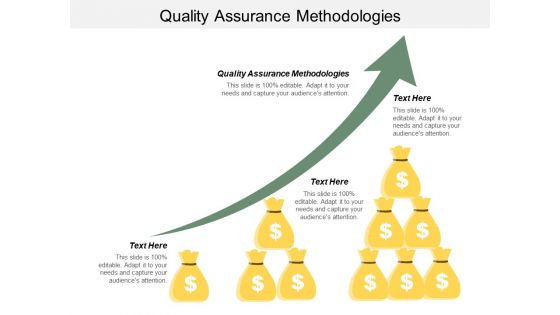
Quality Assurance Methodologies Ppt PowerPoint Presentation File Diagrams Cpb
This is a quality assurance methodologies ppt powerpoint presentation file diagrams cpb. This is a three stage process. The stages in this process are quality assurance methodologies.

Stock Market Listing Ppt PowerPoint Presentation File Example Topics Cpb
This is a stock market listing ppt powerpoint presentation file example topics cpb. This is a four stage process. The stages in this process are stock market listing.
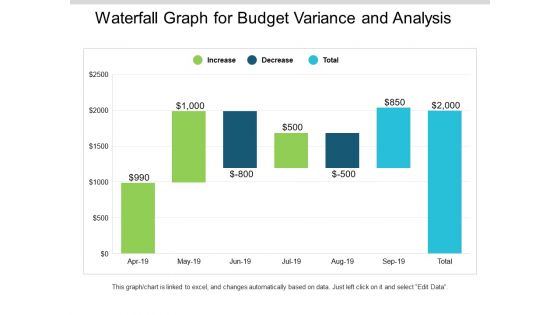
Waterfall Graph For Budget Variance And Analysis Ppt PowerPoint Presentation Slides Mockup
This is a waterfall graph for budget variance and analysis ppt powerpoint presentation slides mockup. This is a three stage process. The stages in this process are profit and loss, balance sheet, income statement, benefit and loss.

Waterfall Graph Showing Business Progress Ppt PowerPoint Presentation Styles Model
This is a waterfall graph showing business progress ppt powerpoint presentation styles model. This is a three stage process. The stages in this process are profit and loss, balance sheet, income statement, benefit and loss.
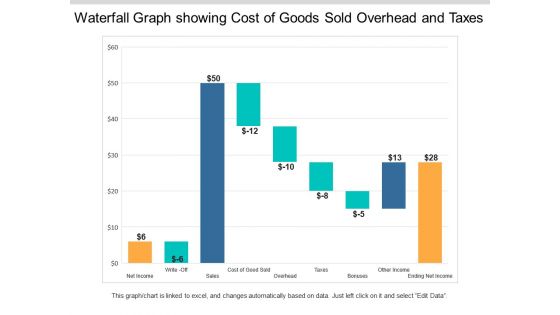
Waterfall Graph Showing Cost Of Goods Sold Overhead And Taxes Ppt PowerPoint Presentation Styles Example Topics
This is a waterfall graph showing cost of goods sold overhead and taxes ppt powerpoint presentation styles example topics. This is a three stage process. The stages in this process are profit and loss, balance sheet, income statement, benefit and loss.

Waterfall Graph Showing Monetary Transactions Ppt PowerPoint Presentation Ideas Visuals
This is a waterfall graph showing monetary transactions ppt powerpoint presentation ideas visuals. This is a three stage process. The stages in this process are profit and loss, balance sheet, income statement, benefit and loss.

Waterfall Graph Showing Sales Expenses Revenue And Taxes Ppt PowerPoint Presentation Pictures Summary
This is a waterfall graph showing sales expenses revenue and taxes ppt powerpoint presentation pictures summary. This is a three stage process. The stages in this process are profit and loss, balance sheet, income statement, benefit and loss.

Waterfall Graph Summarize Budget 2018 To 2019 Ppt PowerPoint Presentation Summary Slides
This is a waterfall graph summarize budget 2018 to 2019 ppt powerpoint presentation summary slides. This is a three stage process. The stages in this process are profit and loss, balance sheet, income statement, benefit and loss.
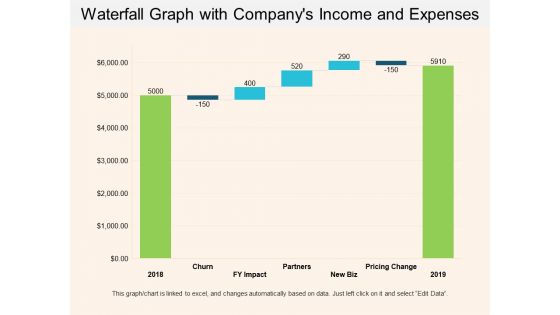
Waterfall Graph With Companys Income And Expenses Ppt PowerPoint Presentation Show Example Introduction
This is a waterfall graph with companys income and expenses ppt powerpoint presentation show example introduction. This is a three stage process. The stages in this process are profit and loss, balance sheet, income statement, benefit and loss.
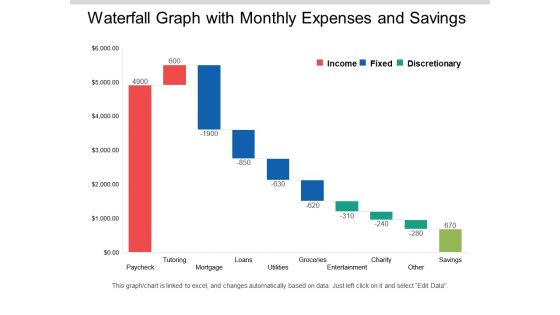
Waterfall Graph With Monthly Expenses And Savings Ppt PowerPoint Presentation Layouts Clipart Images
This is a waterfall graph with monthly expenses and savings ppt powerpoint presentation layouts clipart images. This is a three stage process. The stages in this process are profit and loss, balance sheet, income statement, benefit and loss.

 Home
Home