Stock Market

Area Chart Finance Ppt PowerPoint Presentation Gallery Information
This is a area chart finance ppt powerpoint presentation gallery information. This is a three stage process. The stages in this process are finance, marketing, analysis, investment, million.

Combo Chart Graph Ppt PowerPoint Presentation Professional Guidelines
This is a combo chart graph ppt powerpoint presentation professional guidelines. This is a three stage process. The stages in this process are finance, marketing, analysis, investment, million.

Pie Chart Bar Ppt PowerPoint Presentation Layouts Examples
This is a pie chart bar ppt powerpoint presentation layouts examples. This is a three stage process. The stages in this process are finance, marketing, analysis, investment, million.

Dashboard Management Ppt Powerpoint Presentation Inspiration Model
This is a dashboard management ppt powerpoint presentation inspiration model. This is a three stage process. The stages in this process are dashboard, marketing, management, analysis, strategy.

Pie Chart Finance Ppt Powerpoint Presentation Introduction
This is a pie chart finance ppt powerpoint presentation introduction. This is a three stage process. The stages in this process are finance, marketing, analysis, investment, strategy.

Pie Chart Finance Ppt Powerpoint Presentation Gallery Templates
This is a pie chart finance ppt powerpoint presentation gallery templates. This is a four stage process. The stages in this process are finance, marketing, management, investment, analysis.

Magnifying Glass Technology Ppt Powerpoint Presentation Gallery Diagrams
This is a magnifying glass technology ppt powerpoint presentation gallery diagrams. This is a four stage process. The stages in this process are finance, marketing, management, investment, analysis.

Comparison Male Female Ppt Powerpoint Presentation Inspiration Demonstration
This is a comparison male female ppt powerpoint presentation inspiration demonstration. This is a two stage process. The stages in this process are finance, marketing, management, investment, analysis.

Column Chart Finance Ppt Powerpoint Presentation Inspiration Images
This is a column chart finance ppt powerpoint presentation inspiration images. This is a two stage process. The stages in this process are finance, marketing, management, investment, analysis.

Combo Chart Finance Ppt Powerpoint Presentation Ideas Slides
This is a combo chart finance ppt powerpoint presentation ideas slides. This is a three stage process. The stages in this process are finance, marketing, management, investment, analysis.
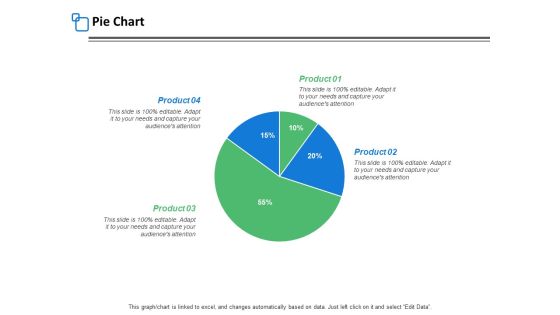
Pie Chart Finance Ppt PowerPoint Presentation Inspiration Templates
This is a pie chart finance ppt powerpoint presentation inspiration templates. This is a four stage process. The stages in this process are finance, marketing, management, investment, analysis.

Derivative Products Ppt PowerPoint Presentation Slides Images
This is a derivative products ppt powerpoint presentation slides images. This is a one stage process. The stages in this process are finance, marketing, management, business.
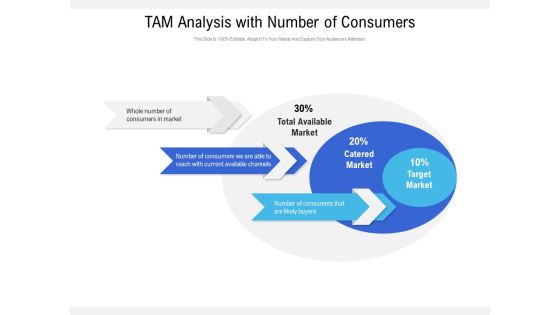
TAM Analysis With Number Of Consumers Ppt PowerPoint Presentation Slides Guide PDF
Presenting tam analysis with number of consumers ppt powerpoint presentation slides guide pdf to dispense important information. This template comprises three stages. It also presents valuable insights into the topics including whole number of consumers in market, number of consumers we are able to reach with current available channels, number of consumers that are likely buyers, catered market, total available market, target market. This is a completely customizable PowerPoint theme that can be put to use immediately. So, download it and address the topic impactfully.
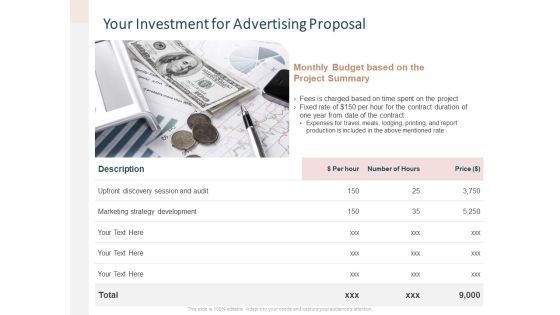
Your Investment For Advertising Proposal Ppt File Infographics PDF
Presenting your investment for advertising proposal ppt file infographics pdf to provide visual cues and insights. Share and navigate important information on one stages that need your due attention. This template can be used to pitch topics like marketing, strategy, development, budget. In addtion, this PPT design contains high resolution images, graphics, etc, that are easily editable and available for immediate download.

Area Chart Ppt PowerPoint Presentation Layouts Graphics Example
This is a area chart ppt powerpoint presentation layouts graphics example. This is a two stage process. The stages in this process are sales in percentage, financial year, business, marketing, presentation.

Area Chart Ppt PowerPoint Presentation Layouts Maker
This is a area chart ppt powerpoint presentation layouts maker. This is a two stage process. The stages in this process are financial year, sales in percentage, graph, business, marketing.

Column Chart Ppt PowerPoint Presentation Show Master Slide
This is a column chart ppt powerpoint presentation show master slide. This is a six stage process. The stages in this process are financial, years, business, marketing, finance, graph.

Area Chart Ppt PowerPoint Presentation Summary Show
This is a area chart ppt powerpoint presentation summary show. This is a two stage process. The stages in this process are sales in percentage, financial year, business, marketing, finance.

Bar Chart Ppt PowerPoint Presentation Icon Layout
This is a bar chart ppt powerpoint presentation icon layout. This is a one stage process. The stages in this process are sales in percentage, financial years, bar chart, finance, marketing.

area chart ppt powerpoint presentation professional elements
This is a area chart ppt powerpoint presentation professional elements. This is a two stage process. The stages in this process are financial year sales in percentage, business, marketing, graph.

Clustered Column Chart Ppt PowerPoint Presentation Show Slideshow
This is a clustered column chart ppt powerpoint presentation show slideshow. This is a six stage process. The stages in this process are financial year in, sales in percentage, business, marketing, finance.

Bar Chart Ppt PowerPoint Presentation File Slide
This is a bar chart ppt powerpoint presentation file slide. This is a one stage process. The stages in this process are sales in percentage financial years, business, marketing, strategy, graph.

Clustered Column Ppt PowerPoint Presentation Show Graphics
This is a clustered column ppt powerpoint presentation show graphics. This is a two stage process. The stages in this process are financial year, sales in percentage, business, marketing, graph.

Bar Chart Ppt PowerPoint Presentation Diagram Lists
This is a bar chart ppt powerpoint presentation diagram lists. This is a two stage process. The stages in this process are business, marketing, financial years, sales in percentage, graph.
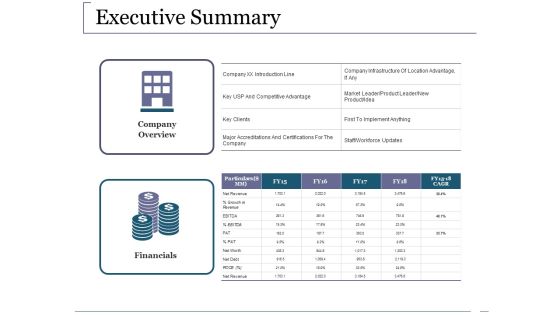
Executive Summary Ppt PowerPoint Presentation Layouts Example Topics
This is a executive summary ppt powerpoint presentation layouts example topics. This is a two stage process. The stages in this process are company overview, financials, particulars, business, marketing.
Stacked Line Ppt PowerPoint Presentation Icon Professional
This is a stacked line ppt powerpoint presentation icon professional. This is a three stage process. The stages in this process are Business, Financial, Marketing, Graph, Strategy Revenue In Percentage.

Area Chart Ppt PowerPoint Presentation Inspiration Professional
This is a area chart ppt powerpoint presentation inspiration professional. This is a two stage process. The stages in this process are financial year, in percentage, area chart, finance, business, marketing.

Bar Chart Ppt PowerPoint Presentation Visual Aids Diagrams
This is a bar chart ppt powerpoint presentation visual aids diagrams. This is a two stage process. The stages in this process are business, marketing, financial years, sales in percentage, graph.

Clustered Column Ppt PowerPoint Presentation Gallery Format
This is a clustered column ppt powerpoint presentation gallery format. This is a two stage process. The stages in this process are business, marketing, graph, financial year, sales in percentage.
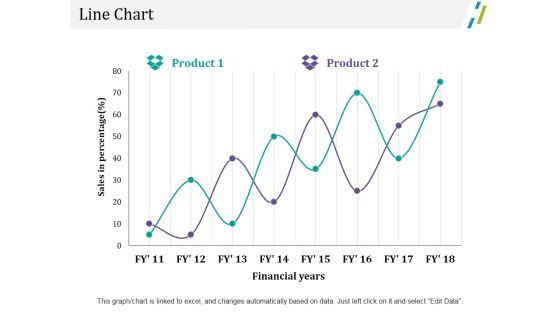
Line Chart Ppt PowerPoint Presentation Outline File Formats
This is a line chart ppt powerpoint presentation outline file formats. This is a two stage process. The stages in this process are business, marketing, sales in percentage, financial years, chart.

Line Chart Ppt PowerPoint Presentation Outline Ideas
This is a line chart ppt powerpoint presentation outline ideas. This is a two stage process. The stages in this process are business, marketing, financial years, sales in percentage, strategy.

Column Chart Ppt PowerPoint Presentation Infographic Template Icon
This is a column chart ppt powerpoint presentation infographic template icon. This is a two stage process. The stages in this process are business, marketing, sales in percentage, financial year, graph.

Column Chart Ppt PowerPoint Presentation Show Structure
This is a column chart ppt powerpoint presentation show structure. This is a two stage process. The stages in this process are business, financial year in, sales in percentage, marketing, graph.
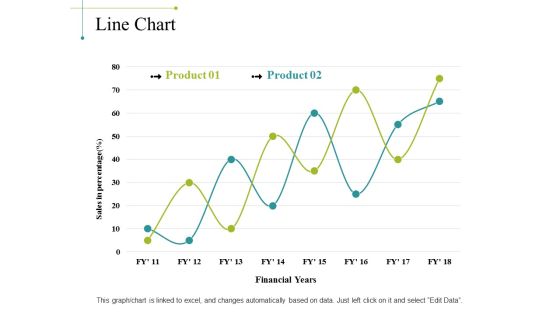
Line Chart Ppt PowerPoint Presentation Portfolio Background Image
This is a line chart ppt powerpoint presentation portfolio background image. This is a two stage process. The stages in this process are sales in percentage, financial years, chart, business, marketing, finance.

Area Chart Ppt PowerPoint Presentation Icon Aids
This is a area chart ppt powerpoint presentation icon aids. This is a three stage process. The stages in this process are financial years, sales in percentage, business, marketing, graph.

Bar Chart Ppt PowerPoint Presentation Summary Themes
This is a bar chart ppt powerpoint presentation summary themes. This is a three stage process. The stages in this process are financial years, sales in percentage, business, marketing, graph.

Area Chart Ppt PowerPoint Presentation Outline Graphics Pictures
This is a area chart ppt powerpoint presentation outline graphics pictures. This is a two stage process. The stages in this process are financial year, in percentage, business, marketing, finance.

Bar Chart Ppt PowerPoint Presentation Layouts Template
This is a bar chart ppt powerpoint presentation layouts template. This is a two stage process. The stages in this process are financial year, sales in percentage, business, marketing, finance.

Area Chart Ppt PowerPoint Presentation Model Demonstration
This is a area chart ppt powerpoint presentation model demonstration. This is a two stage process. The stages in this process are business, marketing, financial year, in percentage, graph.

Bar Graph Ppt PowerPoint Presentation Infographics Icon
This is a bar graph ppt powerpoint presentation infographics icon. This is a two stage process. The stages in this process are business, marketing, financial year, in percentage, graph.

Combo Chart Ppt PowerPoint Presentation Summary Background Images
This is a combo chart ppt powerpoint presentation summary background images. This is a two stage process. The stages in this process are business, marketing, financial year, in percentage, graph.

Area Chart Ppt PowerPoint Presentation Model Inspiration
This is a area chart ppt powerpoint presentation model inspiration. This is a two stage process. The stages in this process are financial year, in percentage, area chart, business, marketing.

Bar Chart Ppt PowerPoint Presentation Infographic Template Picture
This is a bar chart ppt powerpoint presentation infographic template picture. This is a two stage process. The stages in this process are financial, in percentage, business, marketing, bar chart.

Combo Chart Ppt PowerPoint Presentation Model Vector
This is a combo chart ppt powerpoint presentation model vector. This is a two stage process. The stages in this process are financial year, in percentage, business, marketing, combo chart.
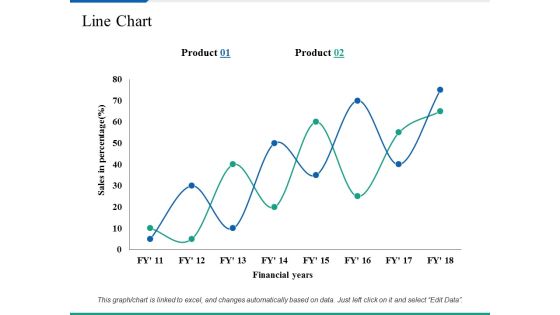
Line Chart Ppt PowerPoint Presentation Summary Clipart Images
This is a line chart ppt powerpoint presentation summary clipart images. This is a two stage process. The stages in this process are business, marketing, sales in percentage, financial years, strategy.

Employee Performance Measurement Kpi Ppt PowerPoint Presentation Inspiration Design Inspiration
This is a employee performance measurement kpi ppt powerpoint presentation inspiration design inspiration. This is a four stage process. The stages in this process are financial, business, management, marketing.

Scatter Bubble Chart Finance Ppt Powerpoint Presentation Layouts Summary
This is a scatter bubble chart finance ppt powerpoint presentation layouts summary. This is a two stage process. The stages in this process are financial, minimum, maximum, marketing, strategy.
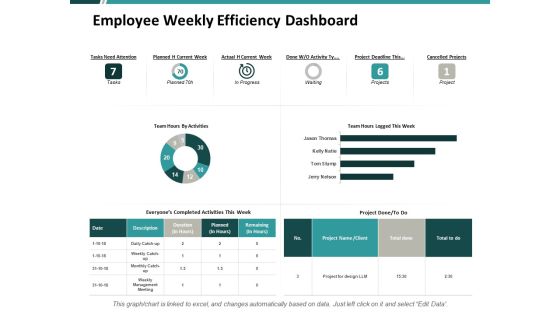
Employee Weekly Efficiency Dashboard Ppt PowerPoint Presentation Portfolio Show
This is a employee weekly efficiency dashboard ppt powerpoint presentation portfolio show. This is a three stage process. The stages in this process are financial, minimum, maximum, marketing, strategy.

Clustered Column Line Graph Ppt PowerPoint Presentation Ideas Demonstration
This is a clustered column line graph ppt powerpoint presentation ideas demonstration. This is a three stage process. The stages in this process are financial, minimum, maximum, marketing, strategy.

Bar Graph Finance Ppt PowerPoint Presentation Outline Background Designs
This is a bar graph finance ppt powerpoint presentation outline background designs. This is a three stage process. The stages in this process are financial, maximum, medium, minimum, marketing.

Customer Acquisition Cost Business Ppt Powerpoint Presentation Professional Topics
This is a customer acquisition cost business ppt powerpoint presentation professional topics. This is a two stage process. The stages in this process are financial, marketing, analysis, investment, business.
Social Media And Word Of Mouth Metrics Ppt Powerpoint Presentation Icon Portfolio
This is a social media and word of mouth metrics ppt powerpoint presentation icon portfolio. This is a ten stage process. The stages in this process are financial, marketing, analysis, investment, business.
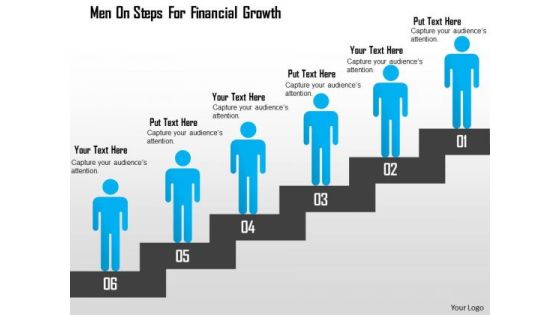
Business Diagram Men On Steps For Financial Growth Presentation Template
This business slide displays man on stairs. Use this diagram slide, in your presentations to depict growth and progress steps. Make your presentations outshine using this professional slide.
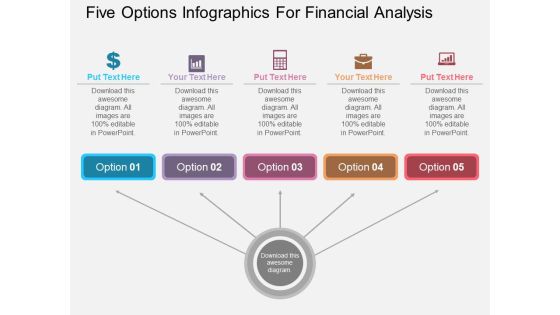
Five Options Infographics For Financial Analysis Powerpoint Template
Visually support your presentation with our above template showing five options infographic. This slide has been professionally designed to present money and finance management. This template offers an excellent background to build impressive presentation.
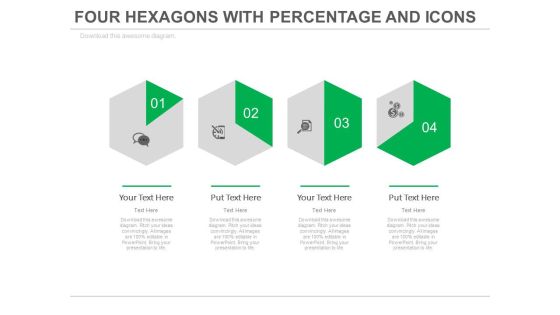
Four Steps Of Financial Growth Analysis Powerpoint Slides
This PowerPoint template with multiple Hexagons can be creatively used to present a timeline in a visual manner. This slide can also help the audience understand a 6 step process in an easier manner. The icons are totally customizable and can be edited to represent the particular process happening at that stage. It can also be used to represent different times or different activities to be carried out at different times in in a day in an office or an organization (e.g. - Medicine schedule) since the hexagon represents a clock and change of shade moves in a clockwise manner. The diagram can be used to represent a comparison or a report or an analysis of the data.
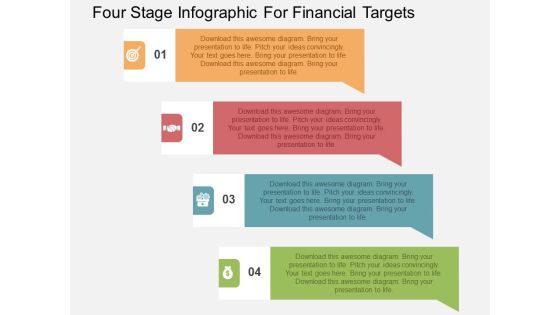
Four Stage Infographic For Financial Targets Powerpoint Templates
Our above business diagram has been designed with graphics of human faces. This slide is suitable to present concepts of strategy and solution. Use this business diagram to present your work in a more smart and precise manner.
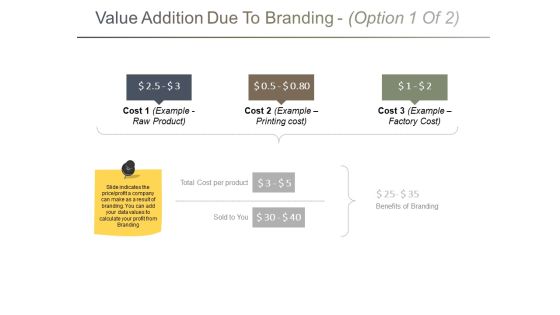
Value Addition Due To Branding Template 1 Ppt PowerPoint Presentation Portfolio Background Images
This is a value addition due to branding template 1 ppt powerpoint presentation portfolio background images. This is a three stage process. The stages in this process are cost per product, sold to you, benefits of branding, business, finance, marketing.

Value Addition Due To Branding Template 2 Ppt PowerPoint Presentation Infographics Influencers
This is a value addition due to branding template 2 ppt powerpoint presentation infographics influencers. This is a three stage process. The stages in this process are cost per product, sold to you, benefits of branding, business, finance, marketing.
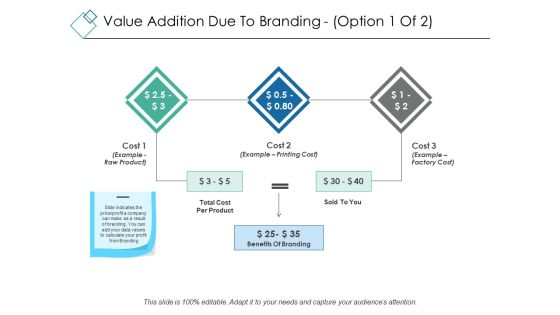
Value Addition Due To Branding Template 1 Ppt PowerPoint Presentation Portfolio Visual Aids
This is a value addition due to branding template 1 ppt powerpoint presentation portfolio visual aids. This is a three stage process. The stages in this process are business, marketing, finance, strategy benefits of branding.
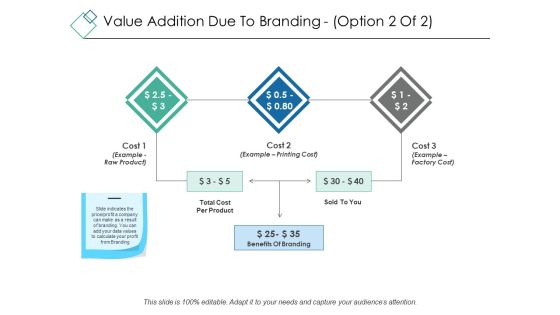
Value Addition Due To Branding Template 2 Ppt PowerPoint Presentation Ideas Sample
This is a value addition due to branding template 2 ppt powerpoint presentation ideas sample. This is a three stage process. The stages in this process are business, marketing, finance, strategy benefits of branding.
 Home
Home