Stock Market

Home Statistics Dashboard Ppt Presentation Background Images
This is a home statistics dashboard ppt presentation background images. This is a two stage process. The stages in this process are compare power, finance, growth.

Interactive Dashboard Examples Ppt Samples Download
This is a interactive dashboard examples ppt samples download. This is a two stage process. The stages in this process are call quality, network utilization.
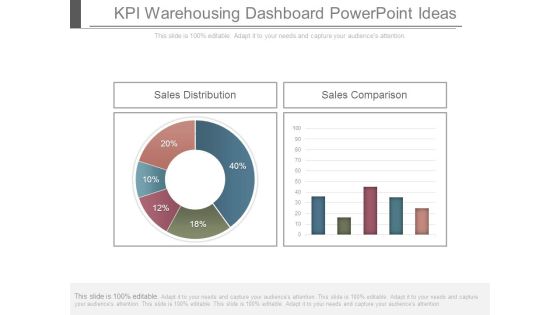
Kpi Warehousing Dashboard Powerpoint Ideas
This is a kpi warehousing dashboard powerpoint ideas. This is a two stage process. The stages in this process are sales distribution, sales comparison.

Kpis And Operations Metrics Presentation Powerpoint Example
This is a kpis and operations metrics presentation powerpoint example. This is a five stage process. The stages in this process are customer class, affiliate, sales by warehouse, warehouse, profit by affiliate.
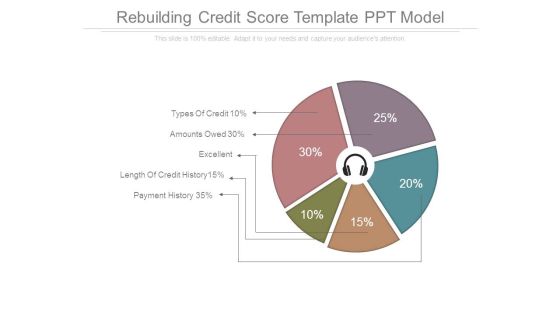
Rebuilding Credit Score Template Ppt Model
This is a rebuilding credit score template ppt model. This is a five stage process. The stages in this process are types of credit, amounts owed, excellent, length of credit history, payment history.
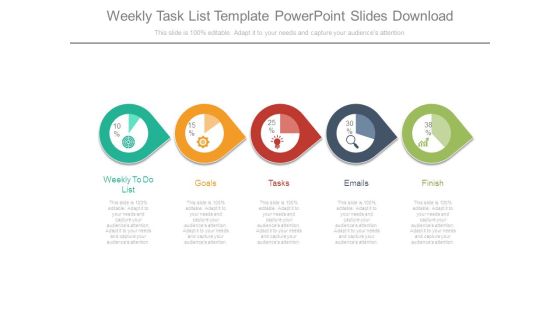
Weekly Task List Template Powerpoint Slides Download
This is a weekly task list template powerpoint slides download. This is a five stage process. The stages in this process are weekly to do list, goals, tasks, emails, finish.

Health Scorecard Table Chart Powerpoint Ideas
This is a health scorecard table chart powerpoint ideas. This is a two stage process. The stages in this process are overall score, qualitative aspects, quantitative aspects.

Demand Planning Chart Ppt Inspiration
This is a demand planning chart ppt inspiration. This is a one stage process. The stages in this process are jan, feb, mar, apr, may, jun, jul, aug, sep, oct, nov, dec.
Quality Issues And Solutions Action Plan Ppt Icon
This is a quality issues and solutions action plan ppt icon. This is a one stage process. The stages in this process are sales stage, opportunity age.
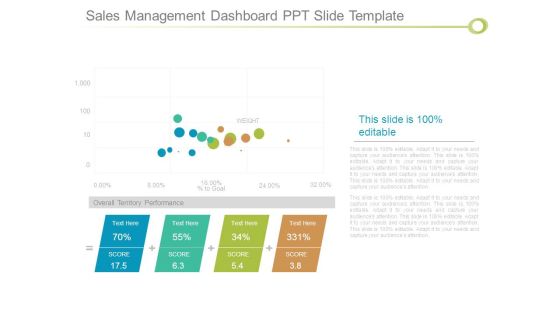
Sales Management Dashboard Ppt Slide Template
This is a sales management dashboard ppt slide template. This is a four stage process. The stages in this process are weight, goal, overall territory performance, score.
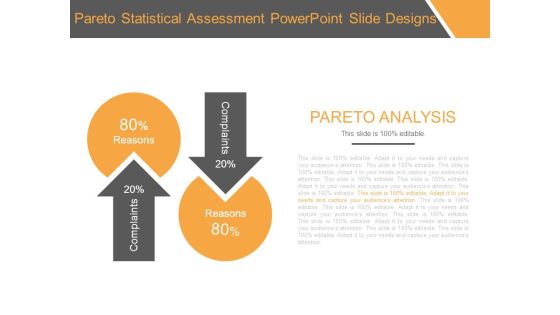
Pareto Statistical Assessment Powerpoint Slide Designs
This is a pareto statistical assessment powerpoint slide designs. This is a two stage process. The stages in this process are pareto analysis, reasons, complaints.
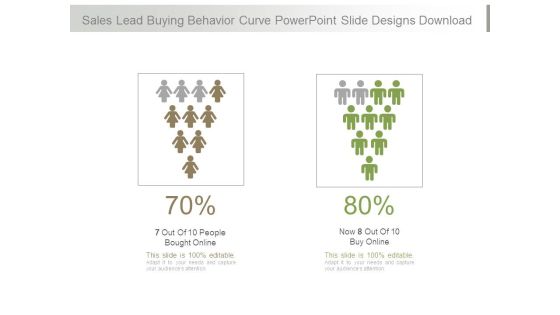
Sales Lead Buying Behavior Curve Powerpoint Slide Designs Download
This is a sales lead buying behavior curve powerpoint slide designs download. This is a two stage process. The stages in this process are 7 out of 10 people bought online, now 8 out of 10 buy online.
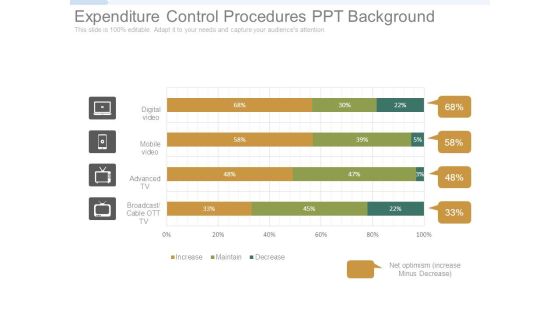
Expenditure Control Procedures Ppt Background
This is a expenditure control procedures ppt background. This is a four stage process. The stages in this process are digital video, mobile video, advanced tv, broadcast cable ott tv, increase, maintain, decrease, net optimism increase minus decrease.
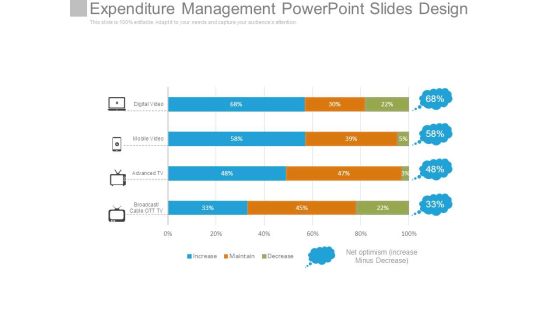
Expenditure Management Powerpoint Slides Design
This is a expenditure management powerpoint slides design. This is a four stage process. The stages in this process are digital video, mobile video, advanced tv, broadcast cable ott tv, increase, maintain, decrease, net optimism increase minus decrease.
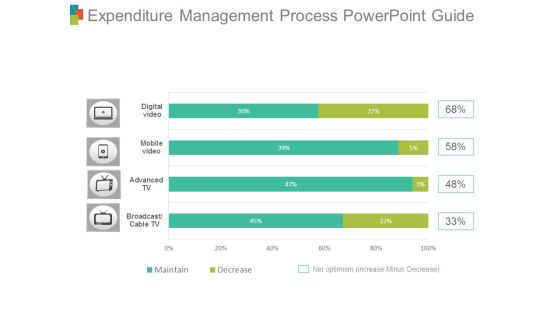
Expenditure Management Process Powerpoint Guide
This is a expenditure management process powerpoint guide. This is a four stage process. The stages in this process are digital video, mobile video, advanced tv, broadcast cable ott tv, increase, maintain, decrease, net optimism increase minus decrease.
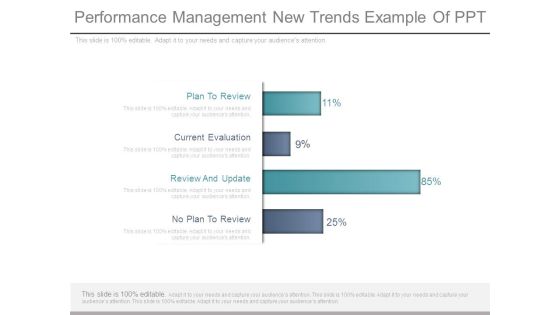
Performance Management New Trends Example Of Ppt
This is a performance management new trends example of ppt. This is a four stage process. The stages in this process are plan to review, current evaluation, review and update, no plan to review.
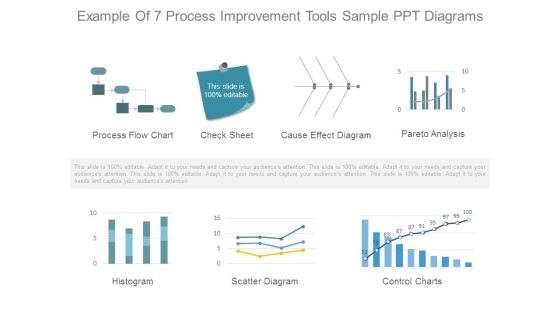
Example Of 7 Process Improvement Tools Sample Ppt Diagrams
This is a example of 7 process improvement tools sample ppt diagrams. This is a seven stage process. The stages in this process are process flow chart, check sheet, cause effect diagram, pareto analysis, histogram, scatter diagram, control charts.

Project Management Gantt Chart Ppt Powerpoint Images
This is a project management gantt chart ppt powerpoint images. This is a seven stage process. The stages in this process are requirement, setup, development, testing, deployment, training, support, project ma, review, coding, integration tests, customer tests, go live, training, support, project management.

80 20 Rule For Project Management Ppt Powerpoint Layout
This is a 80 20 rule for project management ppt powerpoint layout. This is a two stage process. The stages in this process are 80 percent results, 20 percent effort.

7 Tools For Total Quality Management Diagram Powerpoint Guide
This is a 7 tools for total quality management diagram powerpoint guide. This is a six stage process. The stages in this process are pareto chart, histogram, run chart, check sheet, fishbone, flow chart, scatter diagram.

Quality Management Tools Ppt Powerpoint Guide
This is a quality management tools ppt powerpoint guide. This is a seven stage process. The stages in this process are control chart, flow chart, cause effect diagram, pareto chart, the 7 quality tools, for process improvement, check sheet, histogram, scatter plot.

Graphical Exploratory Data Analysis Powerpoint Slides Clipart
This is a graphical exploratory data analysis powerpoint slides clipart. This is a five stage process. The stages in this process are techniques, information, predictive, focuses, business.
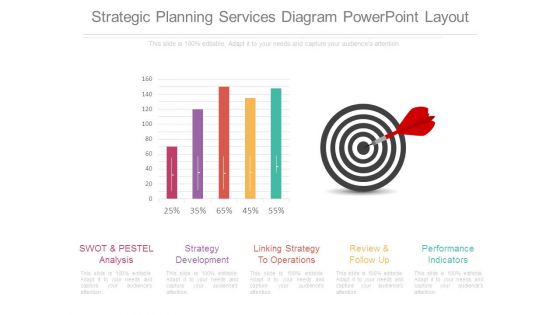
Strategic Planning Services Diagram Powerpoint Layout
This is a strategic planning services diagram powerpoint layout. This is a five stage process. The stages in this process are swot and pestel analysis, strategy development, linking strategy to operations, review and follow up, performance indicators.

Product Roadmap Product Launch Deliverables Powerpoint Slide Images
This is a product roadmap product launch deliverables powerpoint slide images. This is a five stage process. The stages in this process are business, planning, years, timeline, strategy.
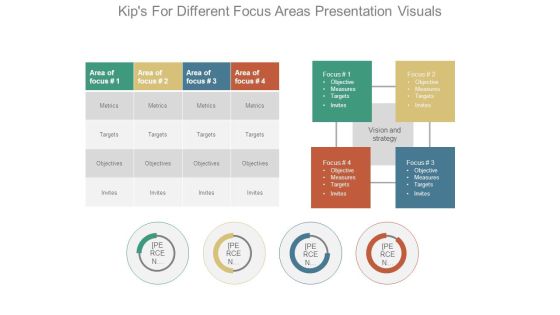
Kips For Different Focus Areas Presentation Visuals
This is a kips for different focus areas presentation visuals. This is a four stage process. The stages in this process are area of focus, metrics, targets, objectives, invites, vision and strategy, focus.

Gross Margin Improvement Bar Charts Powerpoint Slide Images
This is a gross margin improvement bar charts powerpoint slide images. This is a two stage process. The stages in this process are chart title.

Gross Margin Improvement Bar Graph Dashboard Powerpoint Slide Download
This is a gross margin improvement bar graph dashboard powerpoint slide download. This is a two stage process. The stages in this process are chart title.

Gross Margin Improvement Line Chart Powerpoint Templates
This is a gross margin improvement line chart powerpoint templates. This is a two stage process. The stages in this process are chart.

Budgeting And Business Planning Powerpoint Guide
This is a budgeting and business planning powerpoint guide. This is a four stage process. The stages in this process are digital video, mobile video, advanced tv, broadcast, cable ott tv.
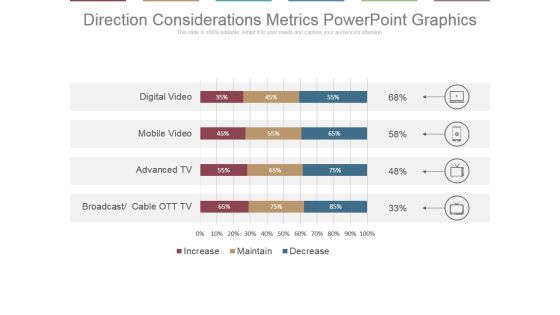
Direction Considerations Metrics Powerpoint Graphics
This is a direction considerations metrics powerpoint graphics. This is a four stage process. The stages in this process are digital video, mobile video, advanced tv, broadcast, cable ott tv.
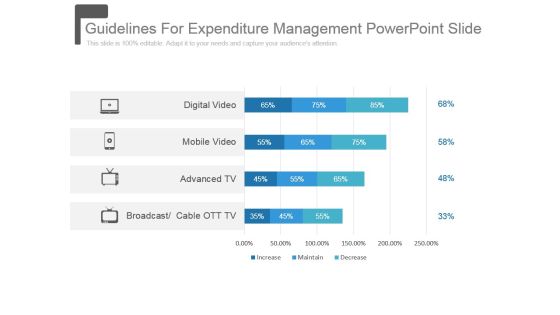
Guidelines For Expenditure Management Powerpoint Slide
This is a guidelines for expenditure management powerpoint slide. This is a four stage process. The stages in this process are digital video, mobile video, advanced tv, broadcast, cable ott tv.
Spending Directions For Media Channels Ppt Icon
This is a spending directions for media channels ppt icon. This is a four stage process. The stages in this process are digital video, mobile video, advanced tv, broadcast, cable ott tv.

Data Driven Analytics Chart Powerpoint Presentation Templates
This is a data driven analytics chart powerpoint presentation templates. This is a five stage process. The stages in this process are category.
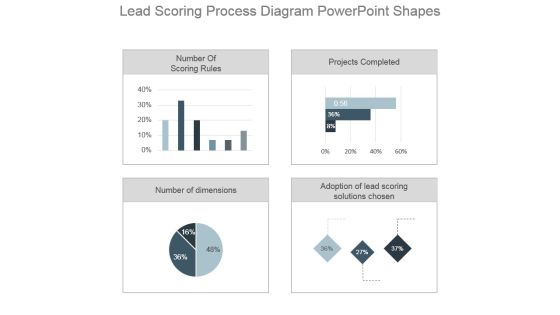
Lead Scoring Process Diagram Powerpoint Shapes
This is a lead scoring process diagram powerpoint shapes. This is a four stage process. The stages in this process are number of scoring rules, projects completed, number of dimensions, adoption of lead scoring solutions chosen.

Lead Scoring Lead Nurturing Ideas Dashboard Ppt Sample Download
This is a lead scoring lead nurturing ideas dashboard ppt sample download. This is a four stage process. The stages in this process are adoption of lead scoring solutions chosen, number of dimensions, projects completed, number of scoring rules.
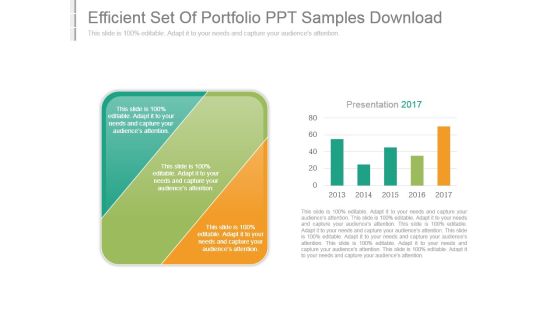
Efficient Set Of Portfolio Ppt Samples Download
This is a efficient set of portfolio ppt samples download. This is a two stage process. The stages in this process are presentation.
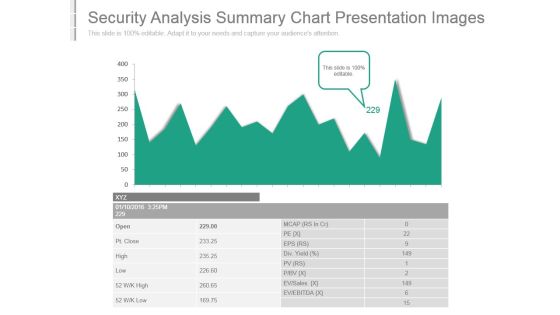
Security Analysis Summary Chart Presentation Images
This is a security analysis summary chart presentation images. This is a one stage process. The stages in this process are ev ebitda, ev sales, div yield, open, pt close, high, low, mcap, eps.

Possible Set Of Investments Ppt Background
This is a possible set of investments ppt background. This is a two stage process. The stages in this process are presentation.

Security Analysis Trends Ppt Example
This is a security analysis trends ppt example. This is a one stage process. The stages in this process are open, pt close, high, low, mcap, pe, eps, div, pv, p bv, ev sales, ev ebidta.
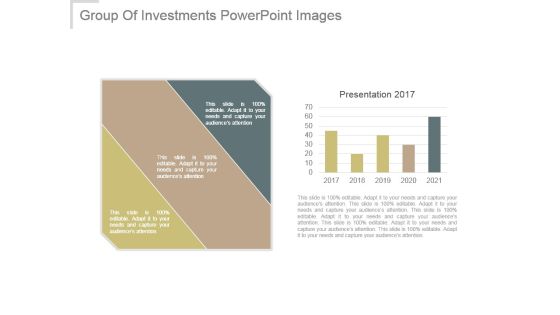
Group Of Investments Powerpoint Images
This is a group of investments powerpoint images. This is a two stage process. The stages in this process are presentation.

Security Analysis And Portfolio Management Powerpoint Slide Designs
This is a security analysis and portfolio management powerpoint slide designs. This is a one stage process. The stages in this process are xyz, open, pt close, high, low, mcap, pe, eps , div yield, pv, p bv, ev sales, ev ebitda, security analysis.
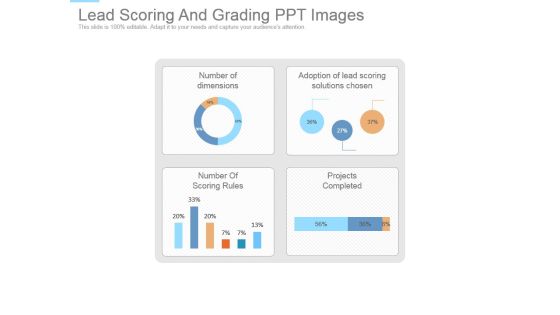
Lead Scoring And Grading Ppt Images
This is a lead scoring and grading ppt images. This is a four stage process. The stages in this process are number of dimensions, adoption of lead scoring solutions chosen, number of scoring rules, projects completed.

Big Data Opportunities And Challenges In Construction Ppt PowerPoint Presentation Outline
This is a big data opportunities and challenges in construction ppt powerpoint presentation outline. This is a three stage process. The stages in this process are finance, management, growth, percentage, business.

Company Cost Structure Ppt PowerPoint Presentation Influencers
This is a company cost structure ppt powerpoint presentation influencers. This is a five stage process. The stages in this process are online courses, virtual classroom, company business, one on one tutoring, e learning app.
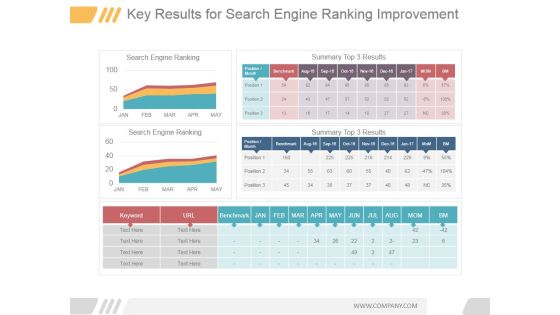
Key Results For Search Engine Ranking Improvement Good Ppt PowerPoint Presentation Model
This is a key results for search engine ranking improvement good ppt powerpoint presentation model. This is a three stage process. The stages in this process are search engine ranking, summary top 3 results, jan, feb, mar, apr.
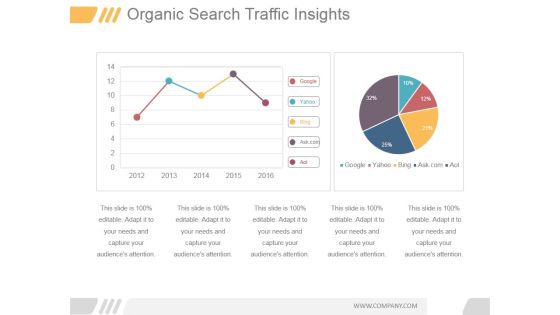
Organic Search Traffic Insights Ppt PowerPoint Presentation Files
This is a organic search traffic insights ppt powerpoint presentation files. This is a five stage process. The stages in this process are google, yahoo, bing, ask com, aol.
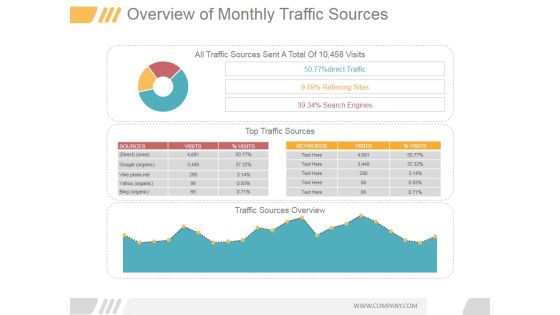
Overview Of Monthly Traffic Sources Ppt PowerPoint Presentation Visuals
This is a overview of monthly traffic sources ppt powerpoint presentation visuals. This is a three stage process. The stages in this process are all traffic sources sent a total of 10 458 visits, 50 77 percentage direct traffic, 9 89 percentage referring sites, 39 34 percentage search engines, sources, visits.
Sales Performance Tracking Ppt PowerPoint Presentation Deck
This is a sales performance tracking ppt powerpoint presentation deck. This is a four stage process. The stages in this process are top opportunities, sales goal ytd, sales funnel, company, value, company.

Web Traffic Management Ppt PowerPoint Presentation Picture
This is a web traffic management ppt powerpoint presentation picture. This is a four stage process. The stages in this process are website ranks in july, weekly, traffic reach in last 12 months share of internet users who visited the site in july 2016, jan, feb, mar, apr.

Website Performance Analytics Ppt PowerPoint Presentation Show
This is a website performance analytics ppt powerpoint presentation show. This is a three stage process. The stages in this process are conversion rate, visits, average visit value goal, return on investment ric, total visits, cost.
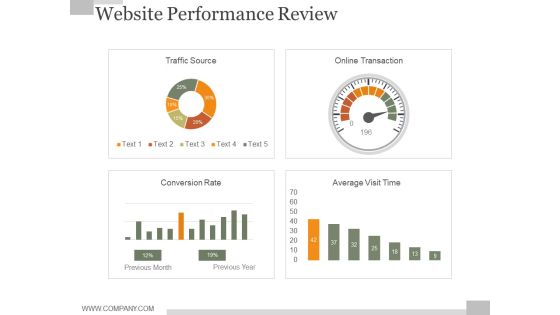
Website Performance Review Ppt PowerPoint Presentation Background Designs
This is a website performance review ppt powerpoint presentation background designs. This is a stage process. The stages in this process are conversion rate, visits.

Crm Dashboard Current Lead Status Ppt PowerPoint Presentation Influencers
This is a crm dashboard current lead status ppt powerpoint presentation influencers. This is a five stage process. The stages in this process are new, assigned, process, converted, recycle.

Funnel Ppt PowerPoint Presentation Visuals
This is a funnel ppt powerpoint presentation visuals. This is a seven stage process. The stages in this process are evaluation, relations, familiarity, awareness, planning, intent, goals.
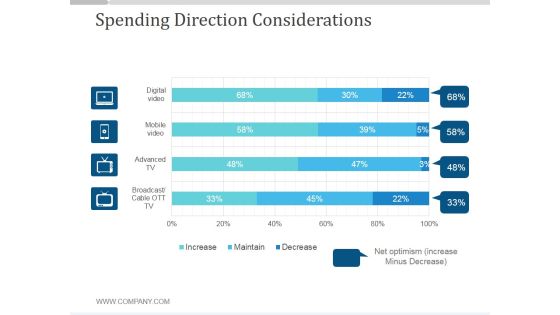
Spending Direction Considerations Ppt PowerPoint Presentation Sample
This is a spending direction considerations ppt powerpoint presentation sample. This is a four stage process. The stages in this process are business, increase, maintain, decrease, finance.

Core Strategic Audience Ppt PowerPoint Presentation Inspiration
This is a core strategic audience ppt powerpoint presentation inspiration. This is a seven stage process. The stages in this process are percentage, finance, management, business.

Team Target And Achievements Slide Ppt PowerPoint Presentation Themes
This is a team target and achievements slide ppt powerpoint presentation themes. This is a six stage process. The stages in this process are jan, feb ,mar, apr, may, jun.

Current State Analysis Revenue Versus Target Ppt PowerPoint Presentation Background Designs
This is a current state analysis revenue versus target ppt powerpoint presentation background designs. This is a six stage process. The stages in this process are actual, target, actual vs target value.

Geographic Segmentation Ppt PowerPoint Presentation Good
This is a geographic segmentation ppt powerpoint presentation good. This is a five stage process. The stages in this process are climate, counties, counties, region, city, density.

Milestones For The Next Reporting Period Ppt PowerPoint Presentation Files
This is a milestones for the next reporting period ppt powerpoint presentation files. This is a seven stage process. The stages in this process are jan, feb, mar, apr, may, jun.

Target Modelling Ppt PowerPoint Presentation Layout
This is a target modelling ppt powerpoint presentation layout. This is a six stage process. The stages in this process are goal, conservative growth, moderate growth, moderate aggressive, growth, aggressive growth, more diversification, concentrated growth, concentrated, aggressive growth.
 Home
Home