Stock Market Analysis
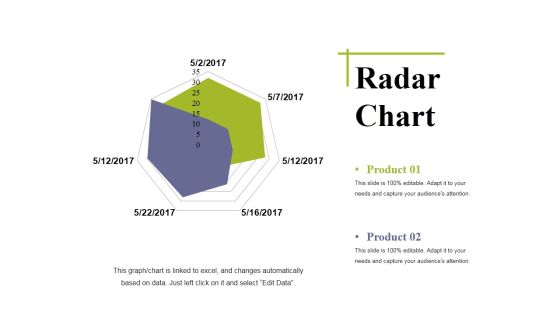
Radar Chart Ppt PowerPoint Presentation Outline Deck
This is a radar chart ppt powerpoint presentation outline deck. This is a two stage process. The stages in this process are radar chart, marketing, strategy, analysis, business.
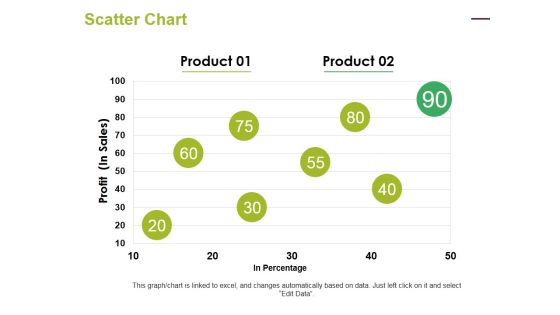
Scatter Chart Ppt PowerPoint Presentation Inspiration Professional
This is a scatter chart ppt powerpoint presentation inspiration professional. This is a two stage process. The stages in this process are scatter chart, finance, marketing, analysis, business.

Stacked Bar Ppt PowerPoint Presentation Ideas Inspiration
This is a stacked bar ppt powerpoint presentation ideas inspiration. This is a two stage process. The stages in this process are stacked bar, finance, marketing, analysis, business.

Area Chart Ppt PowerPoint Presentation Styles Influencers
This is a area chart ppt powerpoint presentation styles influencers. This is a two stage process. The stages in this process are area chart, finance, analysis, business, marketing.

Bubble Chart Ppt PowerPoint Presentation Inspiration Portfolio
This is a bubble chart ppt powerpoint presentation inspiration portfolio. This is a two stage process. The stages in this process are bubble chart, finance, analysis, marketing, strategy.

Rader Chart Ppt PowerPoint Presentation Portfolio Deck
This is a rader chart ppt powerpoint presentation portfolio deck. This is a two stage process. The stages in this process are radar chart, finance, analysis, marketing, business.

Clustered Bar Ppt PowerPoint Presentation Ideas Information
This is a clustered bar ppt powerpoint presentation ideas information. This is a three stage process. The stages in this process are clustered bar, finance, marketing, strategy, analysis.
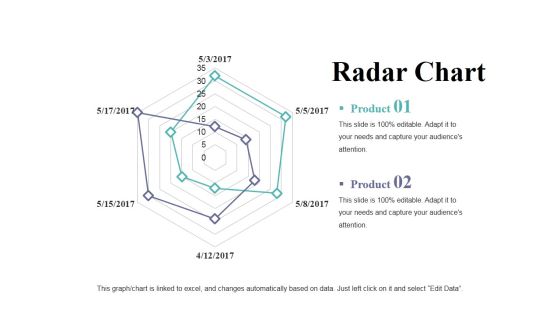
Radar Chart Ppt PowerPoint Presentation Portfolio Clipart
This is a radar chart ppt powerpoint presentation portfolio clipart. This is a two stage process. The stages in this process are radar chart, finance, analysis, marketing, business.

area chart ppt powerpoint presentation inspiration designs
This is a area chart ppt powerpoint presentation inspiration designs. This is a two stage process. The stages in this process are area chart, finance, analysis, marketing, business.

bubble chart ppt powerpoint presentation inspiration elements
This is a bubble chart ppt powerpoint presentation inspiration elements. This is a two stage process. The stages in this process are bubble chart, finance, analysis, marketing, business.

Area Chart Ppt PowerPoint Presentation Portfolio Show
This is a area chart ppt powerpoint presentation portfolio show. This is a two stage process. The stages in this process are area chart, finance, analysis, business, marketing.
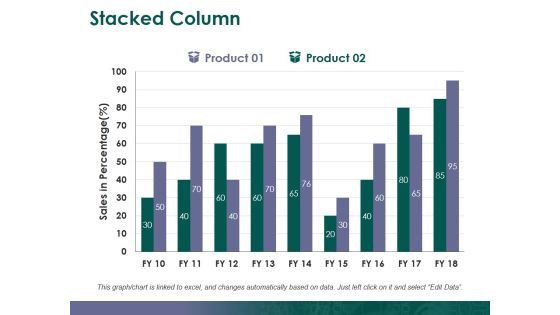
Stacked Column Ppt PowerPoint Presentation Gallery Graphics
This is a stacked column ppt powerpoint presentation gallery graphics. This is a two stage process. The stages in this process are stacked column, finance, analysis, business, marketing.

Combo Chart Ppt PowerPoint Presentation Infographics Good
This is a combo chart ppt powerpoint presentation infographics good. This is a three stage process. The stages in this process are combo chart, finance, analysis, business, marketing.

Income Statement Overview Ppt PowerPoint Presentation Model Example
This is a income statement overview ppt powerpoint presentation model example. This is a five stage process. The stages in this process are business, finance, marketing, strategy, analysis.

Activity Ratios Ppt PowerPoint Presentation Slides Layout
This is a activity ratios ppt powerpoint presentation slides layout. This is a two stage process. The stages in this process are business, finance, analysis, strategy, marketing.
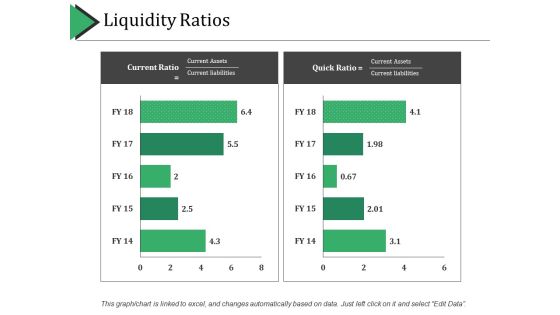
Liquidity Ratios Ppt PowerPoint Presentation Professional Ideas
This is a liquidity ratios ppt powerpoint presentation professional ideas. This is a two stage process. The stages in this process are business, finance, marketing, strategy, analysis.
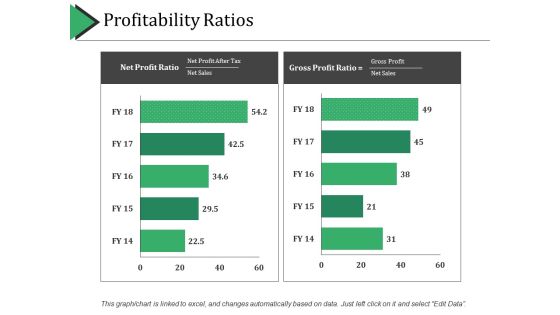
Profitability Ratios Ppt PowerPoint Presentation Layouts Gridlines
This is a profitability ratios ppt powerpoint presentation layouts gridlines. This is a two stage process. The stages in this process are business, finance, marketing, strategy, analysis.

Taxation Ppt PowerPoint Presentation Outline Templates
This is a taxation ppt powerpoint presentation outline templates. This is a one stage process. The stages in this process are business, finance, marketing, strategy, analysis.
Stacked Bar Ppt PowerPoint Presentation Icon Objects
This is a stacked bar ppt powerpoint presentation icon objects. This is a two stage process. The stages in this process are stacked bar, finance, analysis, marketing, strategy.

Column Chart Ppt PowerPoint Presentation Styles Clipart
This is a column chart ppt powerpoint presentation styles clipart. This is a two stage process. The stages in this process are column chart, finance, marketing, analysis, business.
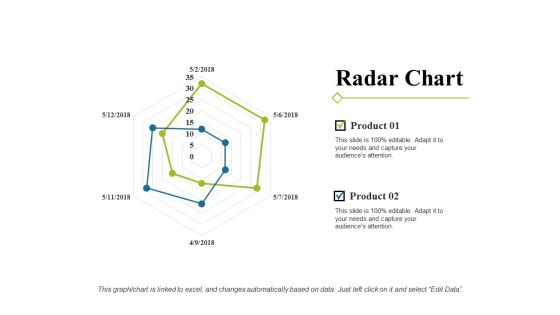
Radar Chart Ppt PowerPoint Presentation Portfolio Show
This is a radar chart ppt powerpoint presentation portfolio show. This is a two stage process. The stages in this process are radar chart, finance, marketing, strategy, analysis.

Statistics Results Ppt PowerPoint Presentation Gallery Graphics Pictures
This is a statistics results ppt powerpoint presentation gallery graphics pictures. This is a two stage process. The stages in this process are business, finance, marketing, strategy, analysis.

Bubble Chart Ppt PowerPoint Presentation Icon Gridlines
This is a bubble chart ppt powerpoint presentation icon gridlines. This is a two stage process. The stages in this process are bubble chart, finance, marketing, strategy, analysis.

Clustered Column Ppt PowerPoint Presentation Gallery Microsoft
This is a clustered column ppt powerpoint presentation gallery microsoft. This is a two stage process. The stages in this process are clustered column, finance, marketing, strategy, analysis.

Clustered Bar Ppt PowerPoint Presentation Professional Guidelines
This is a clustered bar ppt powerpoint presentation professional guidelines. This is a three stage process. The stages in this process are clustered bar, finance, marketing, strategy, analysis.

Area Chart Ppt PowerPoint Presentation File Icons
This is a area chart ppt powerpoint presentation file icons. This is a two stage process. The stages in this process are area chart, finance, marketing, strategy, analysis.

Area Chart Ppt PowerPoint Presentation Guidelines
This is a area chart ppt powerpoint presentation guidelines. This is a two stage process. The stages in this process are business, marketing, analysis, area chart, finance.

Area Chart Ppt PowerPoint Presentation Summary Guidelines
This is a area chart ppt powerpoint presentation summary guidelines. This is a two stage process. The stages in this process are area chart, finance, analysis, investment, marketing.

Bar Graphs Ppt PowerPoint Presentation Gallery Elements
This is a bar graphs ppt powerpoint presentation gallery elements. This is a two stage process. The stages in this process are Bar Graphs, Business, Strategy, Marketing, Analysis.

Google Trends Ppt PowerPoint Presentation Slides Demonstration
This is a google trends ppt powerpoint presentation slides demonstration. This is a three stage process. The stages in this process are business, finance, marketing, investment, analysis.

Bar Chart Ppt PowerPoint Presentation Professional Clipart Images
This is a bar chart ppt powerpoint presentation professional clipart images. This is a three stage process. The stages in this process are business, finance, analysis, investment, marketing.

Bubble Chart Finance Ppt PowerPoint Presentation Slides Show
This is a bubble chart finance ppt powerpoint presentation slides show. This is a two stage process. The stages in this process are finance, marketing, analysis, business, investment.

Stratification Ppt PowerPoint Presentation Gallery Graphics Download
This is a stratification ppt powerpoint presentation gallery graphics download. This is a three stage process. The stages in this process are business, finance, marketing, strategy, analysis.
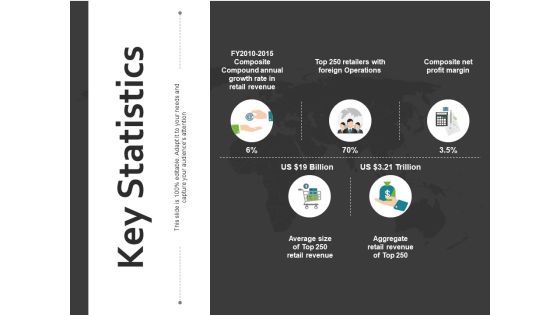
Key Statistics Ppt PowerPoint Presentation Inspiration Styles
This is a key statistics ppt powerpoint presentation inspiration styles. This is a five stage process. The stages in this process are finance, analysis, business, investment, marketing.

Pie Chart Finance Ppt Powerpoint Presentation Introduction
This is a pie chart finance ppt powerpoint presentation introduction. This is a three stage process. The stages in this process are finance, marketing, analysis, investment, strategy.
Project Tracking Dashboard Template Ppt Sample
This is a project tracking dashboard template ppt sample. This is a five stage process. The stages in this process are requirements, analytics, needs, performance, analysis.
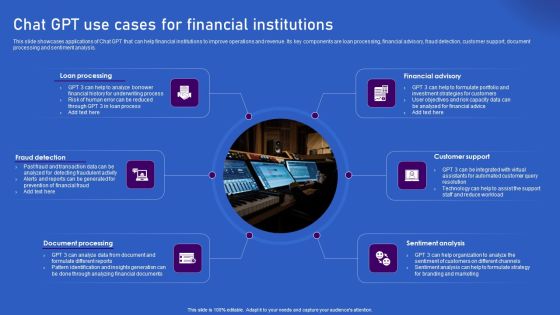
Ways Artificial Intelligence Is Transforming Finance Sector Chat GPT Use Cases For Financial Institutions Microsoft PDF
This slide showcases applications of Chat GPT that can help financial institutions to improve operations and revenue. Its key components are loan processing, financial advisory, fraud detection, customer support, document processing and sentiment analysis. Whether you have daily or monthly meetings, a brilliant presentation is necessary. Ways Artificial Intelligence Is Transforming Finance Sector Chat GPT Use Cases For Financial Institutions Microsoft PDF can be your best option for delivering a presentation. Represent everything in detail using Ways Artificial Intelligence Is Transforming Finance Sector Chat GPT Use Cases For Financial Institutions Microsoft PDF and make yourself stand out in meetings. The template is versatile and follows a structure that will cater to your requirements. All the templates prepared by Slidegeeks are easy to download and edit. Our research experts have taken care of the corporate themes as well. So, give it a try and see the results.

Business Plan With Pricing Strategy Diagram Ppt Sample Download
This is a business plan with pricing strategy diagram ppt sample download. This is a nine stage process. The stages in this process are environmental analysis, swot analysis, industry background, competitor analysis, marketing plan, operations plan, financial plan, management leadership, pricing strategy.

Comparison Ppt PowerPoint Presentation Slides Graphic Images
This is a comparison ppt powerpoint presentation slides graphic images. This is a three stage process. The stages in this process are business, management, financial, strategy, analysis.
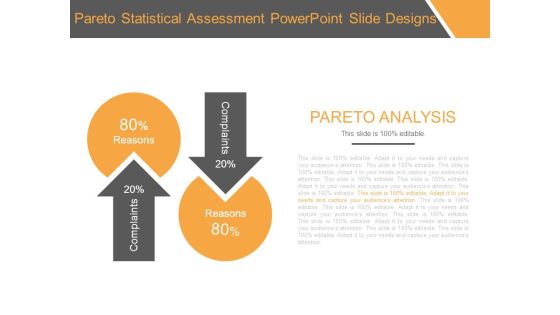
Pareto Statistical Assessment Powerpoint Slide Designs
This is a pareto statistical assessment powerpoint slide designs. This is a two stage process. The stages in this process are pareto analysis, reasons, complaints.

Combo Chart Ppt PowerPoint Presentation Pictures Background
This is a combo chart ppt powerpoint presentation pictures background. This is a eight stage process. The stages in this process are combo chart, growth, strategy, analysis, business.
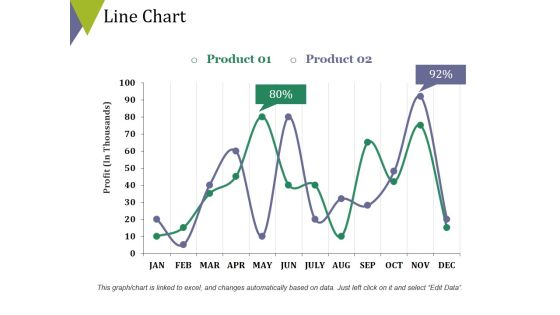
Line Chart Ppt PowerPoint Presentation Portfolio Example
This is a line chart ppt powerpoint presentation portfolio example. This is a two stage process. The stages in this process are line chart, finance, business, analysis, strategy.

Column Chart Ppt PowerPoint Presentation Inspiration Inspiration
This is a column chart ppt powerpoint presentation inspiration inspiration. This is a two stage process. The stages in this process are column chart, growth, strategy, business, analysis.

Business Management And Administration Ppt Presentation Slides
This is a business management and administration ppt presentation slides. This is a seven stage process. The stages in this process are business management and administration, administrative and information support, business analysis, business financial mgmt and accounting, human resources, management, marketing.

Portfolio Selection Allocation Ppt PowerPoint Presentation Designs
This is a portfolio selection allocation ppt powerpoint presentation designs. This is a four stage process. The stages in this process are alternatives, intl stocks, intl bonds, value.

Business Diagram With Dollars Money PowerPoint Templates And PowerPoint Themes 1012
Visually support your Microsoft office PPT Presentation with our above template illustrating a business diagram on stack of dollars. This image represents the concept of financial analysis. This image has been conceived to enable you to emphatically communicate your ideas in your Business PPT presentations on finance, market, investment and success. Create captivating presentations to deliver comparative and weighted arguments.

Business Case Development Approach Ppt Slide Design
This is a business case development approach ppt slide design. This is a eight stage process. The stages in this process are identify project needs, estimate costs, project benefits, documents assumptions and rationale, document non financial factors, perform sensitivity analysis, prepare management presentation, use develop business case template.

Business Case Development Tools Presentation Images
This is a business case development tools presentation images. This is a nine stage process. The stages in this process are user guide, business profile, it spending tco, initiative costs, initiative benefits, financial analysis, non financial kpls optional, business case reports, initiative descriptions reference only.
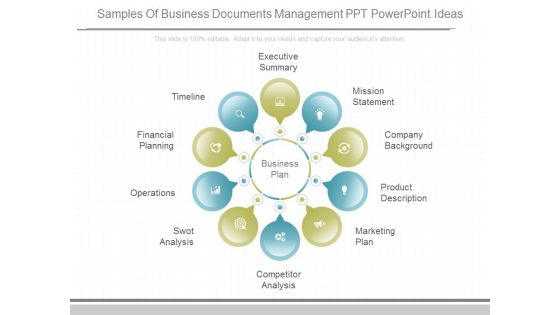
Samples Of Business Documents Management Ppt Powerpoint Ideas
This is a samples of business documents management ppt powerpoint ideas. This is a ten stage process. The stages in this process are business plan, executive summary, mission statement, company background, product description, marketing plan, competitor analysis, swot analysis, operations, financial planning, timeline.

Percentage Data Growth Chart Powerpoint Slides
This PowerPoint template has been designed with percentage data growth chart. Download this PPT chart to depict financial ratio analysis. This PowerPoint slide is of great help in the business sector to make realistic presentations and provides effective way of presenting your newer thoughts.
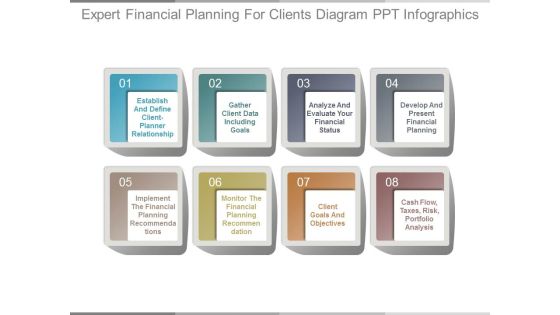
Expert Financial Planning For Clients Diagram Ppt Infographics
This is a expert financial planning for clients diagram ppt infographics. This is a ten stage process. The stages in this process are establish and define client planner relationship, gather client data including goals, analyze and evaluate your financial status, develop and present financial planning, implement the financial planning recommendations, monitor the financial planning recommendation, client goals and objectives, cash flow, taxes, risk, portfolio analysis.

Investment Portfolio Management Ppt Design
This is a investment portfolio management ppt design. This is a five stage process. The stages in this process are needs analysis, strategy, financial concept, client profile, implementation.
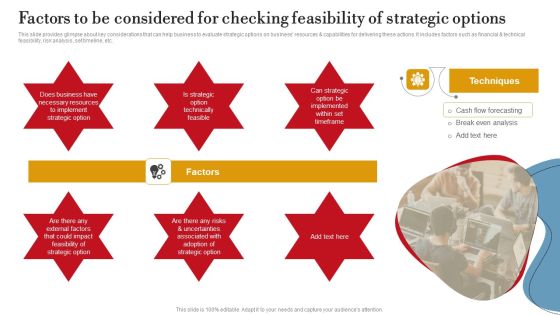
Factors To Be Considered For Checking Feasibility Of Strategic Options Rules PDF
This slide provides glimpse about key considerations that can help business to evaluate strategic options on business resources and capabilities for delivering these actions. It includes factors such as financial and technical feasibility, risk analysis, set timeline, etc. The Factors To Be Considered For Checking Feasibility Of Strategic Options Rules PDF is a compilation of the most recent design trends as a series of slides. It is suitable for any subject or industry presentation, containing attractive visuals and photo spots for businesses to clearly express their messages. This template contains a variety of slides for the user to input data, such as structures to contrast two elements, bullet points, and slides for written information. Slidegeeks is prepared to create an impression.

Financial Performance Objective Ppt Slide Powerpoint Slide Designs
This is a financial performance objective ppt slide powerpoint slide designs. This is a four stage process. The stages in this process are market performance objective, financial performance objective, personal objective, societal objective.
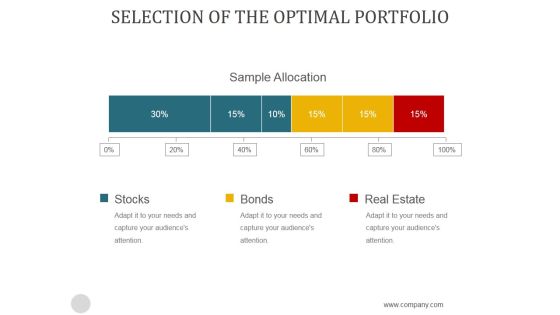
Selection Of The Optimal Portfolio Ppt PowerPoint Presentation Design Templates
This is a selection of the optimal portfolio ppt powerpoint presentation design templates. This is a three stage process. The stages in this process are sample allocation, stocks, bonds, real estate.
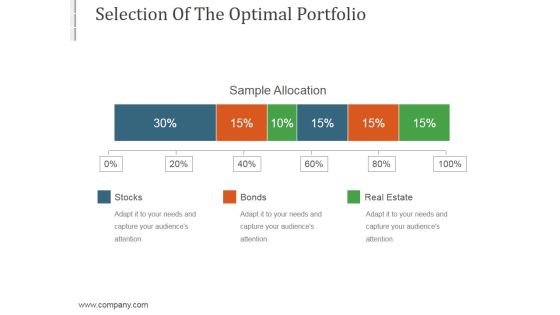
Selection Of The Optimal Portfolio Template10 Ppt PowerPoint Presentation Examples
This is a selection of the optimal portfolio template10 ppt powerpoint presentation examples. This is a three stage process. The stages in this process are stocks, real estate, bonds.

Selection Of The Optimal Portfolio Template 1 Ppt Powerpoint Presentation Summary Backgrounds
This is a selection of the optimal portfolio template 1 ppt powerpoint presentation summary backgrounds. This is a six stage process. The stages in this process are type of investment, share, finance, stocks, business.

Arrow Pie Finance PowerPoint Templates And PowerPoint Themes 1012
Create stunning Microsoft office PPT Presentations with our professional templates containing a graphic of arrow pie chart. This image clearly defines the concept of statistics, financial analysis. This image has been conceived to enable you to emphatically communicate your ideas in your Business Marketing PPT presentations on business reviews, reports and ratings. Deliver amazing presentations to mesmerize your audience. Our PPT images are so ideally designed that it reveals the very basis of our PPT template to make your clients understand.
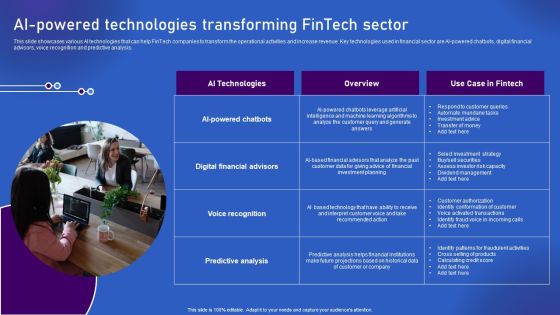
Ways Artificial Intelligence Is Transforming Finance Sector AI Powered Technologies Transforming Fintech Diagrams PDF
This slide showcases various AI technologies that can help FinTech companies to transform the operational activities and increase revenue. Key technologies used in financial sector are AI-powered chatbots, digital financial advisors, voice recognition and predictive analysis. If you are looking for a format to display your unique thoughts, then the professionally designed Ways Artificial Intelligence Is Transforming Finance Sector AI Powered Technologies Transforming Fintech Diagrams PDF is the one for you. You can use it as a Google Slides template or a PowerPoint template. Incorporate impressive visuals, symbols, images, and other charts. Modify or reorganize the text boxes as you desire. Experiment with shade schemes and font pairings. Alter, share or cooperate with other people on your work. Download Ways Artificial Intelligence Is Transforming Finance Sector AI Powered Technologies Transforming Fintech Diagrams PDF and find out how to give a successful presentation. Present a perfect display to your team and make your presentation unforgettable.

Key Strategies For Investors Business Services Extension Guidelines PDF
This slide provides an overview of strategies to help investors in portfolio growth. The strategies covered are diversification, market timing, investment in growth sectors, buy and hold stocks. Presenting Key Strategies For Investors Business Services Extension Guidelines PDF to dispense important information. This template comprises four stages. It also presents valuable insights into the topics including Buy And Hold, Diversification, Market Timing. This is a completely customizable PowerPoint theme that can be put to use immediately. So, download it and address the topic impactfully.
 Home
Home