Status Icons
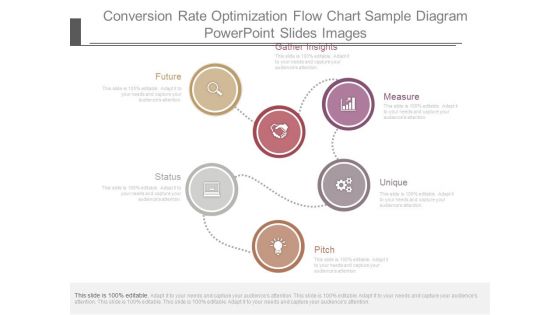
Conversion Rate Optimization Flow Chart Sample Diagram Powerpoint Slides Images
This is a conversion rate optimization flow chart sample diagram powerpoint slides images. This is a five stage process. The stages in this process are gather insights, measure, unique, pitch, status, future.

Strategic Partnership Management Plan Partner Executive Performance Dashboard Guidelines PDF
This slide covers the partner executive dashboard that focuses on revenues, pipeline, capability scoreboard, key program activity summary, etc. Deliver and pitch your topic in the best possible manner with this strategic partnership management plan partner executive performance dashboard guidelines pdf. Use them to share invaluable insights on plan acceptance and approval status, revenue, mdf approval status, gamification status, pipeline or close, capability scorecard summary and impress your audience. This template can be altered and modified as per your expectations. So, grab it now.
IT Security Dashboard For Threat Tracking In Information Technology Security Ppt Inspiration Gallery PDF
This slide depicts the dashboard for threat tracking in cyber security by covering monthly threat status, current risk status, threat-based on the role, threats by owners, risk by threats, and threat report. Deliver an awe inspiring pitch with this creative it security dashboard for threat tracking in information technology security ppt inspiration gallery pdf bundle. Topics like current risk status, threat report, risk by threats, threats based on role, threats by owners can be discussed with this completely editable template. It is available for immediate download depending on the needs and requirements of the user.

KPI Metrics Dashboard To Effectively Track Cyber Threat Management Demonstration PDF
The purpose of this slide is to highlight performance KPI dashboard used to monitor the cyber threat management. The metrics highlighted in the slide are risk score, compliance status, threat level, monitoring and operational status. Deliver an awe inspiring pitch with this creative KPI Metrics Dashboard To Effectively Track Cyber Threat Management Demonstration PDF bundle. Topics like Threat Status, Current Risk, Threat Report can be discussed with this completely editable template. It is available for immediate download depending on the needs and requirements of the user.
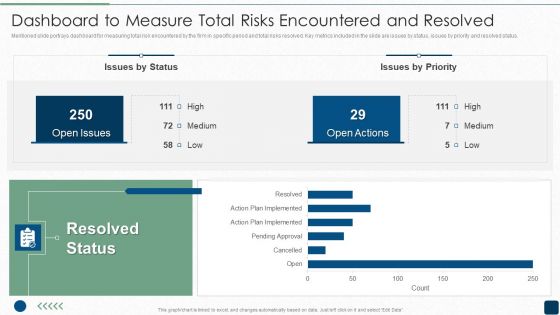
ISO 27001 Certification Procedure Dashboard To Measure Total Risks Encountered And Resolved Topics PDF
Mentioned slide portrays dashboard for measuring total risk encountered by the firm in specific period and total risks resolved. Key metrics included in the slide are issues by status, issues by priority and resolved status.Deliver and pitch your topic in the best possible manner with this ISO 27001 Certification Procedure Dashboard To Measure Total Risks Encountered And Resolved Topics PDF. Use them to share invaluable insights on Resolved Status, Open Issues, Open Actions and impress your audience. This template can be altered and modified as per your expectations. So, grab it now.

Network Risks Management And Barriers Dashboard Ppt PowerPoint Presentation Gallery Graphic Tips PDF
This slide represents a dashboard of network risk management. It also includes problem servers , workstations and their status, unmonitored network devices. Pitch your topic with ease and precision using this Network Risks Management And Barriers Dashboard Ppt PowerPoint Presentation Gallery Graphic Tips PDF. This layout presents information on Problem Servers, Server Status, Problem Workstations, Workstation Status. It is also available for immediate download and adjustment. So, changes can be made in the color, design, graphics or any other component to create a unique layout.
IT Project Management Progress Tracking KPI Dashboard Template PDF
This slide provides IT project development dashboard which helps managers performance status. It provides information regarding team velocity, work in story points, product estimation status, closed story point vs epic story point and pending story points. Showcasing this set of slides titled IT Project Management Progress Tracking KPI Dashboard Template PDF. The topics addressed in these templates are Team Velocity, Product Estimation Status, Pending Story Points. All the content presented in this PPT design is completely editable. Download it and make adjustments in color, background, font etc. as per your unique business setting.

KPI Dashboard Showcasing Product Management Revenue Analysis Portrait PDF
This slide provides dashboard showcasing product development project overview with completion status. It provides information regarding cash flow statements, completion progress, project overview and product approval status. Pitch your topic with ease and precision using this KPI Dashboard Showcasing Product Management Revenue Analysis Portrait PDF. This layout presents information on Completion Progress, Product Approval Status, Cash Flow Statements. It is also available for immediate download and adjustment. So, changes can be made in the color, design, graphics or any other component to create a unique layout.

Storage Facility Logistics And Productivity Management Dashboard Summary PDF
This slide showcases a dashboard for monitoring and tracking warehouse operations productivity. It includes key components such as time period, revenue, costs, profit, shipments, average daily time, fleet status, profit by country, average delivery time, etc. Showcasing this set of slides titled Storage Facility Logistics And Productivity Management Dashboard Summary PDF. The topics addressed in these templates are Fleet Status, Delivery Status, Deliveries By Country. All the content presented in this PPT design is completely editable. Download it and make adjustments in color, background, font etc. as per your unique business setting.
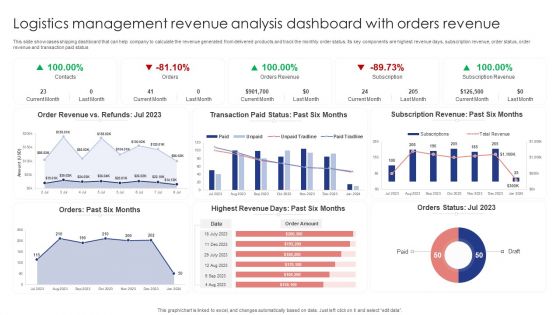
Logistics Management Revenue Analysis Dashboard With Orders Revenue Brochure PDF
This slide showcases shipping dashboard that can help company to calculate the revenue generated from delivered products and track the monthly order status. Its key components are highest revenue days, subscription revenue, order status, order revenue and transaction paid status. Showcasing this set of slides titled Logistics Management Revenue Analysis Dashboard With Orders Revenue Brochure PDF. The topics addressed in these templates are Order Revenue, Transaction Paid, Subscription Revenue. All the content presented in this PPT design is completely editable. Download it and make adjustments in color, background, font etc. as per your unique business setting.
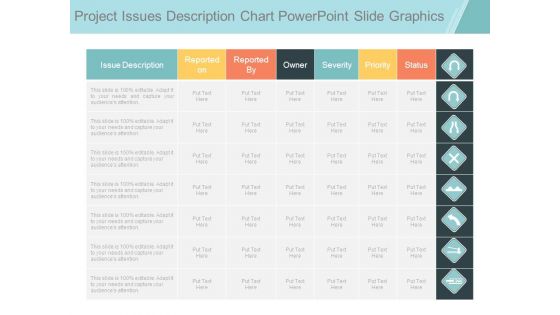
Project Issues Description Chart Powerpoint Slide Graphics
This is a project issues description chart powerpoint slide graphics. This is a seven stage process. The stages in this process are issue description, reported on, reported by, owner, severity, priority, status.
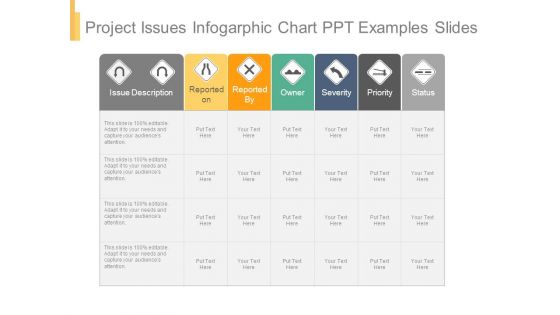
Project Issues Infogarphic Chart Ppt Examples Slides
This is a project issues infogarphic chart ppt examples slides. This is a seven stage process. The stages in this process are issue description, reported on, reported by, owner, severity, priority, status.
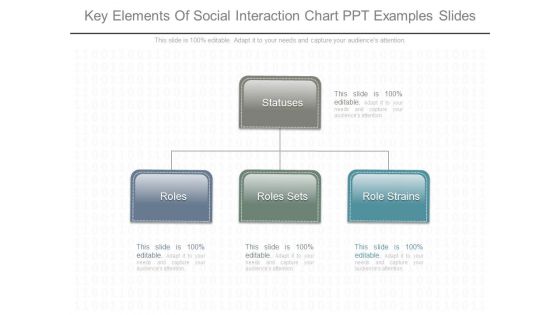
Key Elements Of Social Interaction Chart Ppt Examples Slides
This is a key elements of social interaction chart ppt examples slides. This is a three stage process. The stages in this process are statuses, roles, roles sets, role strains.

Structure Chart For Managing Business Operations Ppt Slide
This is a structure chart for managing business operations ppt slide. This is a six stage process. The stages in this process are priority actions, what system support resources, who responsible, when done, how to measure, annual status.

Inbound Logistics And Supply Chain Introduction Inbound Logistics Dashboard Diagrams PDF
This slide provides the glimpse about the inbound logistics along with fleet, delivery status, destination, loading time, etc.Deliver and pitch your topic in the best possible manner with this Inbound Logistics And Supply Chain Introduction Inbound Logistics Dashboard Diagrams PDF Use them to share invaluable insights on Delivery Status, Deliveries By Destination, Lading Time And Weight and impress your audience. This template can be altered and modified as per your expectations. So, grab it now.
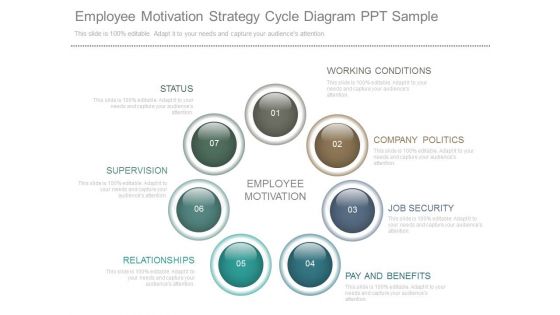
Employee Motivation Strategy Cycle Diagram Ppt Sample
This is a employee motivation strategy cycle diagram ppt sample. This is a four stage process. The stages in this process are working conditions, company politics, job security, pay and benefits, relationships, supervision, status.
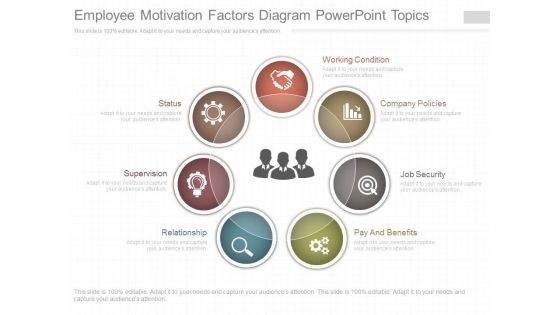
Employee Motivation Factors Diagram Powerpoint Topics
This is a employee motivation factors diagram powerpoint topics. This is a seven stage process. The stages in this process are status, supervision, relationship, working condition, company policies, job security, pay and benefits.

Employee Motivation Mind Map Diagram Ppt Slides
This is a employee motivation mind map diagram ppt slides. This is a seven stage process. The stages in this process are company policies, job security, relationships, pay benefits, supervision, status, working conditions, employee motivation.
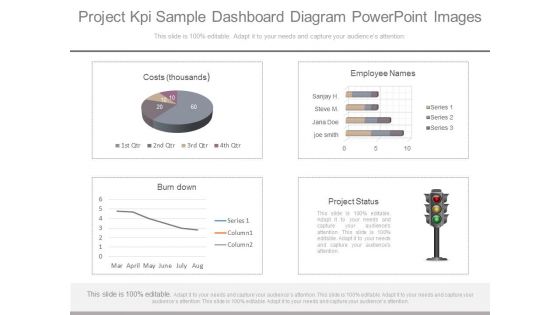
Project Kpi Sample Dashboard Diagram Powerpoint Images
This is a project kpi sample dashboard diagram powerpoint images. This is a four stage process. The stages in this process are costs thousands, employee names, burndown, project status.
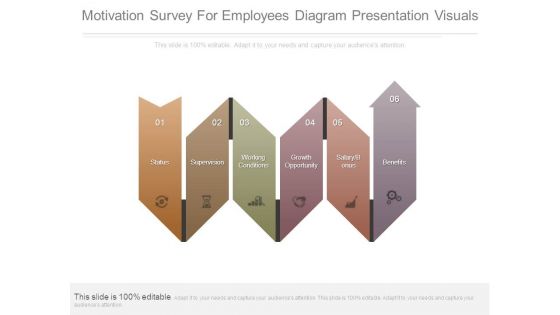
Motivation Survey For Employees Diagram Presentation Visuals
This is a motivation survey for employees diagram presentation visuals. This is a six stage process. The stages in this process are status, supervision, working conditions, growth opportunity, salary bonus, benefits.

Building Project Team Structure Diagram Powerpoint Slides Show
This is a building project team structure diagram powerpoint slides show. This is a six stage process. The stages in this process are cost tracking, primavera software, planning and scheduling, resource availability, budgeting, project status.
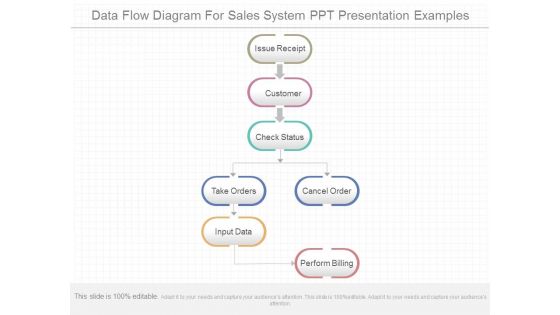
Data Flow Diagram For Sales System Ppt Presentation Examples
This is a data flow diagram for sales system ppt presentation examples. This is a seven stage process. The stages in this process are issue receipt, customer, check status, take orders, cancel order, input data, perform billing.
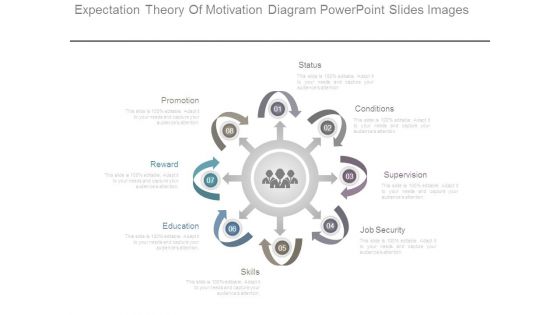
Expectation Theory Of Motivation Diagram Powerpoint Slides Images
This is a expectation theory of motivation diagram powerpoint slides images. This is a eight stage process. The stages in this process are status, conditions, supervision, job security, skills, education, reward, promotion.
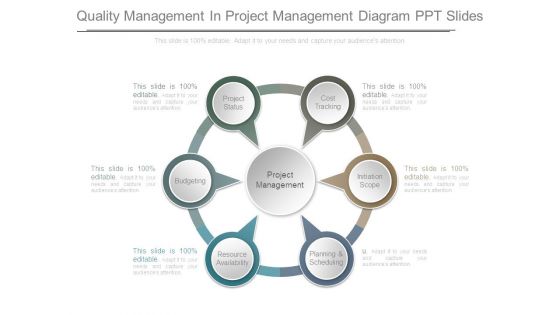
Quality Management In Project Management Diagram Ppt Slides
This is a quality management in project management diagram ppt slides. This is a six stage process. The stages in this process are project management, budgeting, project status, cost tracking, initiation scope, planning and scheduling, resource availability.

Manage Change Control Process Powerpoint Templates
This is a manage change control process powerpoint templates. This is a four stage process. The stages in this process are project phase review, secure needed resources, manage change control process, report project status.
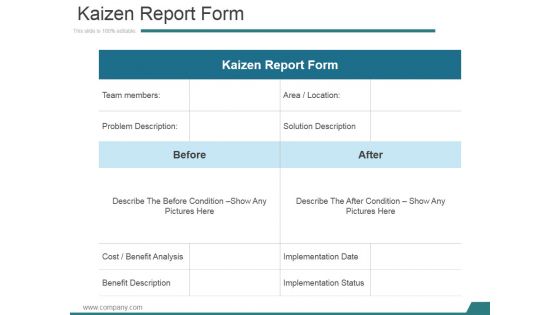
Kaizen Report Form Ppt PowerPoint Presentation Summary
This is a kaizen report form ppt powerpoint presentation summary. This is a two stage process. The stages in this process are team members, problem description, area, solution description, benefit description, implementation status.

Project Management Dashboard Ppt PowerPoint Presentation Portfolio Portrait
This is a project management dashboard ppt powerpoint presentation portfolio portrait. This is a five stage process. The stages in this process are overall task status, assigned to, budget, pending items, business.
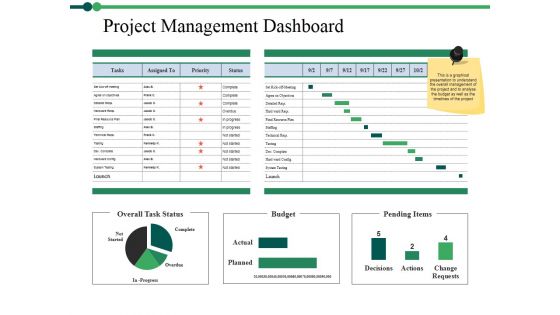
Project Management Dashboard Ppt PowerPoint Presentation Portfolio Objects
This is a project management dashboard ppt powerpoint presentation portfolio objects. This is a three stage process. The stages in this process are complete, overdue, overall task status, budget, pending items.

Facebook Audience Insights Ppt PowerPoint Presentation Outline Infographic Template
This is a facebook audience insights ppt powerpoint presentation outline infographic template. This is a two stage process. The stages in this process are facebook, relationship status, education level, future, past.
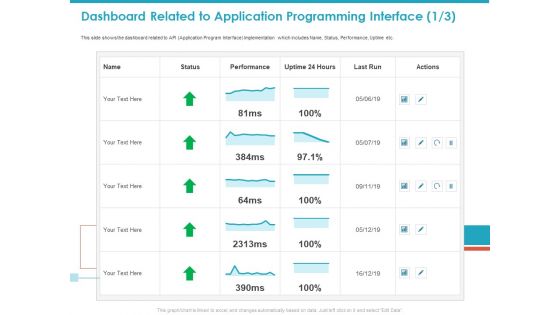
Dashboard Related To Application Programming Interface Ppt Model Example PDF
This slide shows the dashboard related to API Application Program Interface Implementation which includes Name, Status, Performance, Uptime etc. Deliver an awe-inspiring pitch with this creative dashboard related to application programming interface ppt model example pdf bundle. Topics like status, performance, actions, last run can be discussed with this completely editable template. It is available for immediate download depending on the needs and requirements of the user.

Dashboard Related To Construction Management Guidelines PDF
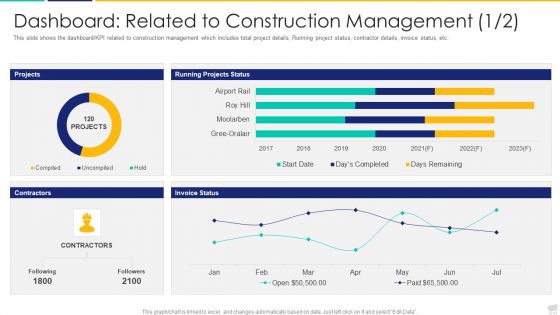
This slide shows the dashboard KPI related to construction management which includes total project details, Running project status, contractor details, invoice status, etc. Deliver and pitch your topic in the best possible manner with this dashboard related to construction management guidelines pdf. Use them to share invaluable insights on dashboard related to construction management and impress your audience. This template can be altered and modified as per your expectations. So, grab it now.
Dashboard Related To Construction Management Demonstration PDF
This slide shows the dashboard or KPI related to construction management which includes total project details, Running project status, contractor details, invoice status, etc.Deliver and pitch your topic in the best possible manner with this dashboard related to construction management demonstration pdf. Use them to share invaluable insights on dashboard related to construction management and impress your audience. This template can be altered and modified as per your expectations. So, grab it now.
Key Components Critical To Devops Viability IT Devops Activities Management Dashboard Deploy Brochure PDF
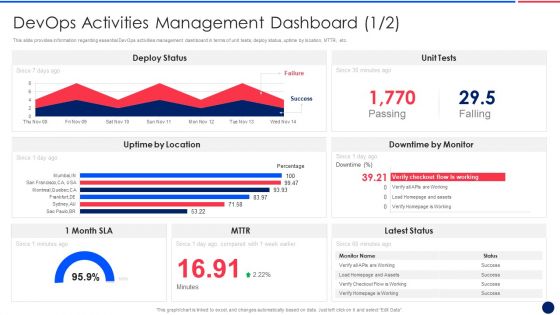
This slide provides information regarding essential DevOps activities management dashboard in terms of unit tests, deploy status, uptime by location, MTTR, etc. Deliver and pitch your topic in the best possible manner with this key components critical to devops viability it devops activities management dashboard deploy brochure pdf. Use them to share invaluable insights on unit tests, deploy status, uptime by location, mttr and impress your audience. This template can be altered and modified as per your expectations. So, grab it now.

SIEM Security Information And Event Management Dashboard Average Structure PDF
This slide covers the SIEM dashboard which focuses on server status, log sources, total logs, last log, collectors, log sources etc. Deliver an awe inspiring pitch with this creative siem security information and event management dashboard average structure pdf bundle. Topics like log sources, server status, collectors, syslogs, last logs can be discussed with this completely editable template. It is available for immediate download depending on the needs and requirements of the user.b

Scientific Computing IT Dashboard For Computational Science Program Ideas PDF
This slide represents the dashboard for the computational science program, including details of fee status, students status, faculty, total expenses, fee invoice, and students attendance.Deliver an awe inspiring pitch with this creative scientific computing it dashboard for computational science program ideas pdf bundle. Topics like dashboard for computational science program can be discussed with this completely editable template. It is available for immediate download depending on the needs and requirements of the user.

Function Of Quality Assurance In Devops IT Determine Software Testing Initiatives In Devops Dashboard Demonstration PDF
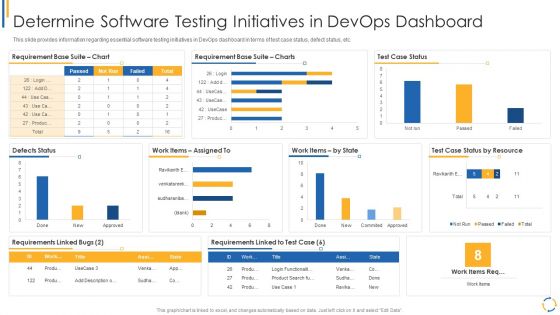
This slide provides information regarding essential software testing initiatives in DevOps dashboard in terms of test case status, defect status, etc.Deliver and pitch your topic in the best possible manner with this function of quality assurance in devops it determine software testing initiatives in devops dashboard demonstration pdf Use them to share invaluable insights on determine software testing initiatives in devops dashboard and impress your audience. This template can be altered and modified as per your expectations. So, grab it now.
Cyber Exploitation IT Dashboard For Threat Tracking Topics PDF
This slide depicts the dashboard for threat tracking through cyber security measures and ethical hackers by covering monthly threat status, current risk status, threat-based on the role, threats by owners, risk by threats, and threat report. Deliver an awe inspiring pitch with this creative cyber exploitation it dashboard for threat tracking topics pdf bundle. Topics like dashboard for threat tracking can be discussed with this completely editable template. It is available for immediate download depending on the needs and requirements of the user.
Development And Operations Model Reevaluating Quality Control Role IT Determine Software Testing Pictures PDF
This slide provides information regarding essential software testing initiatives in DevOps dashboard in terms of test case status, defect status, etc. Deliver an awe inspiring pitch with this creative development and operations model reevaluating quality control role it determine software testing pictures pdf bundle. Topics like determine software testing initiatives in devops dashboard can be discussed with this completely editable template. It is available for immediate download depending on the needs and requirements of the user.

Debt Collection Improvement Plan Debt Management Dashboard Download PDF
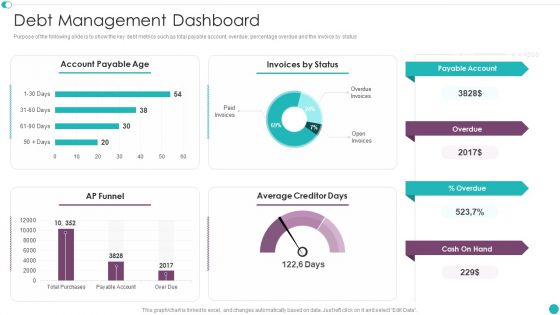
Purpose of the following slide is to show the key debt metrics such as total payable account, overdue, percentage overdue and the invoice by status. Deliver an awe inspiring pitch with this creative debt collection improvement plan debt management dashboard download pdf bundle. Topics like payable account, overdue, cash on hand, invoices by status, account payable age, ap funnel can be discussed with this completely editable template. It is available for immediate download depending on the needs and requirements of the user.
Credit Management And Recovery Policies Debt Management Dashboard Sample PDF
Purpose of the following slide is to show the key debt metrics such as total payable account, overdue, percentage overdue and the invoice by status. Deliver and pitch your topic in the best possible manner with this Credit Management And Recovery Policies Debt Management Dashboard Sample PDF. Use them to share invaluable insights on Account Payable, Invoices Status, Payable Account and impress your audience. This template can be altered and modified as per your expectations. So, grab it now.
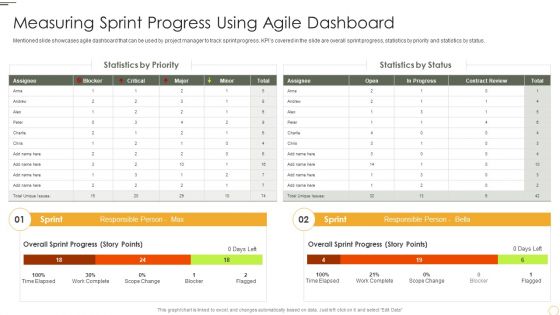
Measuring Sprint Progress Using Agile Dashboard Graphics PDF
Mentioned slide showcases agile dashboard that can be used by project manager to track sprint progress. KPIs covered in the slide are overall sprint progress, statistics by priority and statistics by status.Deliver an awe inspiring pitch with this creative Measuring Sprint Progress Using Agile Dashboard Graphics PDF bundle. Topics like Statistics By Priority, Statistics Status, Responsible Person can be discussed with this completely editable template. It is available for immediate download depending on the needs and requirements of the user.
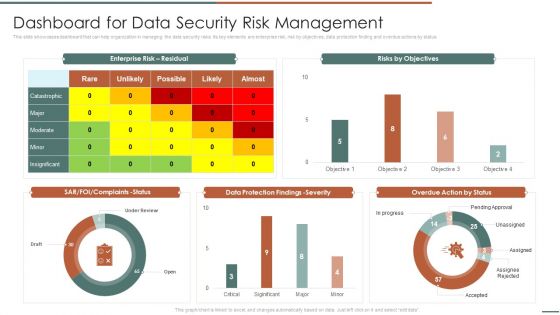
Information Security Risk Evaluation Dashboard For Data Security Risk Management Template PDF
This slide showcases dashboard that can help organization in managing the data security risks. Its key elements are enterprise risk, risk by objectives, data protection finding and overdue actions by status.Deliver an awe inspiring pitch with this creative Information Security Risk Evaluation Dashboard For Data Security Risk Management Template PDF bundle. Topics like Complaints Status, Protection Findings, Overdue Action can be discussed with this completely editable template. It is available for immediate download depending on the needs and requirements of the user.

Dashboard To Measure Total Risks Encountered And Resolved Download PDF
Mentioned slide portrays dashboard for measuring total risk encountered by the firm in specific period and total risks resolved. Key metrics included in the slide are issues by status, issues by priority and resolved status.Deliver an awe inspiring pitch with this creative Dashboard To Measure Total Risks Encountered And Resolved Download PDF bundle. Topics like Pending Approval, Action Implemented, Resolved can be discussed with this completely editable template. It is available for immediate download depending on the needs and requirements of the user.

Staff Statistics Dashboard For Hr Manager Rules PDF
This slide represents the employee statistics dashboard. It includes KPIs such as hiring funnel, employees by department, employees by status, etc. Pitch your topic with ease and precision using this Staff Statistics Dashboard For Hr Manager Rules PDF. This layout presents information on Hiring Funnel, Employees By Status, Employees By Department. It is also available for immediate download and adjustment. So, changes can be made in the color, design, graphics or any other component to create a unique layout.
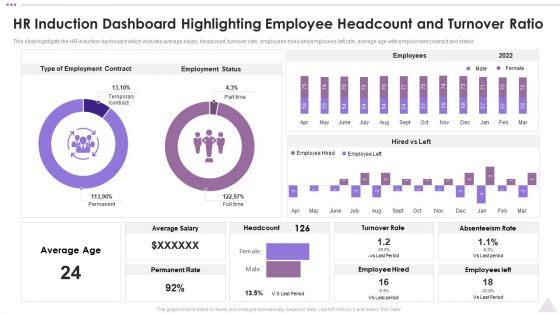
New Staff Orientation Session HR Induction Dashboard Highlighting Employee Headcount Background PDF
This slide highlights the HR induction dashboard which includes average salary, headcount, turnover rate, employees hired and employees left rate, average age with employment contract and status. Deliver an awe inspiring pitch with this creative New Staff Orientation Session HR Induction Dashboard Highlighting Employee Headcount Background PDF bundle. Topics like Employment Status, Employees, Average Salary can be discussed with this completely editable template. It is available for immediate download depending on the needs and requirements of the user.

Computational Science Methodology Dashboard For Computational Science Program Structure PDF
This slide represents the dashboard for the computational science program, including details of fee status, students status, faculty, total expenses, fee invoice, and students attendance. Deliver an awe inspiring pitch with this creative Computational Science Methodology Dashboard For Computational Science Program Structure PDF bundle. Topics like Dashboard, Computational Science Program can be discussed with this completely editable template. It is available for immediate download depending on the needs and requirements of the user.
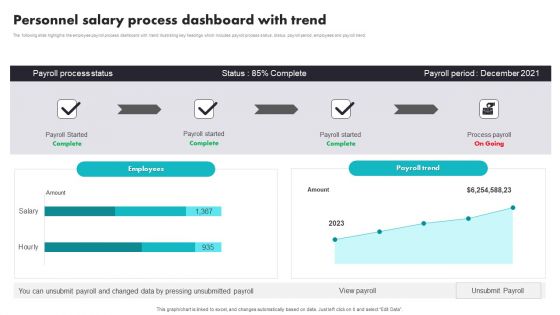
Personnel Salary Process Dashboard With Trend Brochure PDF
The following slide highlights the employee payroll process dashboard with trend illustrating key headings which includes payroll process status, status, payroll period, employees and payroll trend. Pitch your topic with ease and precision using this Personnel Salary Process Dashboard With Trend Brochure PDF. This layout presents information on Personnel Salary Process, Dashboard With Trend. It is also available for immediate download and adjustment. So, changes can be made in the color, design, graphics or any other component to create a unique layout.

Communication Dissemination And Project Management Dashboard Inspiration PDF
This slide illustrates facts and figures related to project management and communication. It includes weekly clients meetings, project status, overdue tasks etc.Pitch your topic with ease and precision using this Communication Dissemination And Project Management Dashboard Inspiration PDF. This layout presents information on Progress Plan, Overdue Tasks, Project Status. It is also available for immediate download and adjustment. So, changes can be made in the color, design, graphics or any other component to create a unique layout.
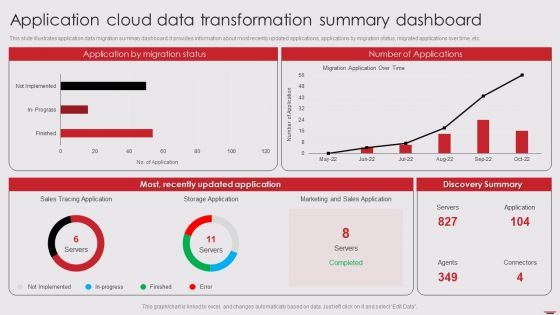
Application Cloud Data Transformation Summary Dashboard Mockup PDF
This slide illustrates application data migration summary dashboard. It provides information about most recently updated applications, applications by migration status, migrated applications over time, etc. Showcasing this set of slides titled Application Cloud Data Transformation Summary Dashboard Mockup PDF. The topics addressed in these templates are Application Migration Status, Number Applications, Most Recently Updated. All the content presented in this PPT design is completely editable. Download it and make adjustments in color, background, font etc. as per your unique business setting.
Cyber Protection And Precaution Tracking Dashboard Designs PDF
This slide shows the dashboard of cyber safety and security of an organization. It includes risk level, compliance status, tracking and security budget. Showcasing this set of slides titled Cyber Protection And Precaution Tracking Dashboard Designs PDF. The topics addressed in these templates are Risk, Compliance Status, Risk Level. All the content presented in this PPT design is completely editable. Download it and make adjustments in color, background, font etc. as per your unique business setting.
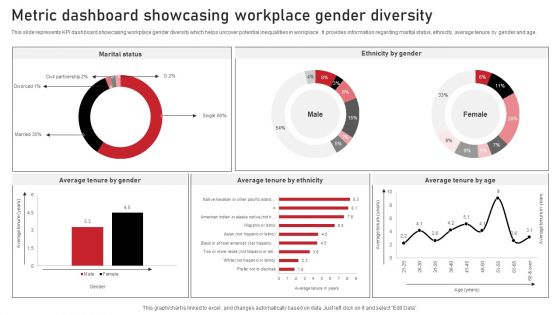
Metric Dashboard Showcasing Workplace Gender Diversity Microsoft PDF
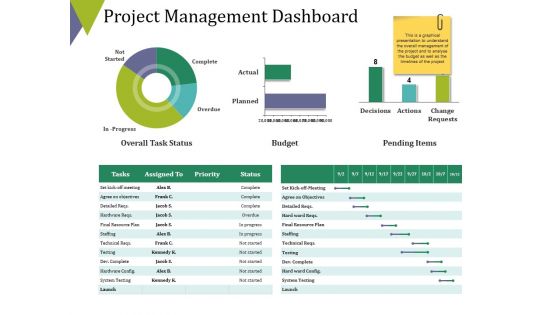
Project Management Dashboard Ppt PowerPoint Presentation Outline Summary
This is a project management dashboard ppt powerpoint presentation outline summary. This is a three stage process. The stages in this process are overall task status, budget, pending items, complete, overdue.
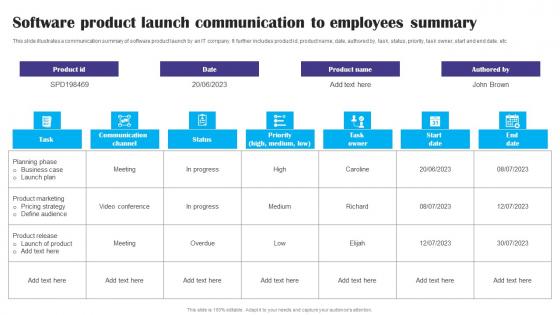
Software Product Launch Communication To Employees Summary Ppt Professional Vector pdf
This slide illustrates a communication summary of software product launch by an IT company. It further includes product id, product name, date, authored by, task, status, priority, task owner, start and end date, etc. Pitch your topic with ease and precision using this Software Product Launch Communication To Employees Summary Ppt Professional Vector pdf. This layout presents information on Authored By, Task, Status, Priority, Task Owner. It is also available for immediate download and adjustment. So, changes can be made in the color, design, graphics or any other component to create a unique layout.
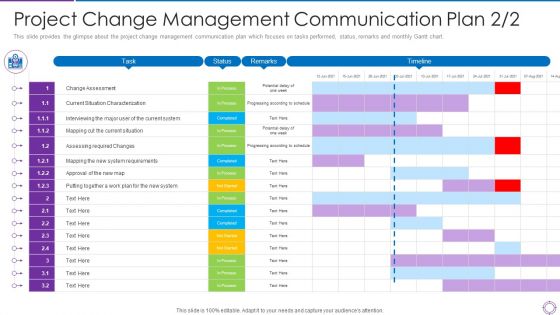
Project Administration Planning Project Change Management Communication Plan Map Ppt PowerPoint Presentation Gallery Microsoft PDF
This slide provides the glimpse about the project change management communication plan which focuses on tasks performed, status, remarks and monthly Gantt chart. Deliver and pitch your topic in the best possible manner with this project administration planning project change management communication plan map ppt powerpoint presentation gallery microsoft pdf. Use them to share invaluable insights on tasks performed, status, remarks, monthly gantt chart and impress your audience. This template can be altered and modified as per your expectations. So, grab it now.

Network Monitoring Tool Overview Nagios Architecture Ppt PowerPoint Presentation Outline Vector PDF
Presenting this set of slides with name network monitoring tool overview nagios architecture ppt powerpoint presentation outline vector pdf. This is a four stage process. The stages in this process are objects, nagios, status, performance data, nagios daemon, rrd database, application server, database server. This is a completely editable PowerPoint presentation and is available for immediate download. Download now and impress your audience.
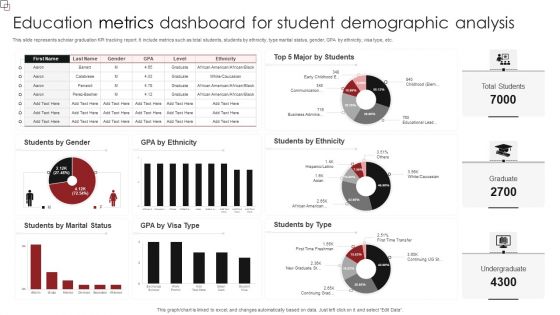
Education Metrics Dashboard For Student Demographic Analysis Diagrams PDF
This slide represents scholar graduation KPI tracking report. It include metrics such as total students, students by ethnicity, type marital status, gender, GPA by ethnicity, visa type, etc. Showcasing this set of slides titled Education Metrics Dashboard For Student Demographic Analysis Diagrams PDF. The topics addressed in these templates are Students Ethnicity, Students Type, Students Marital Status. All the content presented in this PPT design is completely editable. Download it and make adjustments in color, background, font etc. as per your unique business setting.
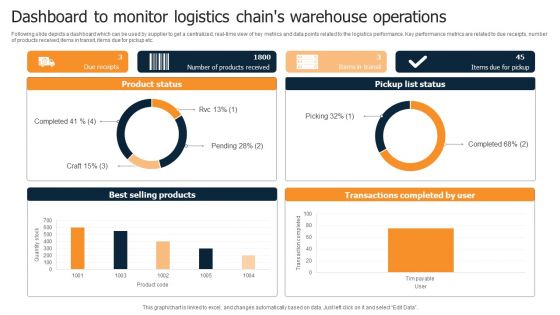
Dashboard To Monitor Logistics Chains Warehouse Operations Diagrams PDF
Following slide depicts a dashboard which can be used by supplier to get a centralized, real-time view of key metrics and data points related to the logistics performance. Key performance metrics are related to due receipts, number of products received,items in transit, items due for pickup etc. Pitch your topic with ease and precision using this Dashboard To Monitor Logistics Chains Warehouse Operations Diagrams PDF. This layout presents information on Product Status, Pickup List Status, Best Selling Products. It is also available for immediate download and adjustment. So, changes can be made in the color, design, graphics or any other component to create a unique layout.

Project Budget Planning Audit Flow Chart Mockup PDF
This slide covers flow chart which will be helpful for doing regular financial audits. It includes a process steps such as project creation, assign task, conduct meeting and monitoring project status. Persuade your audience using this project budget planning audit flow chart mockup pdf. This PPT design covers one stages, thus making it a great tool to use. It also caters to a variety of topics including project, monitor project status, data warehouse, sign off process, assign task. Download this PPT design now to present a convincing pitch that not only emphasizes the topic but also showcases your presentation skills.
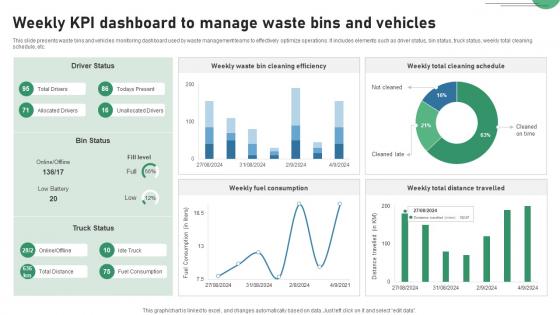
Weekly KPI Dashboard To Manage Waste Bins And Vehicles IOT Applications In Smart Waste IoT SS V
This slide presents waste bins and vehicles monitoring dashboard used by waste management teams to effectively optimize operations. It includes elements such as driver status, bin status, truck status, weekly total cleaning schedule, etc. Find highly impressive Weekly KPI Dashboard To Manage Waste Bins And Vehicles IOT Applications In Smart Waste IoT SS V on Slidegeeks to deliver a meaningful presentation. You can save an ample amount of time using these presentation templates. No need to worry to prepare everything from scratch because Slidegeeks experts have already done a huge research and work for you. You need to download Weekly KPI Dashboard To Manage Waste Bins And Vehicles IOT Applications In Smart Waste IoT SS V for your upcoming presentation. All the presentation templates are 100 percent editable and you can change the color and personalize the content accordingly. Download now.
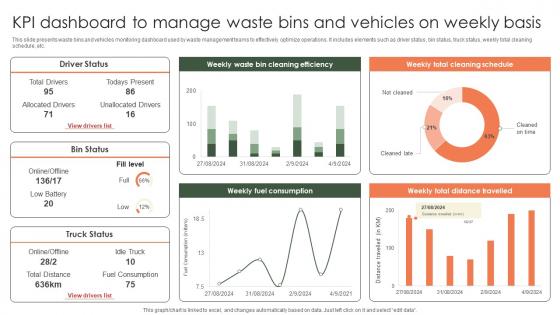
Kpi Dashboard To Manage Waste Bins And Vehicles On Weekly Implementation Of E Waste Guidelines
This slide presents waste bins and vehicles monitoring dashboard used by waste management teams to effectively optimize operations. It includes elements such as driver status, bin status, truck status, weekly total cleaning schedule, etc. Welcome to our selection of the Kpi Dashboard To Manage Waste Bins And Vehicles On Weekly Implementation Of E Waste Guidelines. These are designed to help you showcase your creativity and bring your sphere to life. Planning and Innovation are essential for any business that is just starting out. This collection contains the designs that you need for your everyday presentations. All of our PowerPoints are 100 percent editable, so you can customize them to suit your needs. This multi-purpose template can be used in various situations. Grab these presentation templates today.

 Home
Home