Star Rating

Retail Analytics Dashboard To Measure Merchandise Planning Effectiveness Microsoft PDF
This slide shows the retail analytics dashboard to measure merchandise planning effectiveness which includes conversion rate, sell through rate, return on investment, website traffic, abandonment rate, etc. Make sure to capture your audiences attention in your business displays with our gratis customizable Retail Analytics Dashboard To Measure Merchandise Planning Effectiveness Microsoft PDF. These are great for business strategies, office conferences, capital raising or task suggestions. If you desire to acquire more customers for your tech business and ensure they stay satisfied, create your own sales presentation with these plain slides.

E Commerce Business Sales Monthly Forecast Graph Ppt Infographics Show PDF
This slide shows the table and graph representing monthly sales forecast of an e-commerce business. It shows details related to the expected growth rate, historical data, projected data and actual growth of sales. Pitch your topic with ease and precision using this E Commerce Business Sales Monthly Forecast Graph Ppt Infographics Show PDF. This layout presents information on Expected Growth Rate, Historical, Actual Growth Rate. It is also available for immediate download and adjustment. So, changes can be made in the color, design, graphics or any other component to create a unique layout.

Dashboard For Big Healthcare Data Analytics Graphics PDF
This slide showcase the dashboard for big data analytics in healthcare. It includes elements such as bed occupancy rate, patient turnover rate, efficiency and costs, missed and cancelled appointment rate. Showcasing this set of slides titled Dashboard For Big Healthcare Data Analytics Graphics PDF. The topics addressed in these templates are Satisfaction Service Indicators, Occupancy, Forecasted Patient Turnover. All the content presented in this PPT design is completely editable. Download it and make adjustments in color, background, font etc. as per your unique business setting.

Marketing Dashboard To Track Marketing Progress Ppt Tips PDF
This slide represents dashboard to track marketing campaign progress. It includes advertisement costs , total clicks, click-through rate, conversion rate, cost per thousand impression etc. Pitch your topic with ease and precision using this Marketing Dashboard To Track Marketing Progress Ppt Tips PDF. This layout presents information on Total Clicks, Total Impression, Total Conversion Rate, Cost Per Click. It is also available for immediate download and adjustment. So, changes can be made in the color, design, graphics or any other component to create a unique layout.
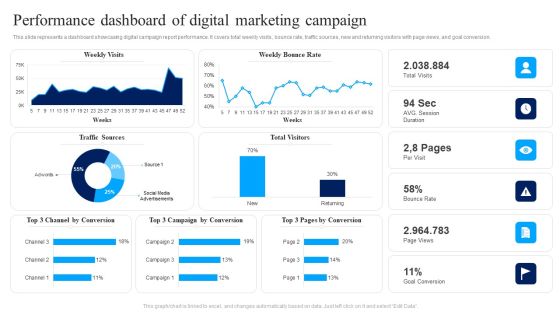
Performance Dashboard Of Digital Marketing Campaign Ppt Show Slide PDF
This slide represents a dashboard showcasing digital campaign report performance. It covers total weekly visits, bounce rate, traffic sources, new and returning visitors with page views, and goal conversion. Pitch your topic with ease and precision using this Performance Dashboard Of Digital Marketing Campaign Ppt Show Slide PDF. This layout presents information on Weekly Visits, Weekly Bounce Rate, Bounce Rate. It is also available for immediate download and adjustment. So, changes can be made in the color, design, graphics or any other component to create a unique layout.
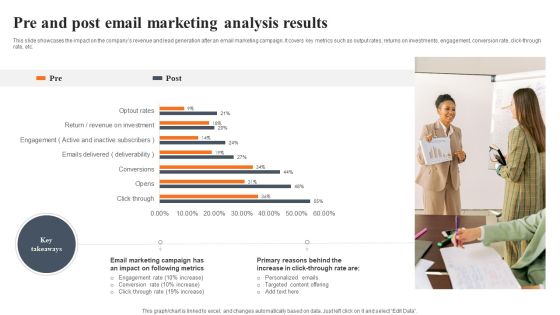
Pre And Post Email Marketing Analysis Results Slides PDF
This slide showcases the impact on the companys revenue and lead generation after an email marketing campaign. It covers key metrics such as output rates, returns on investments, engagement, conversion rate, click through rate, etc. Pitch your topic with ease and precision using this Pre And Post Email Marketing Analysis Results Slides PDF. This layout presents information on Email Marketing Campaign, Following Metrics, Targeted Content Offering. It is also available for immediate download and adjustment. So, changes can be made in the color, design, graphics or any other component to create a unique layout.
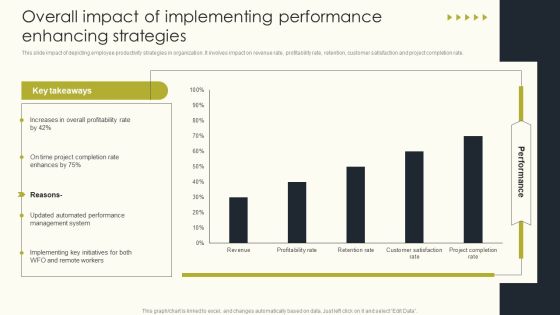
Overall Impact Of Implementing Performance Enhancing Strategies Employee Performance Formats PDF
This slide impact of depicting employee productivity strategies in organization. It involves impact on revenue rate, profitability rate, retention, customer satisfaction and project completion rate. Boost your pitch with our creative Overall Impact Of Implementing Performance Enhancing Strategies Employee Performance Formats PDF. Deliver an awe-inspiring pitch that will mesmerize everyone. Using these presentation templates you will surely catch everyones attention. You can browse the ppts collection on our website. We have researchers who are experts at creating the right content for the templates. So you do not have to invest time in any additional work. Just grab the template now and use them.

Email Marketing Campaign Outcomes Results And Campaign Performance Dashboard Slides PDF
This slide covers the dashboard for analyzing the results of email campaign. It includes information related to the emails sent, delivery rate, click rate, etc. Showcasing this set of slides titled Email Marketing Campaign Outcomes Results And Campaign Performance Dashboard Slides PDF. The topics addressed in these templates are Opens And Clicks Rates, Other Information, Bounces . All the content presented in this PPT design is completely editable. Download it and make adjustments in color, background, font etc. as per your unique business setting.
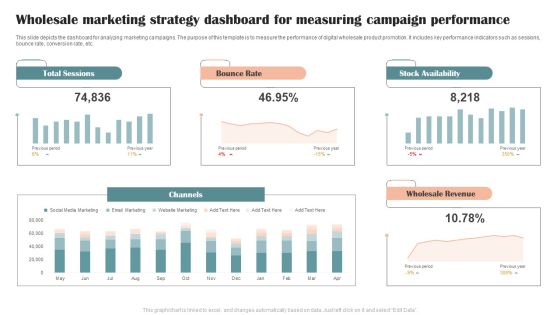
Wholesale Marketing Strategy Dashboard For Measuring Campaign Performance Graphics PDF
This slide depicts the dashboard for analyzing marketing campaigns. The purpose of this template is to measure the performance of digital wholesale product promotion. It includes key performance indicators such as sessions, bounce rate, conversion rate, etc. Showcasing this set of slides titled Wholesale Marketing Strategy Dashboard For Measuring Campaign Performance Graphics PDF. The topics addressed in these templates are Total Sessions, Bounce Rate, Stock Availability. All the content presented in this PPT design is completely editable. Download it and make adjustments in color, background, font etc. as per your unique business setting.

Improving Technology Based Analyzing Impact On HR Departments Performance Inspiration PDF
This slide showcases human resource department performance impacted after utilization of recruitment technology. It provides details about hiring rate, turnover rate, training costs, return on investment, vacancy rate, etc. Create an editable Improving Technology Based Analyzing Impact On HR Departments Performance Inspiration PDF that communicates your idea and engages your audience. Whether youre presenting a business or an educational presentation, pre-designed presentation templates help save time. Improving Technology Based Analyzing Impact On HR Departments Performance Inspiration PDF is highly customizable and very easy to edit, covering many different styles from creative to business presentations. Slidegeeks has creative team members who have crafted amazing templates. So, go and get them without any delay.
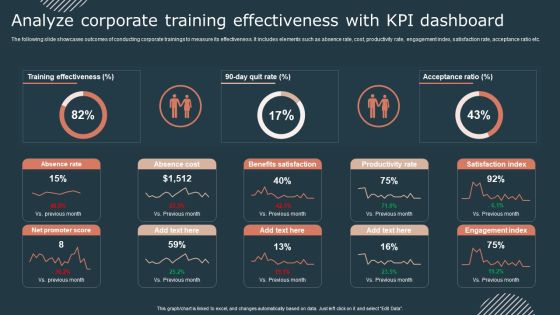
Effective Workforce Participation Action Planning Analyze Corporate Training Effectiveness Template PDF
The following slide showcases outcomes of conducting corporate trainings to measure its effectiveness. It includes elements such as absence rate, cost, productivity rate, engagement index, satisfaction rate, acceptance ratio etc. Boost your pitch with our creative Effective Workforce Participation Action Planning Analyze Corporate Training Effectiveness Template PDF. Deliver an awe inspiring pitch that will mesmerize everyone. Using these presentation templates you will surely catch everyones attention. You can browse the ppts collection on our website. We have researchers who are experts at creating the right content for the templates. So you do not have to invest time in any additional work. Just grab the template now and use them.

Actual Time Marketing Advantages For Companies And Agencies Ppt PowerPoint Presentation File Information PDF
The slide illustrates a company report highlighting the benefits from investing in a real-time marketing program for responding quickly to the trends. Various advantages included are increases customer experience, boosts customer retention rate, better conversion rates, etc. Pitch your topic with ease and precision using this Actual Time Marketing Advantages For Companies And Agencies Ppt PowerPoint Presentation File Information PDF. This layout presents information on Increases Customer Experience, Better Conversion Rates, Improved Brand Perception, Facilitates Personalization. It is also available for immediate download and adjustment. So, changes can be made in the color, design, graphics or any other component to create a unique layout.
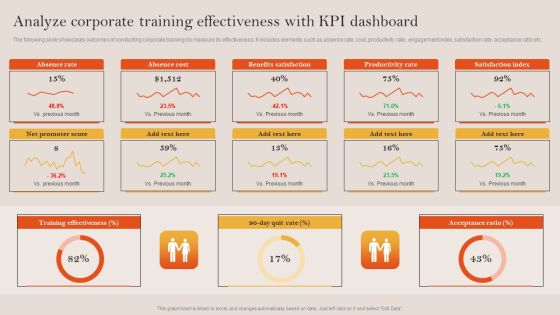
Tactical Employee Engagement Action Planning Analyze Corporate Training Effectiveness Kpi Dashboard Inspiration PDF
The following slide showcases outcomes of conducting corporate trainings to measure its effectiveness. It includes elements such as absence rate, cost, productivity rate, engagement index, satisfaction rate, acceptance ratio etc. Make sure to capture your audiences attention in your business displays with our gratis customizable Tactical Employee Engagement Action Planning Analyze Corporate Training Effectiveness Kpi Dashboard Inspiration PDF. These are great for business strategies, office conferences, capital raising or task suggestions. If you desire to acquire more customers for your tech business and ensure they stay satisfied, create your own sales presentation with these plain slides.
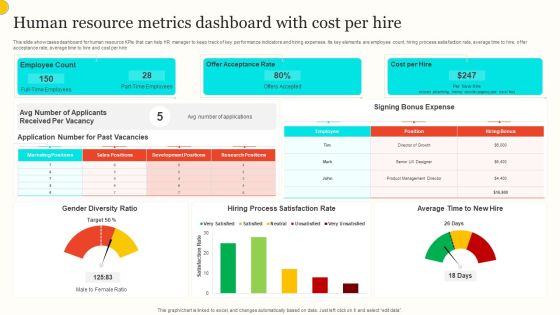
Human Resource Metrics Dashboard With Cost Per Hire Portrait PDF
This slide showcases dashboard for human resource KPIs that can help HR manager to keep track of key performance indicators and hiring expenses. Its key elements are employee count, hiring process satisfaction rate, average time to hire, offer acceptance rate, average time to hire and cost per hire. Showcasing this set of slides titled Human Resource Metrics Dashboard With Cost Per Hire Portrait PDF. The topics addressed in these templates are Employee Count, Offer Acceptance Rate, Cost Per Hire. All the content presented in this PPT design is completely editable. Download it and make adjustments in color, background, font etc. as per your unique business setting.

Big Data In Health Industry Dashboard In Industry Summary PDF
The slide depicts patient KPI dashboard for healthcare which can be used to improve service levels as well as treatment across departments. It include metrics such as bed occupancy rate, patient turnover, satisfaction rate, missed and cancelled appointment rate. Showcasing this set of slides titled Big Data In Health Industry Dashboard In Industry Summary PDF. The topics addressed in these templates are Geriatrics, Gynecology, Internal Medicine. All the content presented in this PPT design is completely editable. Download it and make adjustments in color, background, font etc. as per your unique business setting.
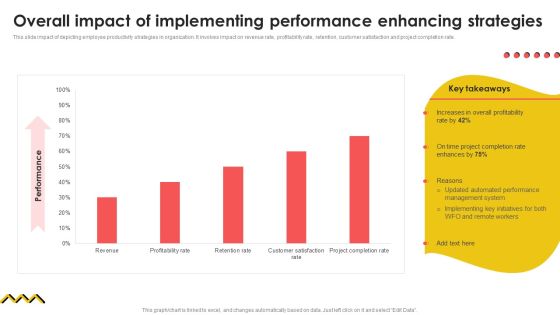
Overall Impact Of Implementing Performance Enhancing Strategies Summary PDF
This slide impact of depicting employee productivity strategies in organization. It involves impact on revenue rate, profitability rate, retention, customer satisfaction and project completion rate. Take your projects to the next level with our ultimate collection of Overall Impact Of Implementing Performance Enhancing Strategies Summary PDF. Slidegeeks has designed a range of layouts that are perfect for representing task or activity duration, keeping track of all your deadlines at a glance. Tailor these designs to your exact needs and give them a truly corporate look with your own brand colors they will make your projects stand out from the rest.

Manufacturing Enterprise Inventory Overview Dashboard Graphics PDF
The following slide depicts the key performance areas of inventory management in a manufacturing firm. It includes KPIs such as inventory turnover ratio, out of stock rate, on time in full rate, product wise average time to sell etc. Showcasing this set of slides titled Manufacturing Enterprise Inventory Overview Dashboard Graphics PDF. The topics addressed in these templates are Turnover Analysis, Dashboard, Stock Rate. All the content presented in this PPT design is completely editable. Download it and make adjustments in color, background, font etc. as per your unique business setting.
Optimizing Consumer Lead Nurturing Procedure Lead Generation Dashboard For Tracking Introduction PDF
This slide covers the KPI dashboard for tracking lead conversion rates. It includes metrics such as visitors, average session rate, per visit, bounce rate, page views, etc. Create an editable Optimizing Consumer Lead Nurturing Procedure Lead Generation Dashboard For Tracking Introduction PDF that communicates your idea and engages your audience. Whether youre presenting a business or an educational presentation, pre designed presentation templates help save time. Optimizing Consumer Lead Nurturing Procedure Lead Generation Dashboard For Tracking Introduction PDF is highly customizable and very easy to edit, covering many different styles from creative to business presentations. Slidegeeks has creative team members who have crafted amazing templates. So, go and get them without any delay.

Kpis To Optimize For Overcoming Decline Of Sales Mockup PDF
This slide consists of key performance indicators that can be implemented by managers for optimizing and overcoming lost sales. Major key performance indicators are stockout rate, order fulfilment rate, customer satisfaction rate, etc. Showcasing this set of slides titled Kpis To Optimize For Overcoming Decline Of Sales Mockup PDF. The topics addressed in these templates are Target, Actual, Deviation. All the content presented in this PPT design is completely editable. Download it and make adjustments in color, background, font etc. as per your unique business setting.
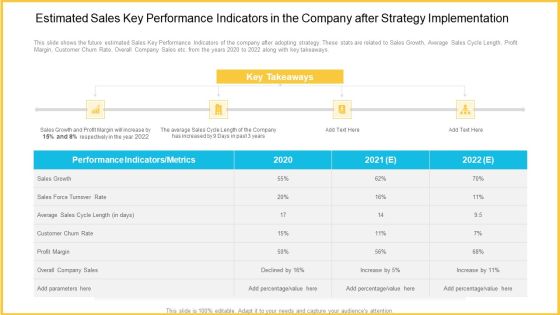
Estimated Sales Key Performance Indicators In The Company After Strategy Implementation Diagrams PDF
This slide shows the future estimated Sales Key Performance Indicators of the company after adopting strategy. These stats are related to Sales Growth, Average Sales Cycle Length, Profit Margin, Customer Churn Rate, Overall Company Sales etc. from the years 2020 to 2022 along with key takeaways. Deliver an awe-inspiring pitch with this creative estimated sales key performance indicators in the company after strategy implementation diagrams pdf. bundle. Topics like sales growth, sales force turnover rate, customer churn rate, profit margin, overall company sales can be discussed with this completely editable template. It is available for immediate download depending on the needs and requirements of the user.
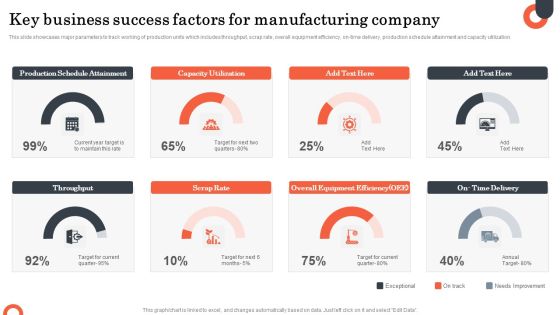
Key Business Success Factors For Manufacturing Company Diagrams PDF
This slide showcases major parameters to track working of production units which includes throughput, scrap rate, overall equipment efficiency, on-time delivery, production schedule attainment and capacity utilization. Showcasing this set of slides titled Key Business Success Factors For Manufacturing Company Diagrams PDF. The topics addressed in these templates are Production Schedule Attainment, Capacity Utilization, Scrap Rate. All the content presented in this PPT design is completely editable. Download it and make adjustments in color, background, font etc. as per your unique business setting.

Linkedin Marketing For New Ventures Campaign Performance Evaluation Dashboard Themes PDF
This slide depicts the dashboard for LinkedIn marketing campaign providing information regarding impressions, clicks, engagement rate, CTR monthly trend, budget etc.Deliver and pitch your topic in the best possible manner with this Linkedin Marketing For New Ventures Campaign Performance Evaluation Dashboard Themes PDF Use them to share invaluable insights on Impressions, Engagement Rate, Total Engagements and impress your audience. This template can be altered and modified as per your expectations. So, grab it now.

Combo Chart Ppt PowerPoint Presentation Summary Background Image
This is a combo chart ppt powerpoint presentation summary background image. This is a three stage process. The stages in this process are combo chart, product, growth rate, market size.

Combo Chart Ppt PowerPoint Presentation Summary Graphics Tutorials
This is a combo chart ppt powerpoint presentation summary graphics tutorials. This is a eight stage process. The stages in this process are product, growth rate, market size, business.

Combo Chart Ppt PowerPoint Presentation Infographic Template Influencers
This is a combo chart ppt powerpoint presentation infographic template influencers. This is a three stage process. The stages in this process are market size rmb million, growth rate.

Combo Chart Ppt PowerPoint Presentation Professional Slide Download
This is a combo chart ppt powerpoint presentation professional slide download. This is a three stage process. The stages in this process are market size, growth rate, product, graph, growth.

Combo Chart Ppt PowerPoint Presentation Ideas Infographic Template
This is a combo chart ppt powerpoint presentation ideas infographic template. This is a three stage process. The stages in this process are market size growth rate, graph, business, strategy.

Combo Chart Ppt PowerPoint Presentation Pictures Graphic Images
This is a combo chart ppt powerpoint presentation pictures graphic images. This is a three stage process. The stages in this process are bar graph, growth, market size, growth rate, success.

Combo Chart Ppt PowerPoint Presentation Styles Example Introduction
This is a combo chart ppt powerpoint presentation styles example introduction. This is a three stage process. The stages in this process are product, growth rate, market size, growth, success.

Combo Chart Ppt PowerPoint Presentation Infographic Template Graphic Images
This is a combo chart ppt powerpoint presentation infographic template graphic images. This is a three stage process. The stages in this process are market size, growth rate, percentage, business, marketing.
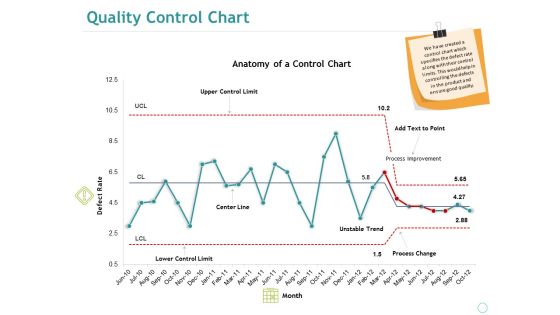
Quality Control Chart Ppt PowerPoint Presentation Summary Sample
This is a quality control chart ppt powerpoint presentation summary sample. This is a one stage process. The stages in this process are anatomy of a control chart, defect rate, upper control limit, center line, lower control limit.

Customer Satisfaction Data Insights Dashboard Ideas PDF
The following slide highlights the key metrics of the customer satisfaction survey conducted to measure and enhance the user experience. It includes satisfaction, recommendation rate, customers professional background and reviews. Showcasing this set of slides titled Customer Satisfaction Data Insights Dashboard Ideas PDF. The topics addressed in these templates are Recommendation Rate, Customer Satisfaction Rate, Customer Professional Background. All the content presented in this PPT design is completely editable. Download it and make adjustments in color, background, font etc. as per your unique business setting.
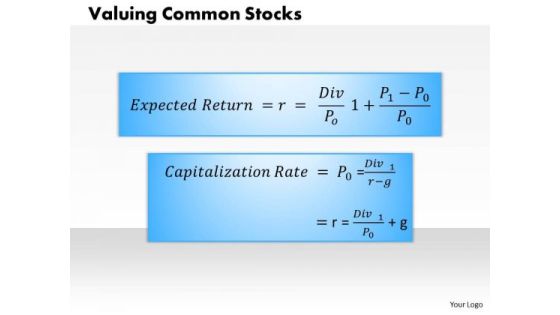
Business Framework Valuing Common Stocks PowerPoint Presentation
This diagram displays framework for valuing common stocks. This diagram has been designed to depict calculations of expected return and capitalization rate. Download this diagram to make professional presentations.
Effective Strategies For Retaining Healthcare Staff Impact Of Employee Retention Strategies Icons PDF
The purpose of this slide is to showcase the workforce retention strategic impact on business performance. The graph covers information about employee turnover rate, employee satisfaction rate, employee productivity rate, and customer experience rate. Slidegeeks is one of the best resources for PowerPoint templates. You can download easily and regulate Effective Strategies For Retaining Healthcare Staff Impact Of Employee Retention Strategies Icons PDF for your personal presentations from our wonderful collection. A few clicks is all it takes to discover and get the most relevant and appropriate templates. Use our Templates to add a unique zing and appeal to your presentation and meetings. All the slides are easy to edit and you can use them even for advertisement purposes.
Employee Turnover Ppt PowerPoint Presentation Gallery Icons
This is a employee turnover ppt powerpoint presentation gallery icons. This is a one stage process. The stages in this process are turnover, rate, number of employee separations during the year, total number of employees during the year.
HR Dashboard Indicating Weekly Professional Counselling Kpis Icons PDF
This slide illustrates HR career counselling dashboard. It provides information about hours of consultation, satisfaction rate, per consultant rate, popular counselors, etc. Showcasing this set of slides titled HR Dashboard Indicating Weekly Professional Counselling Kpis Icons PDF. The topics addressed in these templates are Specialization, Hours Of Consultation, Popular Counselors. All the content presented in this PPT design is completely editable. Download it and make adjustments in color, background, font etc. as per your unique business setting.

Business Framework Performance Optimization PowerPoint Presentation
Explain the concept of performance optimization with this exclusive template slide. This PPT diagram slide contains the graphic of two meters with maximum ratings. Use this PPT diagram slide and build exclusive presentation for your viewers.
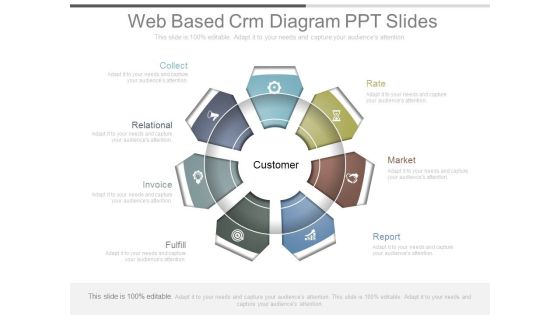
Web Based Crm Diagram Ppt Slides
This is a web based crm diagram ppt slides. This is a five stage process. The stages in this process are collect, relational, invoice, fulfill, rate, market, report, customer.

Bcg Go To Market Strategy Presentation Diagrams
This is a bcg go to market strategy presentation diagrams. This is a four stage process. The stages in this process are high, low, cash cows, dogs, relative market share, market growth rate.
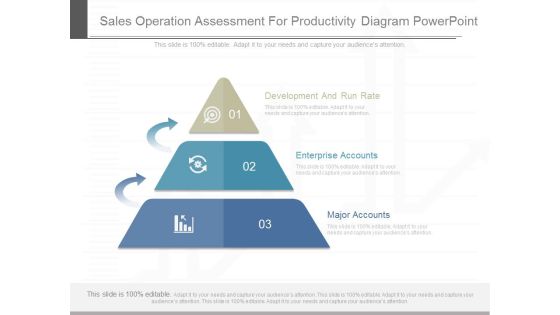
Sales Operation Assessment For Productivity Diagram Powerpoint
This is a sales operation assessment for productivity diagram powerpoint. This is a three stage process. The stages in this process are development and run rate, enterprise accounts, major accounts.
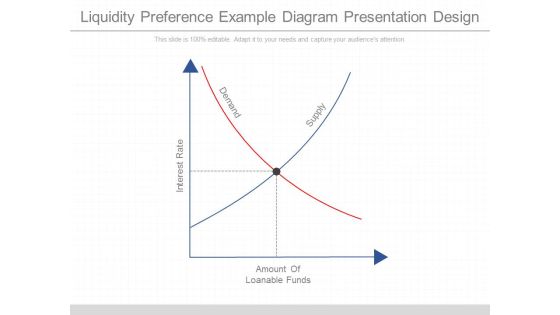
Liquidity Preference Example Diagram Presentation Design
This is a liquidity preference example diagram presentation design. This is a four stage process. The stages in this process are interest rate, amount of loanable funds, demand, supply.
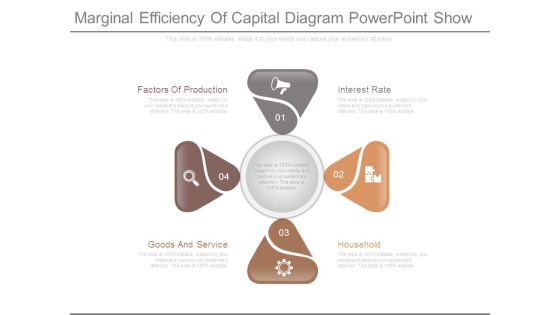
Marginal Efficiency Of Capital Diagram Powerpoint Show
This is a marginal efficiency of capital diagram powerpoint show. This is a four stage process. The stages in this process are factors of production, goods and service, interest rate, household.
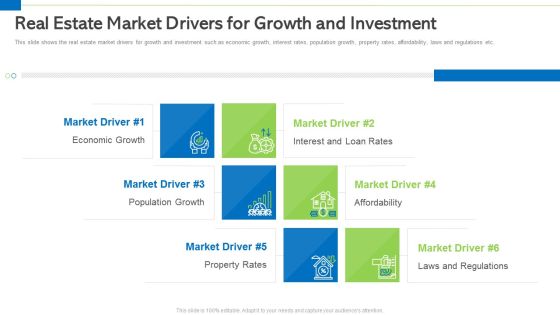
Real Estate Market Drivers For Growth And Investment Clipart PDF
Presenting real estate market drivers for growth and investment clipart pdf to provide visual cues and insights. Share and navigate important information on six stages that need your due attention. This template can be used to pitch topics like economic growth, population growth, property rates, interest and loan rates, affordability. In addtion, this PPT design contains high resolution images, graphics, etc, that are easily editable and available for immediate download.
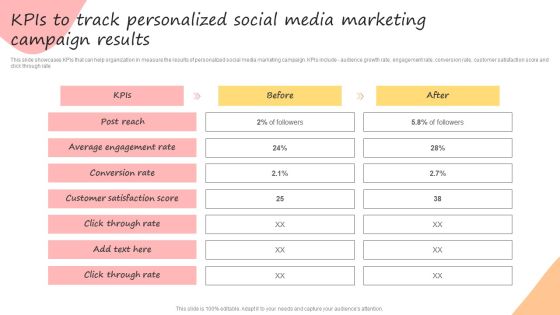
Developing Promotional Strategic Plan For Online Marketing Kpis To Track Personalized Social Media Diagrams PDF
This slide showcases KPIs that can help organization in measure the results of personalized social media marketing campaign. KPIs include - audience growth rate, engagement rate, conversion rate, customer satisfaction score and click through rate. Retrieve professionally designed Developing Promotional Strategic Plan For Online Marketing Kpis To Track Personalized Social Media Diagrams PDF to effectively convey your message and captivate your listeners. Save time by selecting pre-made slideshows that are appropriate for various topics, from business to educational purposes. These themes come in many different styles, from creative to corporate, and all of them are easily adjustable and can be edited quickly. Access them as PowerPoint templates or as Google Slides themes. You dont have to go on a hunt for the perfect presentation because Slidegeeks got you covered from everywhere.

KPI To Measure Inbound And Outbound Marketing Campaign Performance Demonstration PDF
The following slide displays Various KPIs which can be used by marketing manager to measure inbound and outbound campaign performance. The KPIs mentioned in the template are email open rate, page views, lead conversion rate, revenue generated etc. Presenting KPI To Measure Inbound And Outbound Marketing Campaign Performance Demonstration PDF to dispense important information. This template comprises two stages. It also presents valuable insights into the topics including Revenue Generated, Conversion Rate, Average Session. This is a completely customizable PowerPoint theme that can be put to use immediately. So, download it and address the topic impactfully.

Ecommerce Operations Management Metrics To Measure Performance Professional PDF
This slide showcases essential metrics of e-commerce to make informed decisions. Major key performance indicators covered are website traffic, shopping cart abandonment rate, revenue per visitor and on time delivery rate. Presenting Ecommerce Operations Management Metrics To Measure Performance Professional PDF to dispense important information. This template comprises one stage. It also presents valuable insights into the topics including Abandonment Rate, Industry Benchmark, Performance. This is a completely customizable PowerPoint theme that can be put to use immediately. So, download it and address the topic impactfully.

Marketing And Sales Pyramid To Measure Performance Ppt Portfolio Structure PDF
This slide focuses on the marketing metrics pyramid to measure performance which includes amount, result, source and nature with metrics such as page views, bounce rate, revenues, conversion rate, next pages, referrals, top landing pages, browsers, platforms, etc. Presenting Marketing And Sales Pyramid To Measure Performance Ppt Portfolio Structure PDF to dispense important information. This template comprises one stages. It also presents valuable insights into the topics including Amount, Bounce Rate, Revenues, Corporations. This is a completely customizable PowerPoint theme that can be put to use immediately. So, download it and address the topic impactfully.
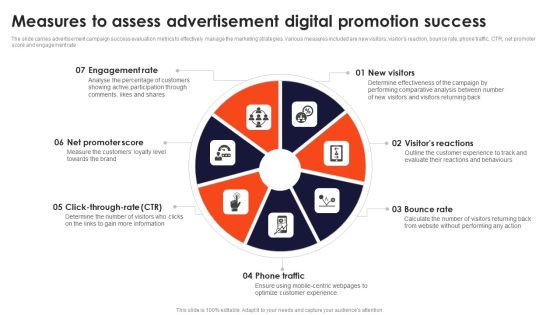
Measures To Assess Advertisement Digital Promotion Success Clipart PDF
The slide carries advertisement campaign success evaluation metrics to effectively manage the marketing strategies. Various measures included are new visitors, visitors reaction, bounce rate, phone traffic, CTR, net promoter score and engagement rate. Presenting Measures To Assess Advertisement Digital Promotion Success Clipart PDF to dispense important information. This template comprises Seven stages. It also presents valuable insights into the topics including New Visitors, Bounce Rate, Phone Traffic. This is a completely customizable PowerPoint theme that can be put to use immediately. So, download it and address the topic impactfully.
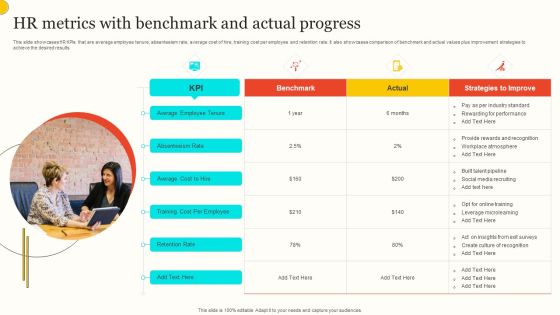
HR Metrics With Benchmark And Actual Progress Background PDF
This slide showcases HR KPIs that are average employee tenure, absenteeism rate, average cost of hire, training cost per employee and retention rate. It also showcases comparison of benchmark and actual values plus improvement strategies to achieve the desired results. Presenting HR Metrics With Benchmark And Actual Progress Background PDF to dispense important information. This template comprises one stages. It also presents valuable insights into the topics including Average Employee Tenure, Absenteeism Rate, Average Cost Hire. This is a completely customizable PowerPoint theme that can be put to use immediately. So, download it and address the topic impactfully.

Variables Influencing Stock Market Conceptual Structure Summary PDF
This slide exhibits various indicators that influence stock market. Purpose of this slide is to determine market trends that helps in stock market growth. It include elements such as exchange rate, inflation rate, GDP, capital market management, turnover rate, share price etc. Presenting Variables Influencing Stock Market Conceptual Structure Summary PDF to dispense important information. This template comprises four stages. It also presents valuable insights into the topics including Dependent Variables, Independent Variables, Intervening Variables. This is a completely customizable PowerPoint theme that can be put to use immediately. So, download it and address the topic impactfully.

Key Metrics To Measure Cloud Based Business Model Performance Template PDF
The slide highlights various KPIs to measure and track SaaS business performance for ensuring a high growth rate. Various metrics included are lifetime value, monthly recurring revenue and churn rate. Presenting Key Metrics To Measure Cloud Based Business Model Performance Template PDF to dispense important information. This template comprises three stages. It also presents valuable insights into the topics including Churn Rate, Lifetime Value, Monthly Recurring Revenue. This is a completely customizable PowerPoint theme that can be put to use immediately. So, download it and address the topic impactfully.
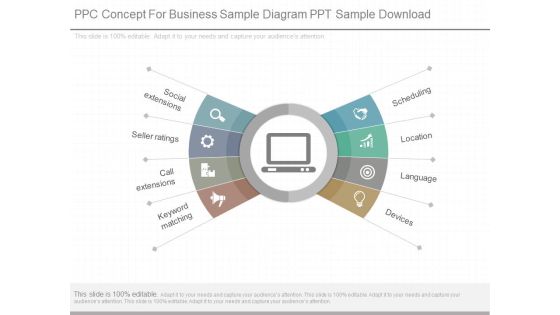
Ppc Concept For Business Sample Diagram Ppt Sample Download
This is a ppc concept for business sample diagram ppt sample download. This is a eight stage process. The stages in this process are social extensions, seller ratings, call extensions, keyword matching, scheduling, location, language, devices.
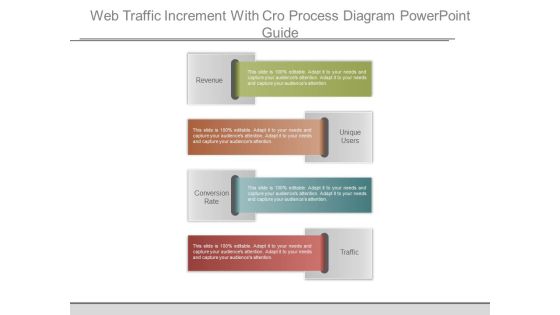
Web Traffic Increment With Cro Process Diagram Powerpoint Guide
This is a web traffic increment with cro process diagram powerpoint guide. This is a four stage process. The stages in this process are revenue, unique users, conversion rate, traffic.
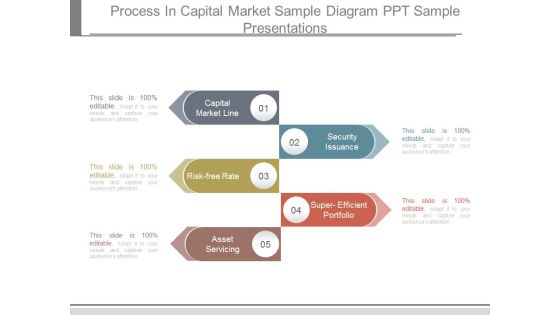
Process In Capital Market Sample Diagram Ppt Sample Presentations
This is a process in capital market sample diagram ppt sample presentations. This is a five stage process. The stages in this process are capital market line, security issuance, risk free rate, super efficient portfolio, asset servicing.
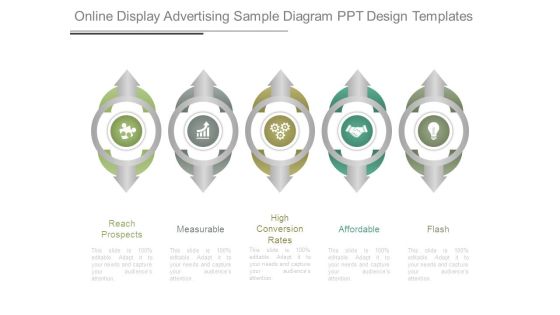
Online Display Advertising Sample Diagram Ppt Design Templates
This is a online display advertising sample diagram ppt design templates. This is a five stage process. The stages in this process are reach prospects, measurable, high conversion rates, affordable, flash.

Clear Conversion Goal Example Diagram Powerpoint Slide Clipart
This is a clear conversion goal example diagram powerpoint slide clipart. This is a five stage process. The stages in this process are discovering and listening, unique users, active optimization, conversion rate, repeat.

Clear Conversion Goal Example Diagram Ppt Examples Professional
This is a clear conversion goal example diagram ppt examples professional. This is a five stage process. The stages in this process are result and analysis, conversion rate, repeat, unique users, revenue.

Successful Staff Retention Techniques Addressing The Various Employee Retention Goals Themes PDF
The purpose of this slide is to showcase different objectives for staff retention. The major objectives outlined in the slide are reducing employee turnover rate, increasing employee satisfaction rate, increasing productivity rate, improving customer experience rate, and reducing the average time of recruitment per employee. Slidegeeks is one of the best resources for PowerPoint templates. You can download easily and regulate Successful Staff Retention Techniques Addressing The Various Employee Retention Goals Themes PDF for your personal presentations from our wonderful collection. A few clicks is all it takes to discover and get the most relevant and appropriate templates. Use our Templates to add a unique zing and appeal to your presentation and meetings. All the slides are easy to edit and you can use them even for advertisement purposes.

Targeted Marketing Strategic Plan For Audience Engagement Kpis To Track Personalized Mobile Application Marketing Campaign Results Themes PDF
This slide showcases KPIs that can help organization in measure the results of personalized mobile application marketing campaign. KPIs include - audience growth rate, engagement rate, conversion rate, customer satisfaction score and click through rate. Do you have to make sure that everyone on your team knows about any specific topic I yes, then you should give Targeted Marketing Strategic Plan For Audience Engagement Kpis To Track Personalized Mobile Application Marketing Campaign Results Themes PDF a try. Our experts have put a lot of knowledge and effort into creating this impeccable Targeted Marketing Strategic Plan For Audience Engagement Kpis To Track Personalized Mobile Application Marketing Campaign Results Themes PDF. You can use this template for your upcoming presentations, as the slides are perfect to represent even the tiniest detail. You can download these templates from the Slidegeeks website and these are easy to edit. So grab these today.
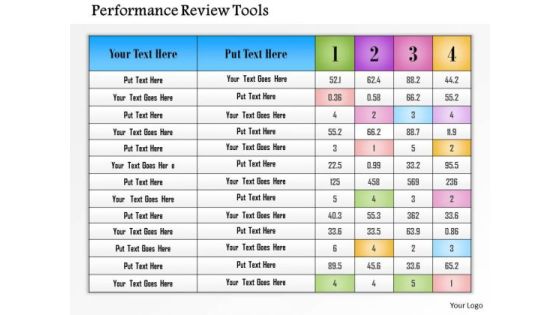
Business Framework Performance Review Tools PowerPoint Presentation
This Power Point template slide has been designed with graphic of text box chart. This text box chart contains the performance tools and ratings. This PPT slide can be used for business and individual performance judgment techniques with these tools.
 Home
Home