Star Performer
Marketing And Operation KPI Dashboard To Increase Efficiency Icons PDF
This slide covers sales and operations KPI dashboard to increase efficiency. It involves performance, increase in profit, target, monthly profit and quarterly revenue trend. Pitch your topic with ease and precision using this Marketing And Operation KPI Dashboard To Increase Efficiency Icons PDF. This layout presents information on Profit By Monthly, Target, Performance. It is also available for immediate download and adjustment. So, changes can be made in the color, design, graphics or any other component to create a unique layout.

Marketing Reach By Channels Ppt PowerPoint Presentation Styles Professional
This is a marketing reach by channels ppt powerpoint presentation styles professional. This is a six stage process. The stages in this process are top performing, non scalable, emails, print ads, inline media.

Eight Steps Of Product Procurement Management Ppt Ideas Samples PDF
This slide includes process of procurement category management. It includes define and assess category, ,assess performance, set targets, develop strategies, tactics, implementation and review. Presenting Eight Steps Of Product Procurement Management Ppt Ideas Samples PDF to dispense important information. This template comprises eight stages. It also presents valuable insights into the topics including Define Category, Assess Performance, Develop Strategies. This is a completely customizable PowerPoint theme that can be put to use immediately. So, download it and address the topic impactfully.
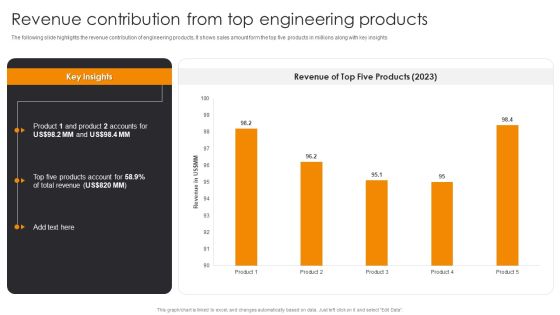
Revenue Contribution From Top Engineering Products Engineering Company Financial Analysis Report Infographics PDF
The following slide highlights the revenue contribution of engineering products, It shows sales amount form the top five products in millions along with key insights. This Revenue Contribution From Top Engineering Products Engineering Company Financial Analysis Report Infographics PDF from Slidegeeks makes it easy to present information on your topic with precision. It provides customization options, so you can make changes to the colors, design, graphics, or any other component to create a unique layout. It is also available for immediate download, so you can begin using it right away. Slidegeeks has done good research to ensure that you have everything you need to make your presentation stand out. Make a name out there for a brilliant performance.

Website Medical Checkup Key Metrics Themes PDF
The following slide showcases key metrics for checking website health score to boost performance. It includes key metrics like functionality, security, design, structure, content and engagement. Pitch your topic with ease and precision using this Website Medical Checkup Key Metrics Themes PDF. This layout presents information on Evaluate Performance, Environment, Metrics. It is also available for immediate download and adjustment. So, changes can be made in the color, design, graphics or any other component to create a unique layout.

Best Practices For High Quality Vendor Management Ppt Gallery Icons PDF
This slide shows the best practices that the company must implement to ensure better- and high-quality governance over vendor management such as managing vendor contract details, tracking vendors performance, track vendors qualifications, analyze vendors risk, track vendors insurance details etc. This is a best practices for high quality vendor management ppt gallery icons pdf template with various stages. Focus and dispense information on nine stages using this creative set, that comes with editable features. It contains large content boxes to add your information on topics like measure vendors performance, analyze vendors risk, vendor performance. You can also showcase facts, figures, and other relevant content using this PPT layout. Grab it now.

IT Infrastructure Management Diagrams PDF
This slide covers the store category wherein focus will be on performance, availability, service level compliance and event data.Presenting IT Infrastructure Management Diagrams PDF to provide visual cues and insights. Share and navigate important information on four stages that need your due attention. This template can be used to pitch topics like Performance, Level Compliance, Availability Response. In addtion, this PPT design contains high resolution images, graphics, etc, that are easily editable and available for immediate download.

Go To Market Strategy Startup Presentation Diagrams
This is a go to market strategy startup presentation diagrams. This is a four stage process. The stages in this process are identify need, develop solution, go to market, accelerate performance.

Validate Change And Application Diagram Powerpoint Show
This is a validate change and application diagram powerpoint show. This is a seven stage process. The stages in this process are validate change and application, result orientation, services excellence, sustainability growth, leadership effectiveness, individual performance, enhance result.

Sales Management Framework Diagram Presentation Powerpoint
This is a sales management framework diagram presentation powerpoint. This is a four stage process. The stages in this process are sales planning, sales leadership, sales talent, sales performance.

Sales Management Functions Sample Powerpoint Slide Diagram
This is a sales management functions sample powerpoint slide diagram. This is a seven stage process. The stages in this process are planning, resources, controlling, staffing, performance, leading, training.

Business Process Workflow Diagram Ppt Model
This is a business process workflow diagram ppt model. This is a five stage process. The stages in this process are structure of business process, business process, main task, subtask, activity, performance, analysis of business process.

Business Administration Fishbone Diagram Example Of Ppt
This is a business administration fishbone diagram example of ppt. This is a seven stage process. The stages in this process are efficiency, skill, teamwork, performance, leadership, motivation, success.
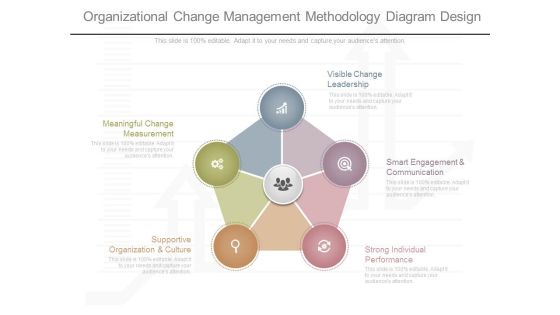
Organizational Change Management Methodology Diagram Design
This is a organizational change management methodology diagram design. This is a five stage process. The stages in this process are meaningful change measurement, visible change leadership, smart engagement, and communication, strong individual performance, supportive organization and culture.
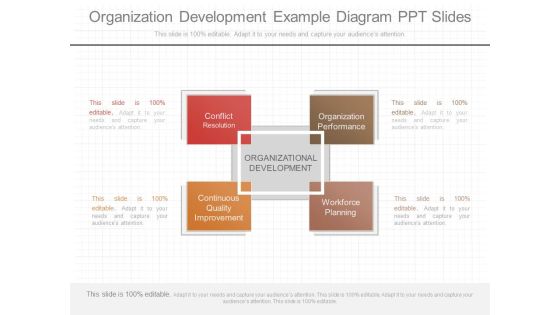
Organization Development Example Diagram Ppt Slides
This is a organization development example diagram ppt slides. This is a four stage process. The stages in this process are conflict resolution, organization performance, organizational development, continuous quality improvement, workforce planning.
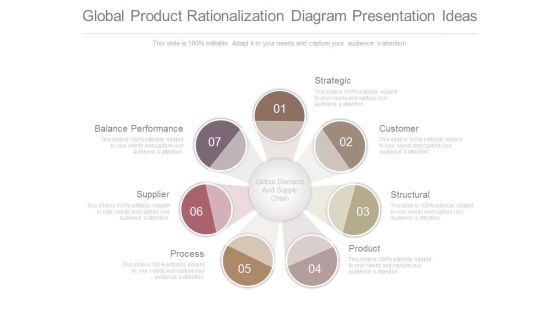
Global Product Rationalization Diagram Presentation Ideas
This is a global product rationalization diagram presentation ideas. This is a seven stage process. The stages in this process are strategic, customer, structural, product, process, supplier, balance performance, global demand and supply chain.

Corporate Planning Cycle Sample Diagram Powerpoint Slides
This is a corporate planning cycle sample diagram powerpoint slides. This is a six stage process. The stages in this process are gather information, mission and goals, devise strategies, implement plan, monitor performance, evaluate plan.

Business Intelligence In Entrepreneurship Ppt Presentation Diagrams
This is a business intelligence in entrepreneurship ppt presentation diagrams. This is a five stage process. The stages in this process are trends, efficiency, performance, fast and reliable, knowledge.

Wealth Management Techniques Sample Diagram Slides
This is a wealth management techniques sample diagram slides. This is a six stage process. The stages in this process are developing strategy, product and services, monitoring performance, analyzing needs, establishing relationship, understand client.

Workforce Development Strategy Diagram Good Ppt Example
This is a workforce development strategy diagram good ppt example. This is a six stage process. The stages in this process are innovation, leadership, social networks, customer value, performance, strategy.

Right Products And Services Presentation Diagrams
This is a right products and services presentation diagrams. This is a six stage process. The stages in this process are developing strategy, right products and services, monitoring performance, establishing relationship, understanding client, analyzing needs.

Motivating And Managing Staff Diagram Powerpoint Guide
This is a motivating and managing staff diagram powerpoint guide. This is a six stage process. The stages in this process are setting goals, quality, teamwork, measuring performance, motivation, excellent.
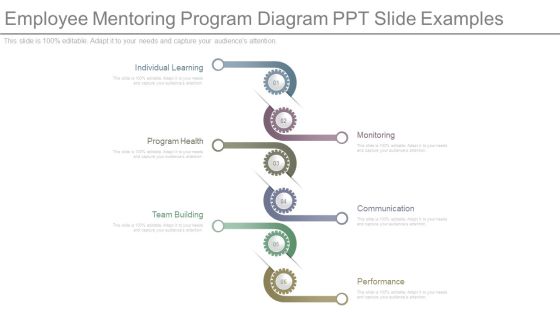
Employee Mentoring Program Diagram Ppt Slide Examples
This is a employee mentoring program diagram ppt slide examples. This is a six stage process. The stages in this process are individual learning, program health, team building, monitoring, communication, performance.
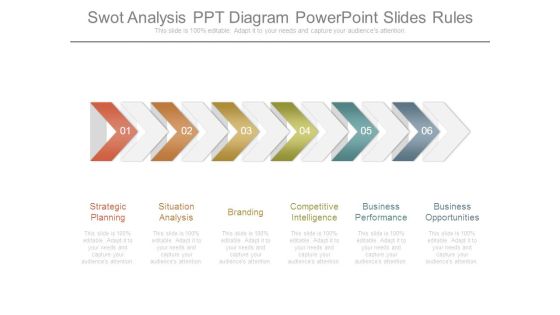
Swot Analysis Ppt Diagram Powerpoint Slides Rules
This is a swot analysis ppt diagram powerpoint slides rules. This is a six stage process. The stages in this process are strategic planning, situation analysis, branding, competitive intelligence, business performance, business opportunities.

Business Management Consulting Services Diagram Powerpoint Slide
This is a business management consulting services diagram powerpoint slide. This is a eight stage process. The stages in this process are strategy, business consulting, performance, management, operations, data sciences, organization, enterprise devices.

Annual Planning Calendar Diagram Powerpoint Guide
This is a annual planning calendar diagram powerpoint guide. This is a six stage process. The stages in this process are strategic management model, managing profit and performance, product service, values mission vision, external environment, financial objectives.
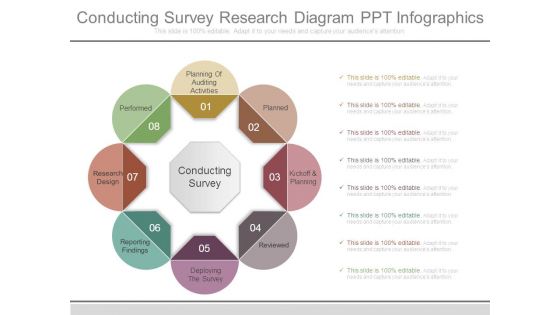
Conducting Survey Research Diagram Ppt Infographics
This is a conducting survey research diagram ppt infographics. This is a eight stage process. The stages in this process are planned, kickoff and planning, reviewed, deploying the survey, reporting findings, research design, performed, planning of auditing activities, conducting survey.
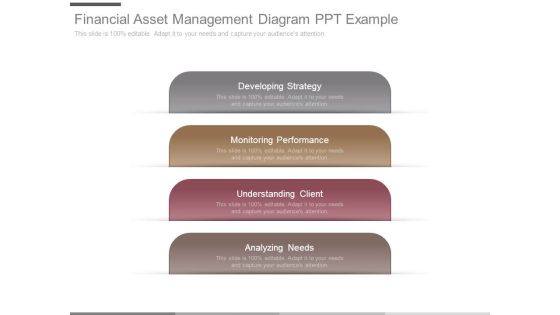
Financial Asset Management Diagram Ppt Example
This is a financial asset management diagram ppt example. This is a four stage process. The stages in this process are developing strategy, monitoring performance, understanding client, analyzing needs.

Project Closure Report Diagram Ppt Slides Download
This is a project closure report diagram ppt slides download. This is a three stage process. The stages in this process are document information, project performance, evaluate the project.
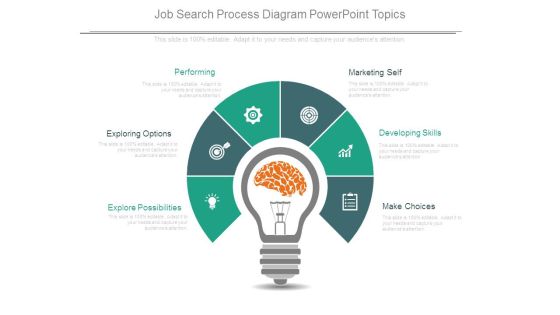
Job Search Process Diagram Powerpoint Topics
This is a job search process diagram powerpoint topics. This is a six stage process. The stages in this process are performing, exploring options, explore possibilities, marketing self, developing skills, make choices.

Annual Strategic Planning Process Diagram Powerpoint Topics
This is a annual strategic planning process diagram powerpoint topics. This is a four stage process. The stages in this process are engage with primary stake holders, analysis performance, prepare annual business plan, identity focus areas.

Business Drivers Diagram Presentation Background Images
This is a business drivers diagram presentation background images. This is a five stage process. The stages in this process are business process, lead generation, sales activates, sales pipeline management, revenue performance.
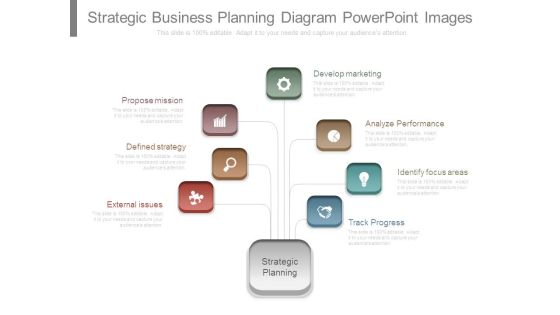
Strategic Business Planning Diagram Powerpoint Images
This is a strategic business planning diagram powerpoint images. This is a seven stage process. The stages in this process are propose mission, defined strategy, external issues, develop marketing, analyze performance, identify focus areas, track progress, strategic planning.

Associate Investigation Planning Diagram Powerpoint Templates
This is a associate investigation planning diagram powerpoint templates. This is a six stage process. The stages in this process are collection, analysis, examination, reporting, public confidence, consistent performance.

Internal Consulting Skills Diagram Presentation Layouts
This is a internal consulting skills diagram presentation layouts. This is a six stage process. The stages in this process are plans, performance, strategy, evaluation and learning, expertise, information and assessment.

Business Planning And Strategy Diagram Ppt Inspiration
This is a business planning and strategy diagram ppt inspiration. This is a four stage process. The stages in this process are analyze performance, identify focus areas, create new value curve, track progress.

Sales Audit Report Diagram Powerpoint Slide Background
This is a sales audit report diagram powerpoint slide background. This is a five stage process. The stages in this process are field sales, people, relationship management, sales performance, governance.

Cost Reduction Assessment Diagram Ppt Example
This is a cost reduction assessment diagram ppt example. This is a four stage process. The stages in this process are define the cost of decision, cost of service, analyze financial performance, cost of medical devices.
Logistics Kpis And Metrics Percentage Of Orders Delivered Ppt PowerPoint Presentation Icon
This is a logistics kpis and metrics percentage of orders delivered ppt powerpoint presentation icon. This is a five stage process. The stages in this process are logistics performance, logistics dashboard, logistics kpis.

5 Step Circular Flow For Human Behavior Ppt PowerPoint Presentation Diagrams
This is a 5 step circular flow for human behavior ppt powerpoint presentation diagrams. This is a five stage process. The stages in this process are leadership, opportunities, performance, business, icons.
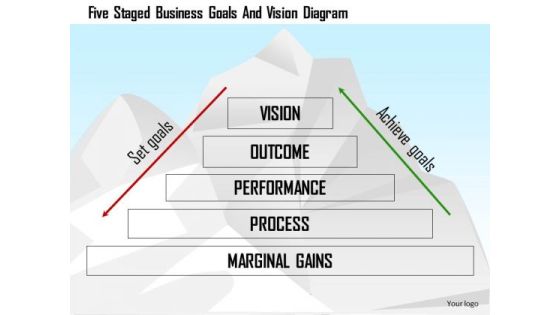
Business Diagram Five Staged Business Goals And Vision Diagram Presentation Template
This slide depicts diagram for set goals and achieve goals. It contains stages of vision, outcome. Performance, process and marginal gains. It will make your presentation look professional and keep your audience mesmerized.

Key Elements To Develop Effective Strategic Reporting Diagrams PDF
Mentioned slide includes key components to be included in strategy report to determine business weaknesses. It includes components such as objectives, performance, strategic issues and problem solving solutions Presenting Key Elements To Develop Effective Strategic Reporting Diagrams PDF to dispense important information. This template comprises four stages. It also presents valuable insights into the topics including Objectives, Performance, Issues . This is a completely customizable PowerPoint theme that can be put to use immediately. So, download it and address the topic impactfully.

Business Diagram Pencil Infographic For Business Presentation Template
The above template contains diagram of pencil infographic. This diagram may be used to display market research information. Earn appreciation with our slide. Your listeners will surely laud your performance.
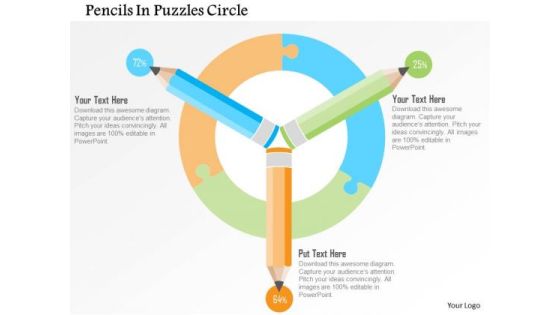
Business Diagram Pencils In Puzzles Circle Presentation Template
The above template contains diagram of pencil infographic. This diagram may be used to display market research information. Earn appreciation with our slide. Your listeners will surely laud your performance.
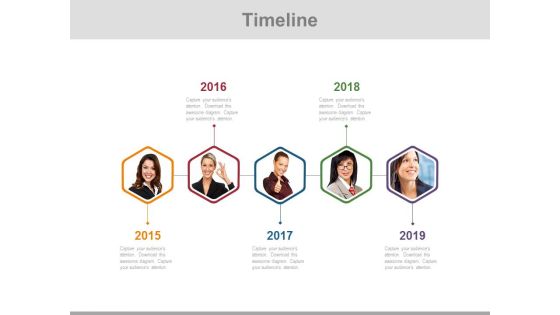
Linear Timeline Diagram With Employee Pictures Powerpoint Slides
This PowerPoint timeline slide design can be used to display year wise employee?s performance. It contain timeline diagram with employee pictures. This timeline template can be used in presentations where you need to display business strategy and planning.

Leading And Lagging Indicators Diagram Example Of Ppt
This is a leading and lagging indicators diagram example of ppt. This is a two stage process. The stages in this process are legging indicator, management ability, employee engagement, leading indicator, process improvement, financial performance, customer loyalty.
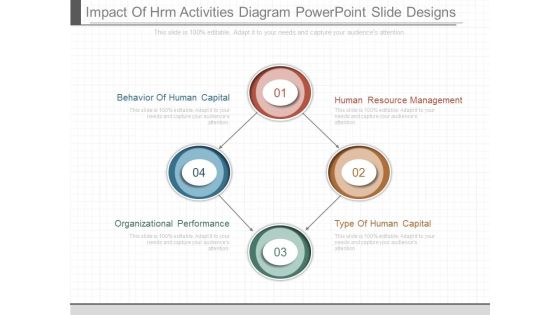
Impact Of Hrm Activities Diagram Powerpoint Slide Designs
This is a impact of hrm activities diagram powerpoint slide designs. This is a four stage process. The stages in this process are human resource management, type of human capital, organizational performance, behavior of human capital.

Identifying And Controlling Business Risks Diagram Powerpoint Show
This is a identifying and controlling business risks diagram powerpoint show. This is a seven stage process. The stages in this process are monitor performance, set objectives, identify risks, implement action plan, produce action plan, assess risk, define success criteria.
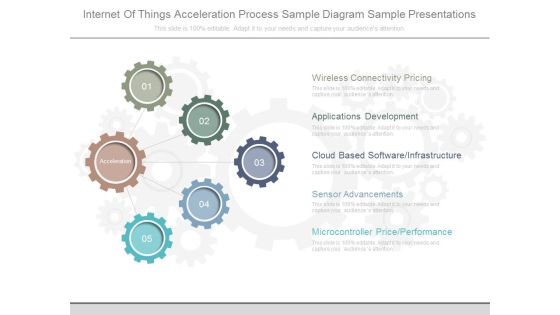
Internet Of Things Acceleration Process Sample Diagram Sample Presentations
This is a internet of things acceleration process sample diagram sample presentations. This is a five stage process. The stages in this process are wireless connectivity pricing, applications development, cloud based software infrastructure, sensor advancements, microcontroller price performance, acceleration.

Building Capability Through Competence Diagram Powerpoint Slide Graphics
This is a building capability through competence diagram powerpoint slide graphics. This is a five stage process. The stages in this process are building capability through competence, learning, goals and, objectives, analysis, feedback and, dialogue, performance.

Organizational Effectiveness To The Management Diagram Ppt Design
This is a organizational effectiveness to the management diagram ppt design. This is a three stage process. The stages in this process are strategy, structure, leadership, process, employee engagement, customer experience, organizational performance.

Process Of Cro Analysis Sample Diagram Powerpoint Image
This is a process of cro analysis sample diagram powerpoint image. This is a four stage process. The stages in this process are review performance, development and testing, research and analysis, design variations.
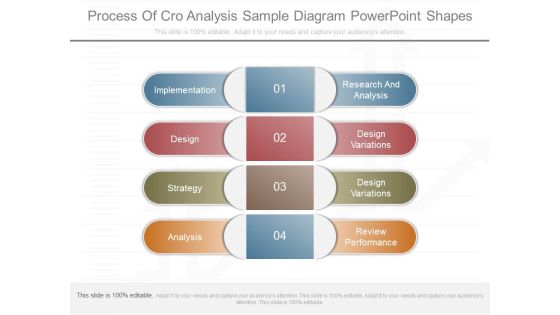
Process Of Cro Analysis Sample Diagram Powerpoint Shapes
This is a process of cro analysis sample diagram powerpoint shapes. This is a four stage process. The stages in this process are implementation, design, strategy, analysis, research and analysis, design variations, design variations, review performance.
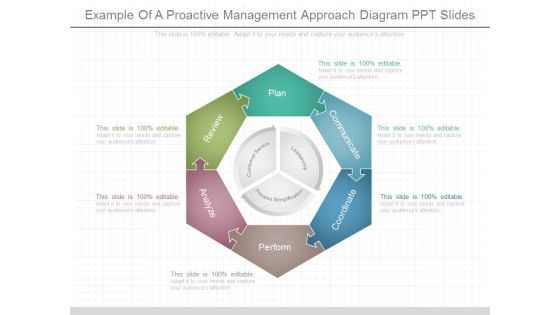
Example Of A Proactive Management Approach Diagram Ppt Slides
This is a example of a proactive management approach diagram ppt slides. This is a six stage process. The stages in this process are plan, communicate, coordinate, perform, analyze, review, customer service, leadership, process simplification.

Elements Of Business Control Process Diagram Powerpoint Layout
This is a elements of business control process diagram powerpoint layout. This is a four stage process. The stages in this process are the control process, communication result, monitor and record performance, corrective action, fix the standards.

Example Of Brand Resonance Pyramid Ppt Presentation Diagrams
This is a example of brand resonance pyramid ppt presentation diagrams. This is a eight stage process. The stages in this process are resonance, feeling, imagery, salience, response, performance, judgments, emotional.

Process Of Cro Analysis Sample Diagram Ppt Slide
This is a process of cro analysis sample diagram ppt slide. This is a seven stage process. The stages in this process are strategy, report, measure, design variations, design, research and analysis, review performance.

Foreign Exchange Hedging Process Diagram Ppt Background Images
This is a foreign exchange hedging process diagram ppt background images. This is a five stage process. The stages in this process are evaluate result, identity exposures, monitor performance, formulate hedging strategy, determine budget.

Example Of Optimized Investment Sample Diagram Powerpoint Graphics
This is a example of optimized investment sample diagram powerpoint graphics. This is a eight stage process. The stages in this process are customer, performance, profit, capital protection, leverage, yield enhancement, sales, brand growth.
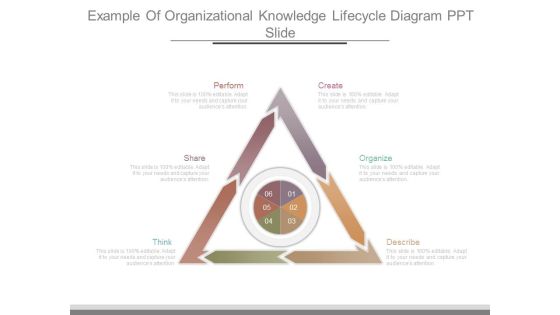
Example Of Organizational Knowledge Lifecycle Diagram Ppt Slide
This is a example of organizational knowledge lifecycle diagram ppt slide. This is a six stage process. The stages in this process are create, organize, describe, think, share, perform.
 Home
Home