Stakeholder Management Plan
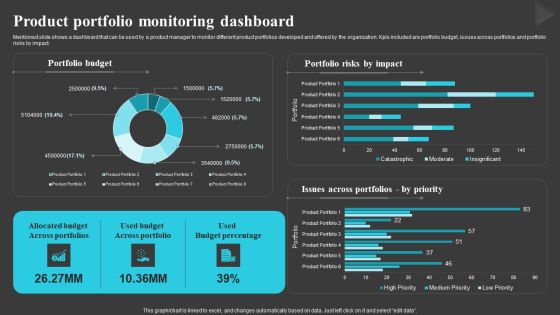
Product Portfolio Monitoring Dashboard Creating And Offering Multiple Product Ranges In New Business Diagrams PDF
Mentioned slide shows a dashboard that can be used by a product manager to monitor different product portfolios developed and offered by the organization. Kpis included are portfolio budget, issues across portfolios and portfolio risks by impact.Crafting an eye-catching presentation has never been more straightforward. Let your presentation shine with this tasteful yet straightforward Product Portfolio Monitoring Dashboard Creating And Offering Multiple Product Ranges In New Business Diagrams PDF template. It offers a minimalistic and classy look that is great for making a statement. The colors have been employed intelligently to add a bit of playfulness while still remaining professional. Construct the ideal Product Portfolio Monitoring Dashboard Creating And Offering Multiple Product Ranges In New Business Diagrams PDF that effortlessly grabs the attention of your audience Begin now and be certain to wow your customers.
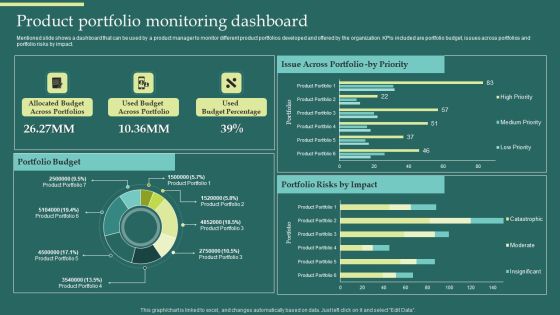
Product Portfolios And Strategic Product Portfolio Monitoring Dashboard Introduction PDF
Mentioned slide shows a dashboard that can be used by a product manager to monitor different product portfolios developed and offered by the organization. KPIs included are portfolio budget, issues across portfolios and portfolio risks by impact. Explore a selection of the finest Product Portfolios And Strategic Product Portfolio Monitoring Dashboard Introduction PDF here. With a plethora of professionally designed and pre-made slide templates, you can quickly and easily find the right one for your upcoming presentation. You can use our Product Portfolios And Strategic Product Portfolio Monitoring Dashboard Introduction PDF to effectively convey your message to a wider audience. Slidegeeks has done a lot of research before preparing these presentation templates. The content can be personalized and the slides are highly editable. Grab templates today from Slidegeeks.

Comprehensive Guide For Multi Level Dashboard To Track Binary Multi Level Marketing Formats PDF
This slide represents metric dashboard that helps marketers in tracking and managing binary network marketing. It covers KPIs such as network bonus, expenditure, profit etc. This Comprehensive Guide For Multi Level Dashboard To Track Binary Multi Level Marketing Formats PDF is perfect for any presentation, be it in front of clients or colleagues. It is a versatile and stylish solution for organizing your meetings. The Comprehensive Guide For Multi Level Dashboard To Track Binary Multi Level Marketing Formats PDF features a modern design for your presentation meetings. The adjustable and customizable slides provide unlimited possibilities for acing up your presentation. Slidegeeks has done all the homework before launching the product for you. So, dont wait, grab the presentation templates today.
How Overall Brand Reputation Can Be Improved Comprehensive Guide For Brand Recognition Icons PDF
This slide provides information regarding overall brand reputation improvement by highlighting its rile in consumer loyalty, initiatives to manage brand reputation and statistics associated with it. This How Overall Brand Reputation Can Be Improved Comprehensive Guide For Brand Recognition Icons PDF is perfect for any presentation, be it in front of clients or colleagues. It is a versatile and stylish solution for organizing your meetings. The How Overall Brand Reputation Can Be Improved Comprehensive Guide For Brand Recognition Icons PDF features a modern design for your presentation meetings. The adjustable and customizable slides provide unlimited possibilities for acing up your presentation. Slidegeeks has done all the homework before launching the product for you. So, do not wait, grab the presentation templates today

Implementing Cyber Security Incident Cyber Security Risk Assessment And Matrix Introduction PDF
This slide represents the dashboard to assess, analyze and manage the cyber security risks within an organization. It includes details related to directories with direct access, inactive accounts etc. Get a simple yet stunning designed Implementing Cyber Security Incident Cyber Security Risk Assessment And Matrix Introduction PDF. It is the best one to establish the tone in your meetings. It is an excellent way to make your presentations highly effective. So, download this PPT today from Slidegeeks and see the positive impacts. Our easy to edit Implementing Cyber Security Incident Cyber Security Risk Assessment And Matrix Introduction PDF can be your go to option for all upcoming conferences and meetings. So, what are you waiting for Grab this template today.

Introduction To New Product Portfolio Dashboard To Measure Business Performance Ppt Ideas Clipart Images PDF
This slide illustrates a dashboard that can be used by a product manager to measure the business performance. Metrics covered in the dashboard are revenue, launches, cash flow, EPS, average revenue by product and average cost by phase. Are you in need of a template that can accommodate all of your creative concepts. This one is crafted professionally and can be altered to fit any style. Use it with Google Slides or PowerPoint. Include striking photographs, symbols, depictions, and other visuals. Fill, move around, or remove text boxes as desired. Test out color palettes and font mixtures. Edit and save your work, or work with colleagues. Download Introduction To New Product Portfolio Dashboard To Measure Business Performance Ppt Ideas Clipart Images PDF and observe how to make your presentation outstanding. Give an impeccable presentation to your group and make your presentation unforgettable.

Guide To Create Advertising Campaign For Client Engagement Budget Distribution For Conducting Advertising Campaigns Summary PDF
This slide showcases the distribution of budgets by managers for various ad campaigns. The campaigns covered are for the product, email, content and seasonal marketing. Are you in need of a template that can accommodate all of your creative concepts. This one is crafted professionally and can be altered to fit any style. Use it with Google Slides or PowerPoint. Include striking photographs, symbols, depictions, and other visuals. Fill, move around, or remove text boxes as desired. Test out color palettes and font mixtures. Edit and save your work, or work with colleagues. Download Guide To Create Advertising Campaign For Client Engagement Budget Distribution For Conducting Advertising Campaigns Summary PDF and observe how to make your presentation outstanding. Give an impeccable presentation to your group and make your presentation unforgettable.
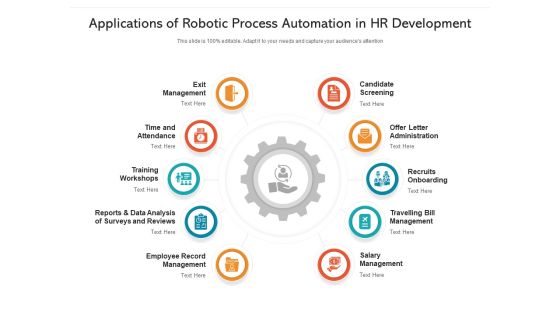
Applications Of Robotic Process Automation In Hr Development Ppt PowerPoint Presentation File Mockup PDF
Presenting Applications Of Robotic Process Automation In Hr Development Ppt PowerPoint Presentation File Mockup PDF to dispense important information. This template comprises ten stages. It also presents valuable insights into the topics including candidate screening, recruits onboarding, travelling bill management, salary management, employee record management. This is a completely customizable PowerPoint theme that can be put to use immediately. So, download it and address the topic impactfully.

Integrating Naas Service Model Top Global Network As A Service Provider Of 2023 Ppt File Introduction PDF
This slide outlines the top global NaaS providers and includes Aryaka smart services, Perimeter 81, Cloudflare Magic WAN, Cisco plus NaaS, and Akamai Aura Managed CDN. It also covers the services offered by these vendors to customers. Present like a pro with Integrating Naas Service Model Top Global Network As A Service Provider Of 2023 Ppt File Introduction PDF Create beautiful presentations together with your team, using our easy-to-use presentation slides. Share your ideas in real-time and make changes on the fly by downloading our templates. So whether you are in the office, on the go, or in a remote location, you can stay in sync with your team and present your ideas with confidence. With Slidegeeks presentation got a whole lot easier. Grab these presentations today.

Playbook For Advancing Technology Digital Services Teams Overview Role And Types Professional PDF
This slide provides information regarding digital services teams which are also called as tech surge teams. The role of team is to manage technology failures at priority, strategies deployment across government digital transformation projects, etc. The types of teams include centralized, enterprise or agency-level teams. Do you have to make sure that everyone on your team knows about any specific topic I yes, then you should give Playbook For Advancing Technology Digital Services Teams Overview Role And Types Professional PDF a try. Our experts have put a lot of knowledge and effort into creating this impeccable Playbook For Advancing Technology Digital Services Teams Overview Role And Types Professional PDF. You can use this template for your upcoming presentations, as the slides are perfect to represent even the tiniest detail. You can download these templates from the Slidegeeks website and these are easy to edit. So grab these today.

Product Portfolios And Strategic Dashboard To Measure Business Performance Portrait PDF
This slide illustrates a dashboard that can be used by a product manager to measure the business performance. Metrics covered in the dashboard are revenue, launches, cash flow, EPS, average revenue by product and average cost by phase. Do you have an important presentation coming up Are you looking for something that will make your presentation stand out from the rest Look no further than Product Portfolios And Strategic Dashboard To Measure Business Performance Portrait PDF. With our professional designs, you can trust that your presentation will pop and make delivering it a smooth process. And with Slidegeeks, you can trust that your presentation will be unique and memorable. So why wait Grab Product Portfolios And Strategic Dashboard To Measure Business Performance Portrait PDF today and make your presentation stand out from the rest.
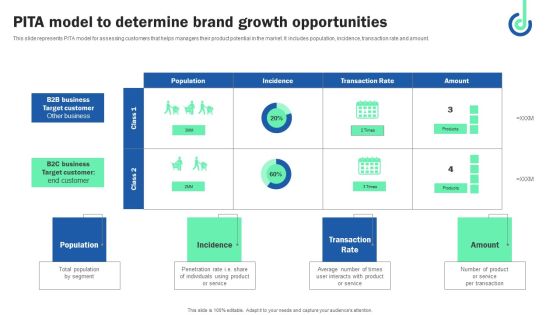
Pita Model To Determine Brand Growth Opportunities Background PDF
This slide represents PITA model for assessing customers that helps managers their product potential in the market. It includes population, incidence, transaction rate and amount. Do you have an important presentation coming up Are you looking for something that will make your presentation stand out from the rest Look no further than Pita Model To Determine Brand Growth Opportunities Background PDF. With our professional designs, you can trust that your presentation will pop and make delivering it a smooth process. And with Slidegeeks, you can trust that your presentation will be unique and memorable. So why wait Grab Pita Model To Determine Brand Growth Opportunities Background PDF today and make your presentation stand out from the rest.
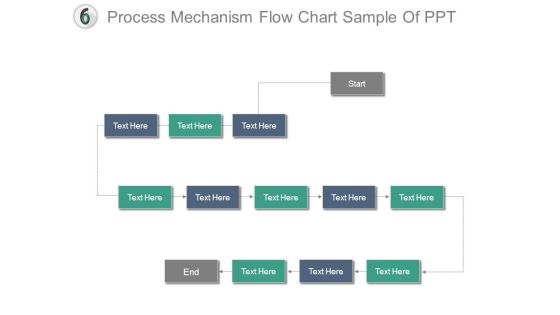
Process Mechanism Flow Chart Sample Of Ppt
This is a process mechanism flow chart sample of ppt. This is a thirteen stage process. The stages in this process are business, management, process, marketing, cyclic.

Analysis Of Pre And Post Automated Communication Workflow Flowchart Rules PDF
This slide compares the customer communication workflow model before and after automation. It include steps such as receiving query, manager response, bot enquiry, bot response etc. Formulating a presentation can take up a lot of effort and time, so the content and message should always be the primary focus. The visuals of the PowerPoint can enhance the presenters message, so our Analysis Of Pre And Post Automated Communication Workflow Flowchart Rules PDF was created to help save time. Instead of worrying about the design, the presenter can concentrate on the message while our designers work on creating the ideal templates for whatever situation is needed. Slidegeeks has experts for everything from amazing designs to valuable content, we have put everything into Analysis Of Pre And Post Automated Communication Workflow Flowchart Rules PDF

Process Structure Chart Sample Of Ppt Presentation
This is a process structure chart sample of ppt presentation. This is a five stage process. The stages in this process are business, management, process, marketing, cyclic.
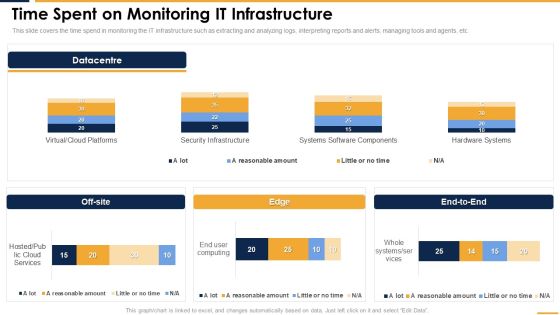
Time Spent On Monitoring IT Infrastructure Professional PDF
This slide covers the time spend in monitoring the IT infrastructure such as extracting and analyzing logs, interpreting reports and alerts, managing tools and agents, etc. Explore a selection of the finest Time Spent On Monitoring IT Infrastructure Professional PDF here. With a plethora of professionally designed and pre made slide templates, you can quickly and easily find the right one for your upcoming presentation. You can use our Time Spent On Monitoring IT Infrastructure Professional PDF to effectively convey your message to a wider audience. Slidegeeks has done a lot of research before preparing these presentation templates. The content can be personalized and the slides are highly editable. Grab templates today from Slidegeeks.

Introducing New Commodities Through Product Line Extension Product Line Performance And Outlook Infographics PDF
This slide showcases product line performance and outlook by market division which can help branding managers identify overall inputs. It provides details about increased sales, overseas market, lower marketing expenses, increased demand, etc. The Introducing New Commodities Through Product Line Extension Product Line Performance And Outlook Infographics PDF is a compilation of the most recent design trends as a series of slides. It is suitable for any subject or industry presentation, containing attractive visuals and photo spots for businesses to clearly express their messages. This template contains a variety of slides for the user to input data, such as structures to contrast two elements, bullet points, and slides for written information. Slidegeeks is prepared to create an impression.
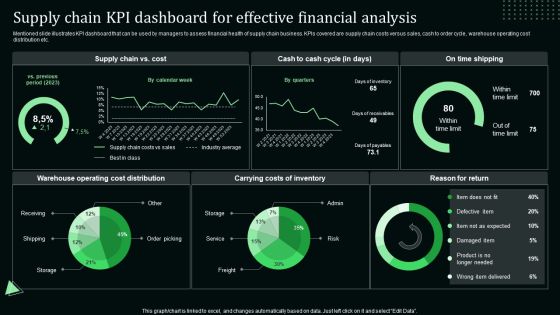
Supply Chain Kpi Dashboard For Effective Financial Analysis Stand Out Digital Supply Chain Tactics Enhancing Graphics PDF
Mentioned slide illustrates KPI dashboard that can be used by managers to assess financial health of supply chain business. KPIs covered are supply chain costs versus sales, cash to order cycle, warehouse operating cost distribution etc.Coming up with a presentation necessitates that the majority of the effort goes into the content and the message you intend to convey. The visuals of a PowerPoint presentation can only be effective if it supplements and supports the story that is being told. Keeping this in mind our experts created Supply Chain Kpi Dashboard For Effective Financial Analysis Stand Out Digital Supply Chain Tactics Enhancing Graphics PDF to reduce the time that goes into designing the presentation. This way, you can concentrate on the message while our designers take care of providing you with the right template for the situation.

Nike Brand Expansion Product Line Performance And Outlook By Division Template PDF
This slide showcases product line performance and outlook by market division which can help branding managers identify overall inputs. It provides details about increased sales, overseas market, lower marketing expenses, increased demand, etc. Explore a selection of the finest Nike Brand Expansion Product Line Performance And Outlook By Division Template PDF here. With a plethora of professionally designed and pre made slide templates, you can quickly and easily find the right one for your upcoming presentation. You can use our Nike Brand Expansion Product Line Performance And Outlook By Division Template PDF to effectively convey your message to a wider audience. Slidegeeks has done a lot of research before preparing these presentation templates. The content can be personalized and the slides are highly editable. Grab templates today from Slidegeeks.

Advertising New Commodities Through Product Line Performance And Outlook Rules PDF
This slide showcases product line performance and outlook by market division which can help branding managers identify overall inputs. It provides details about increased sales, overseas market, lower marketing expenses, increased demand, etc. Get a simple yet stunning designed Advertising New Commodities Through Product Line Performance And Outlook Rules PDF. It is the best one to establish the tone in your meetings. It is an excellent way to make your presentations highly effective. So, download this PPT today from Slidegeeks and see the positive impacts. Our easy-to-edit Advertising New Commodities Through Product Line Performance And Outlook Rules PDF can be your go-to option for all upcoming conferences and meetings. So, what are you waiting for Grab this template today.
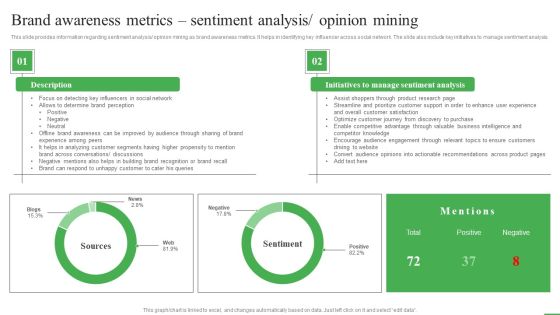
How To Boost Brand Recognition Brand Awareness Metrics Sentiment Analysis Diagrams PDF
This slide provides information regarding sentiment analysis or opinion mining as brand awareness metrics. It helps in identifying key influencer across social network. The slide also include key initiatives to manage sentiment analysis. Presenting this PowerPoint presentation, titled How To Boost Brand Recognition Brand Awareness Metrics Sentiment Analysis Diagrams PDF, with topics curated by our researchers after extensive research. This editable presentation is available for immediate download and provides attractive features when used. Download now and captivate your audience. Presenting this How To Boost Brand Recognition Brand Awareness Metrics Sentiment Analysis Diagrams PDF. Our researchers have carefully researched and created these slides with all aspects taken into consideration. This is a completely customizable How To Boost Brand Recognition Brand Awareness Metrics Sentiment Analysis Diagrams PDF that is available for immediate downloading. Download now and make an impact on your audience. Highlight the attractive features available with our PPTs.

Supplier Performance And Order Cycle Time Monitoring Dashboard Introduction PDF
The following slide showcases a dashboard to supervise and manage procurement order cycle time an supplier performance. It includes key elements such as defect rate, on time supplies, supplier availability, lead time, supplier defect rate, defect type and delivery time. Do you have to make sure that everyone on your team knows about any specific topic I yes, then you should give Supplier Performance And Order Cycle Time Monitoring Dashboard Introduction PDF a try. Our experts have put a lot of knowledge and effort into creating this impeccable Supplier Performance And Order Cycle Time Monitoring Dashboard Introduction PDF. You can use this template for your upcoming presentations, as the slides are perfect to represent even the tiniest detail. You can download these templates from the Slidegeeks website and these are easy to edit. So grab these today.

Real Time Content Marketing Result Dashboard Ppt Infographic Template Example PDF
The following slide depicts real time content marketing KPI dashboard to monitor traffic flow and manage promotional efforts. It includes elements such as visitors by channel, conversion rate, search, direct, sessions, average time engaged etc. The Real Time Content Marketing Result Dashboard Ppt Infographic Template Example PDF is a compilation of the most recent design trends as a series of slides. It is suitable for any subject or industry presentation, containing attractive visuals and photo spots for businesses to clearly express their messages. This template contains a variety of slides for the user to input data, such as structures to contrast two elements, bullet points, and slides for written information. Slidegeeks is prepared to create an impression.
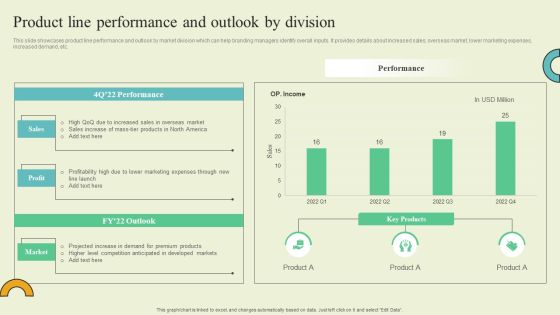
Extending Brand To Introduce New Commodities And Offerings Product Line Performance And Outlook Rules PDF
This slide showcases product line performance and outlook by market division which can help branding managers identify overall inputs. It provides details about increased sales, overseas market, lower marketing expenses, increased demand, etc. This modern and well arranged Extending Brand To Introduce New Commodities And Offerings Product Line Performance And Outlook Rules PDF provides lots of creative possibilities. It is very simple to customize and edit with the Powerpoint Software. Just drag and drop your pictures into the shapes. All facets of this template can be edited with Powerpoint no extra software is necessary. Add your own material, put your images in the places assigned for them, adjust the colors, and then you can show your slides to the world, with an animated slide included.

How Overall Brand Reputation Can Be Improved Ppt Styles Elements PDF
This slide provides information regarding overall brand reputation improvement by highlighting its rile in consumer loyalty, initiatives to manage brand reputation and statistics associated with it. Do you know about Slidesgeeks How Overall Brand Reputation Can Be Improved Ppt Styles Elements PDF These are perfect for delivering any kind od presentation. Using it, create PowerPoint presentations that communicate your ideas and engage audiences. Save time and effort by using our pre designed presentation templates that are perfect for a wide range of topic. Our vast selection of designs covers a range of styles, from creative to business, and are all highly customizable and easy to edit. Download as a PowerPoint template or use them as Google Slides themes.

KPI Metrics Dashboard Highlighting Employee Retention Rate Structure PDF
The purpose of this slide is to exhibit a key performance indicator KPI dashboard through which managers can analyze the monthly employee retention rate. The metrics covered in the slide are active employees, new candidates hired, internal, exit, employee turnover rate, etc. Do you have to make sure that everyone on your team knows about any specific topic I yes, then you should give KPI Metrics Dashboard Highlighting Employee Retention Rate Structure PDF a try. Our experts have put a lot of knowledge and effort into creating this impeccable KPI Metrics Dashboard Highlighting Employee Retention Rate Structure PDF. You can use this template for your upcoming presentations, as the slides are perfect to represent even the tiniest detail. You can download these templates from the Slidegeeks website and these are easy to edit. So grab these today.

Incorporating Real Time Marketing For Improved Consumer Real Time Content Marketing Result Dashboard Mockup PDF
The following slide depicts real time content marketing KPI dashboard to monitor traffic flow and manage promotional efforts. It includes elements such as visitors by channel, conversion rate, search, direct, sessions, average time engaged etc. This modern and well arranged Incorporating Real Time Marketing For Improved Consumer Real Time Content Marketing Result Dashboard Mockup PDF provides lots of creative possibilities. It is very simple to customize and edit with the Powerpoint Software. Just drag and drop your pictures into the shapes. All facets of this template can be edited with Powerpoint no extra software is necessary. Add your own material, put your images in the places assigned for them, adjust the colors, and then you can show your slides to the world, with an animated slide included.
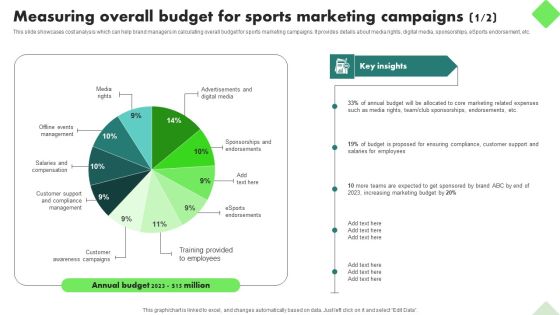
Fitness Product Promotion Campaigns Measuring Overall Budget For Sports Marketing Campaigns Pictures PDF
This slide showcases cost analysis which can help brand managers in calculating overall budget for sports marketing campaigns. It provides details about media rights, digital media, sponsorships, eSports endorsement, etc. Create an editable Fitness Product Promotion Campaigns Measuring Overall Budget For Sports Marketing Campaigns Pictures PDF that communicates your idea and engages your audience. Whether you are presenting a business or an educational presentation, pre-designed presentation templates help save time. Fitness Product Promotion Campaigns Measuring Overall Budget For Sports Marketing Campaigns Pictures PDF is highly customizable and very easy to edit, covering many different styles from creative to business presentations. Slidegeeks has creative team members who have crafted amazing templates. So, go and get them without any delay.
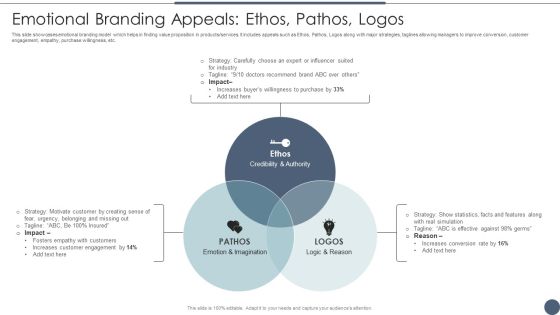
Emotional Branding Appeals Ethos Pathos Logos Utilizing Emotional And Rational Branding For Improved Consumer Information PDF
This slide showcases emotional branding model which helps in finding value proposition in products services. It includes appeals such as Ethos, Pathos, Logos along with major strategies, taglines allowing managers to improve conversion, customer engagement, empathy, purchase willingness, etc. Are you in need of a template that can accommodate all of your creative concepts This one is crafted professionally and can be altered to fit any style. Use it with Google Slides or PowerPoint. Include striking photographs, symbols, depictions, and other visuals. Fill, move around, or remove text boxes as desired. Test out color palettes and font mixtures. Edit and save your work, or work with colleagues. Download Emotional Branding Appeals Ethos Pathos Logos Utilizing Emotional And Rational Branding For Improved Consumer Information PDF and observe how to make your presentation outstanding. Give an impeccable presentation to your group and make your presentation unforgettable.

Our Team Ppt PowerPoint Presentation Portfolio File Formats
This is a our team ppt powerpoint presentation portfolio file formats. This is a one stage process. The stages in this process are team, work, communication, management, business.
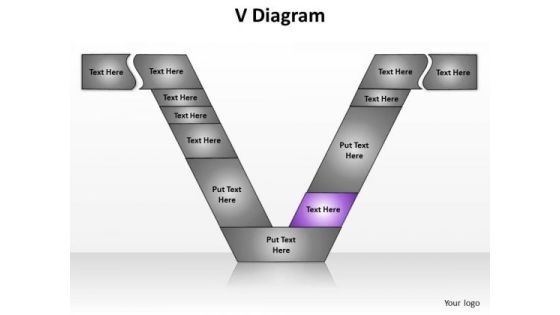
PowerPoint Designs Chart V Diagram Ppt Theme
PowerPoint Designs Chart V Diagram PPT Theme--Acceptance, Architecture,Chart,Cycle,Deployment, Design, Detail, Detailed, Development, Diagram, Engineering, Function, functional, Implement, Implementation, Management, model, Process, Project,Quality, Requirements, Software, Specification, steps, System, Test,
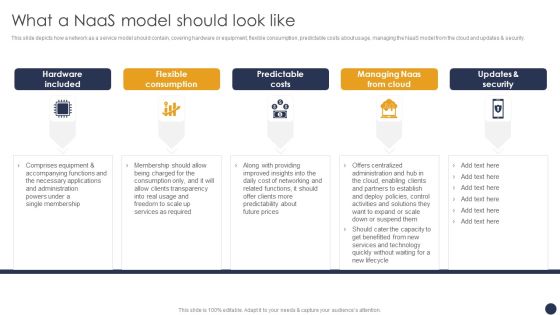
Integrating Naas Service Model What A Naas Model Should Look Like Ppt Inspiration Objects PDF
This slide depicts how a network as a service model should contain, covering hardware or equipment, flexible consumption, predictable costs about usage, managing the NaaS model from the cloud and updates and security. Whether you have daily or monthly meetings, a brilliant presentation is necessary. Integrating Naas Service Model What A Naas Model Should Look Like Ppt Inspiration Objects PDF can be your best option for delivering a presentation. Represent everything in detail using Integrating Naas Service Model What A Naas Model Should Look Like Ppt Inspiration Objects PDF and make yourself stand out in meetings. The template is versatile and follows a structure that will cater to your requirements. All the templates prepared by Slidegeeks are easy to download and edit. Our research experts have taken care of the corporate themes as well. So, give it a try and see the results.

Pie Chart Ppt PowerPoint Presentation Graphics
This is a pie chart ppt powerpoint presentation graphics. This is a six stage process. The stages in this process are business, marketing, finance, pie chart, management.

Pie Chart Ppt PowerPoint Presentation Example 2015
This is a pie chart ppt powerpoint presentation example 2015. This is a five stage process. The stages in this process are pie chart, percentage, business, marketing, management.

PowerPoint Design Chart V Diagram Ppt Slide
PowerPoint Design Chart V Diagram PPT Slide--Acceptance, Architecture,Chart,Cycle,Deployment, Design, Detail, Detailed, Development, Diagram, Engineering, Function, functional, Implement, Implementation, Management, model, Process, Project,Quality, Requirements, Software, Specification, steps, System, Test,
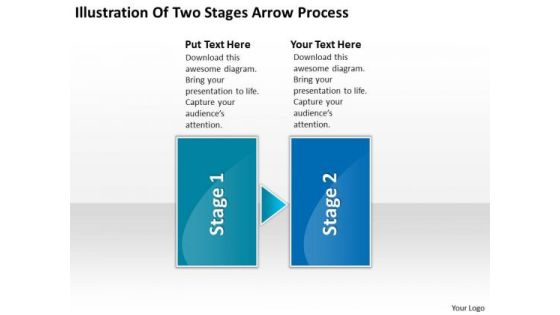
Illustration Of Two Stages Arrow Process Schematic PowerPoint Templates
We present our illustration of two stages arrow process schematic PowerPoint templates.Download and present our Arrows PowerPoint Templates because it illustrates the symbols of human growth. Download our Success PowerPoint Templates because you have the plans ready for them to absorb and understand. Download and present our Marketing PowerPoint Templates because customer satisfaction is a mantra of the marketplace. Building a loyal client base is an essential element of your business. Download our Advertising PowerPoint Templates because it Educates your team with your thoughts and logic. Download our Business PowerPoint Templates because you have selected your team man for man.Use these PowerPoint slides for presentations relating to Arrow, Chart, Concept, Connection, Diagram, Direction, Duplicate, Flow, Four, Manage, Method, Order, Phase, Presentation, Procedure, Process, React, Recycle, Refresh, Relate, Repeat, Repetition, Report, Review, Ring, Rotation, Round, Section, Sequence, Simple, Stage, Step, Strategy, Success. The prominent colors used in the PowerPoint template are Blue, Blue navy, Black. Customers tell us our illustration of two stages arrow process schematic PowerPoint templates are Awesome. The feedback we get is that our Diagram PowerPoint templates and PPT Slides are readymade to fit into any presentation structure. Professionals tell us our illustration of two stages arrow process schematic PowerPoint templates are Exuberant. People tell us our Concept PowerPoint templates and PPT Slides are Majestic. Customers tell us our illustration of two stages arrow process schematic PowerPoint templates are Clever. Professionals tell us our Flow PowerPoint templates and PPT Slides are Functional.
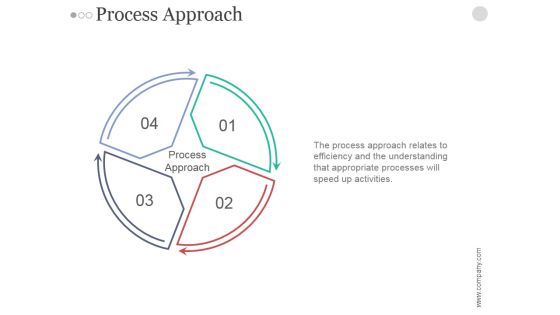
Process Approach Ppt PowerPoint Presentation Background Images
This is a process approach ppt powerpoint presentation background images. This is a four stage process. The Stages in this process are process approach, management, marketing, strategy, business.
Pyramid Showing Three Levels Of Business Structure Ppt PowerPoint Presentation Gallery Icons PDF
Persuade your audience using this pyramid showing three levels of business structure ppt powerpoint presentation gallery icons pdf. This PPT design covers three stages, thus making it a great tool to use. It also caters to a variety of topics including administrative or top level of management, supervisory or lower level of management, executive or middle level of management. Download this PPT design now to present a convincing pitch that not only emphasizes the topic but also showcases your presentation skills.

Line Chart Ppt PowerPoint Presentation Layout
This is a line chart ppt powerpoint presentation layout. This is a two stage process. The stages in this process are business, marketing, line chart, finance, management.

Area Chart Ppt PowerPoint Presentation Portfolio Graphics
This is a area chart ppt powerpoint presentation portfolio graphics. This is a two stage process. The stages in this process are business, finance, area chart, management, growth.

Bubble Chart Ppt PowerPoint Presentation Model Influencers
This is a bubble chart ppt powerpoint presentation model influencers. This is a three stage process. The stages in this process are product, bubble chart, business, marketing, management.
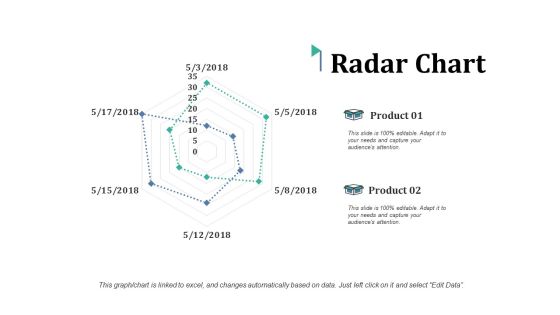
Radar Chart Ppt PowerPoint Presentation Pictures Smartart
This is a radar chart ppt powerpoint presentation pictures smartart. This is a two stage process. The stages in this process are radar chart, finance, marketing, analysis, management.

Radar Chart Ppt PowerPoint Presentation Professional Ideas
This is a radar chart ppt powerpoint presentation professional ideas. This is a two stage process. The stages in this process are product, percentage, management, marketing, chart.

Idea Development Process Star Diagram Powerpoint Ideas
This is a idea development process star diagram powerpoint ideas. This is a six stage process. The stages in this process are marketing, strategy, business, process, management.
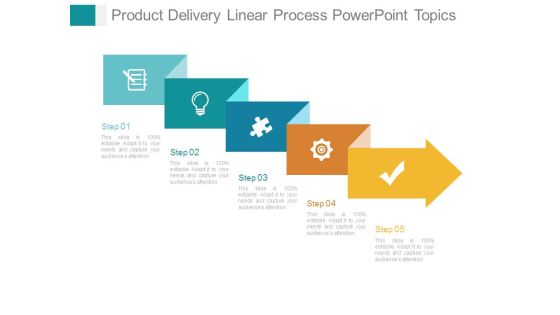
Product Delivery Linear Process Powerpoint Topics
This is a product delivery linear process powerpoint topics. This is a five stage process. The stages in this process are arrow, business, presentation, process, strategy, management.
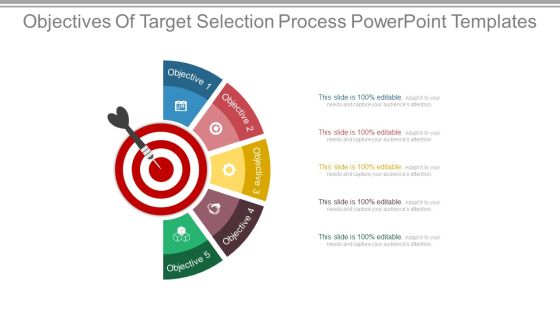
Objectives Of Target Selection Process Powerpoint Templates

Linear Process Business Analysis Powerpoint Presentation Examples
This is a linear process business analysis powerpoint presentation examples. This is a four stage process. The stages in this process are arrows, management, business, marketing, strategy.

Linear Process For Business Powerpoint Slide Inspiration
This is a linear process for business powerpoint slide inspiration. This is a five stage process. The stages in this process are business, strategy, success, management, marketing.
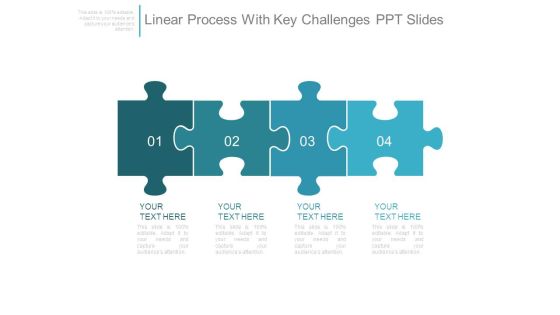
Linear Process With Key Challenges Ppt Slides
This is a linear process with key challenges ppt slides. This is a four stage process. The stages in this process are puzzle, business, management, strategy, presentation.
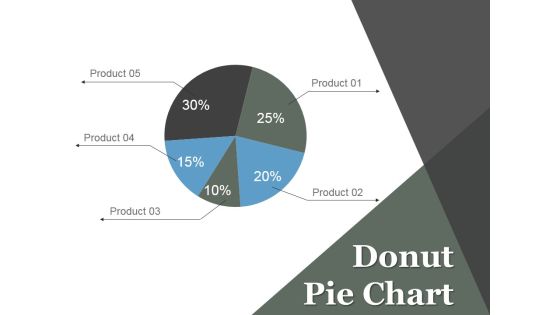
Donut Pie Chart Ppt PowerPoint Presentation Model
This is a donut pie chart ppt powerpoint presentation model. This is a five stage process. The stages in this process are finance, donut, marketing, product, chart, management.

Marketing Budget Allocation By Multiple Channels Formats PDF
Mentioned slide provides insights into expenses allocation by different marketing channels which can be used by managers to increase business return on investment. It includes key components such as strategy, total cost, marketing channels, and cost subtotal. Slidegeeks is one of the best resources for PowerPoint templates. You can download easily and regulate Marketing Budget Allocation By Multiple Channels Formats PDF for your personal presentations from our wonderful collection. A few clicks is all it takes to discover and get the most relevant and appropriate templates. Use our Templates to add a unique zing and appeal to your presentation and meetings. All the slides are easy to edit and you can use them even for advertisement purposes.
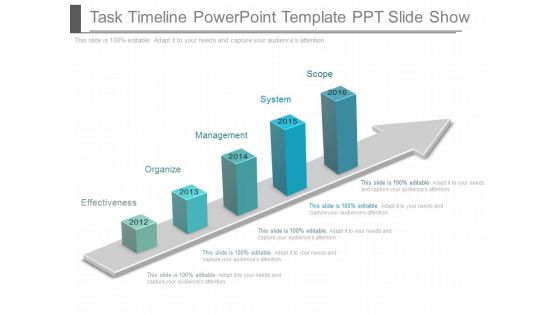
Task Timeline Powerpoint Template Ppt Slide Show
This is a task timeline powerpoint template ppt slide show. This is a five stage process. The stages in this process are effectiveness, organize, management, system, scope.

Business Process Roadmap Ppt PowerPoint Presentation Pictures Layout
This is a business process roadmap ppt powerpoint presentation pictures layout. This is a five stage process. The stages in this process are business, process, strategy, management, arrow.

Bar Chart Ppt PowerPoint Presentation Styles
This is a bar chart ppt powerpoint presentation styles. This is a nine stage process. The stages in this process are business, management, sales in percentage, growth.

Area Chart Ppt PowerPoint Presentation Summary Backgrounds
This is a area chart ppt powerpoint presentation summary backgrounds. This is a two stage process. The stages in this process are percentage, financial, business, management.

Line Chart Ppt PowerPoint Presentation File Sample
This is a line chart ppt powerpoint presentation file sample. This is a two stage process. The stages in this process are finance, marketing, management, investment, analysis.
Pie Chart Ppt PowerPoint Presentation Icon Clipart
This is a pie chart ppt powerpoint presentation icon clipart. This is a four stage process. The stages in this process are finance, marketing, management, investment, analysis.

Combo Chart Ppt PowerPoint Presentation Model Professional
This is a combo chart ppt powerpoint presentation model professional. This is a three stage process. The stages in this process are finance, marketing, management, investment, analysis.

Bubble Chart Ppt PowerPoint Presentation Styles Show
This is a bubble chart ppt powerpoint presentation styles show. This is a three stage process. The stages in this process are finance, marketing, management, investment, analysis.

Column Chart Ppt PowerPoint Presentation Pictures Aids
This is a column chart ppt powerpoint presentation pictures aids. This is a two stage process. The stages in this process are Percentage, Product, Marketing, Management.
 Home
Home