Stakeholder Charts

Donut Pie Chart Graph Ppt PowerPoint Presentation Ideas Guidelines
This is a donut pie chart graph ppt powerpoint presentation ideas guidelines. This is a three stage process. The stages in this process are finance, marketing, management, investment, analysis.
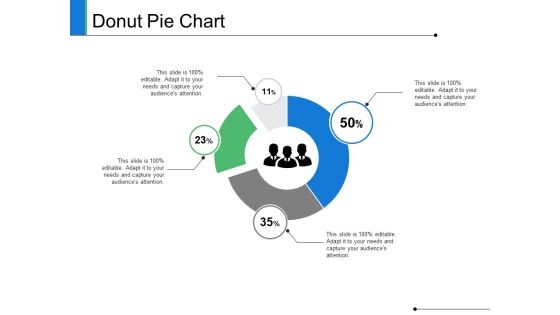
Donut Pie Chart Finance Ppt PowerPoint Presentation Styles Deck
This is a donut pie chart finance ppt powerpoint presentation styles deck. This is a four stage process. The stages in this process are finance, marketing, management, investment, analysis.
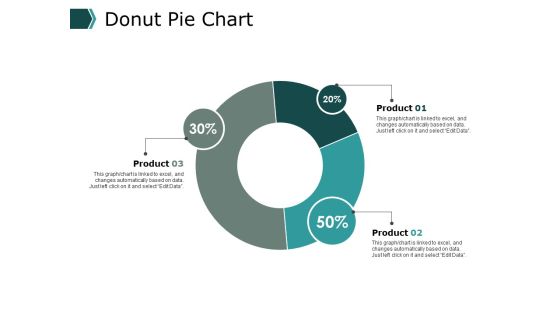
Donut Pie Chart Finance Ppt PowerPoint Presentation File Slide Download
This is a donut pie chart finance ppt powerpoint presentation file slide download. This is a three stage process. The stages in this process are finance, marketing, management, investment, analysis.

Donut Pie Chart Finance Ppt PowerPoint Presentation Styles Summary
This is a donut pie chart finance ppt powerpoint presentation styles summary. This is a three stage process. The stages in this process are finance, marketing, management, investment, analysis.

RACI Chart Showing Service Request Fulfillment Management Introduction PDF
This slide represents RACI chart for service request fulfillment process illustrating process flow such as new service request, reviewing and updating request, user authentication etc.Pitch your topic with ease and precision using this RACI Chart Showing Service Request Fulfillment Management Introduction PDF This layout presents information on Incident Management, Request Fulfilment, Problem Management It is also available for immediate download and adjustment. So, changes can be made in the color, design, graphics or any other component to create a unique layout.

Circular Arrow Chart With Business Icons Powerpoint Slides
Graphics of circular arrow chart with icons have been displayed in this business slide. This business diagram helps to exhibit strategy analysis and management. Use this PowerPoint template to visually support your content.

Aviation Services Management Gantt Chart One Pager Sample Example Document
Presenting you an exemplary Aviation Services Management Gantt Chart One Pager Sample Example Document Our one-pager comprises all the must have essentials of an inclusive document. You can edit it with ease, as its layout is completely editable. With such freedom, you can tweak its design and other elements to your requirements. Download this Aviation Services Management Gantt Chart One Pager Sample Example Document brilliant piece now.
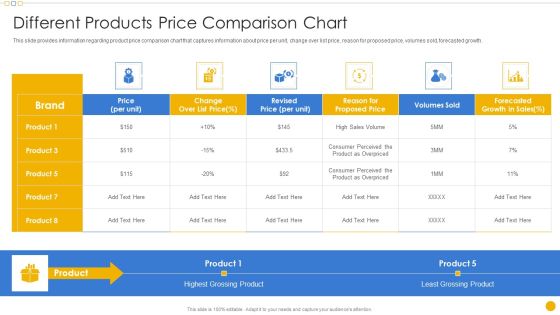
Sales Management Playbook Different Products Price Comparison Chart Professional PDF
This slide provides information regarding ideal customer profile that defines perfect customer fit to realize optimum value from product or solution rendered by identifying organizational concerns, pain points, value proposition, etc.Deliver and pitch your topic in the best possible manner with this Sales Management Playbook Different Products Price Comparison Chart Professional PDF Use them to share invaluable insights on Different Products Price Comparison Chart and impress your audience. This template can be altered and modified as per your expectations. So, grab it now.
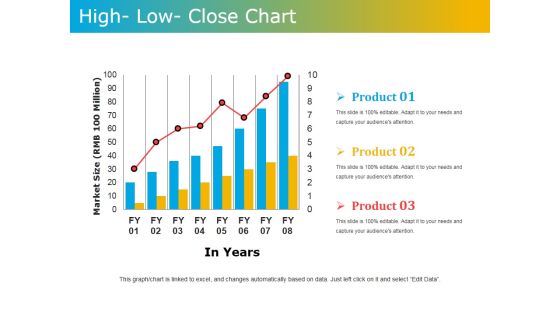
High Low Close Chart Ppt PowerPoint Presentation Model Graphics Tutorials
This is a high low close chart ppt powerpoint presentation model graphics tutorials. This is a three stage process. The stages in this process are market size, in years, product.

Circular Chart Showing Process Approach Ppt PowerPoint Presentation Backgrounds
This is a circular chart showing process approach ppt powerpoint presentation backgrounds. This is a four stage process. The stages in this process are process approach, business, marketing, success, strategy.

Team Target And Achievements Scatter Chart Ppt PowerPoint Presentation Example
This is a team target and achievements scatter chart ppt powerpoint presentation example. This is a three stage process. The stages in this process are overall territory performance, task done, estimation done, complexity done.

Competitive Analysis Template 6 Scatter Chart Ppt PowerPoint Presentation Shapes
This is a competitive analysis template 6 scatter chart ppt powerpoint presentation shapes. This is a one stage process. The stages in this process are users interface, data import, example, pricing, support update, tutorials, easy to use.

Competitive Analysis Template 8 Matrix Chart Ppt PowerPoint Presentation Templates
This is a competitive analysis template 8 matrix chart ppt powerpoint presentation templates. This is a six stage process. The stages in this process are our business, product quality, product fidelity, after sales service, customer service, price, shipping speed, competitor.

Competitive Analysis Matrix Chart Ppt PowerPoint Presentation Gallery
This is a competitive analysis matrix chart ppt powerpoint presentation gallery. This is a seven stage process. The stages in this process are our business, product quality, product fidelity, after sales service, customer service, price, shipping speed.

Data Collection And Analysis Control Chart Ppt PowerPoint Presentation Visuals
This is a data collection and analysis control chart ppt powerpoint presentation visuals. This is a ten stage process. The stages in this process are upper limit, centerline, lower limit, plotted points.
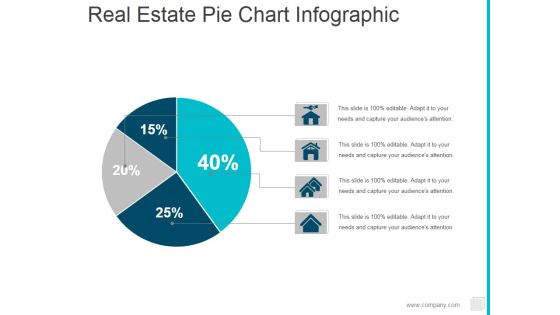
Real Estate Pie Chart Infographic Ppt PowerPoint Presentation Ideas Shapes
This is a real estate pie chart infographic ppt powerpoint presentation ideas shapes. This is a four stage process. The stages in this process are pie, finance, marketing, percentage.

Basic Gap Analysis Chart Ppt PowerPoint Presentation Pictures Design Ideas
This is a basic gap analysis chart ppt powerpoint presentation pictures design ideas. This is a five stage process. The stages in this process are business, finance, marketing, analysis, investment.
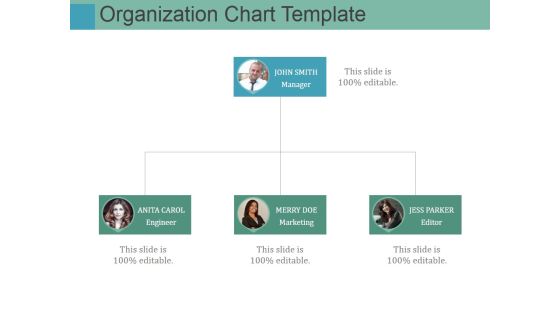
Organization Chart Template Ppt PowerPoint Presentation Infographic Template Styles
This is a organization chart template ppt powerpoint presentation infographic template styles. This is a four stage process. The stages in this process are john smith, anita carol, merry doe, jess parker.

Line Chart Ppt Powerpoint Presentation Infographic Template Format
This is a line chart ppt powerpoint presentation infographic template format. This is a two stage process. The stages in this process are jan, feb, mar, apr, may, financial.

Scatter Bubble Chart Ppt PowerPoint Presentation Professional Model
This is a scatter bubble chart ppt powerpoint presentation professional model. This is a six stage process. The stages in this process are sales in profit, financial year, growth, business, marketing, strategy.

Donut Pie Chart Ppt PowerPoint Presentation Inspiration Background Image
This is a donut pie chart ppt powerpoint presentation inspiration background image. This is a three stage process. The stages in this process are product, percentage, business, marketing, process.

Pie Chart Finance Ppt PowerPoint Presentation Styles Graphics Template
This is a pie chart finance ppt powerpoint presentation styles graphics template. This is a three stage process. The stages in this process are financial, minimum, medium, maximum, marketing.

Combo Chart Graph Ppt PowerPoint Presentation Gallery Designs Download
This is a combo chart graph ppt powerpoint presentation gallery designs download. This is a three stage process. The stages in this process are finance, marketing, analysis, investment, million.
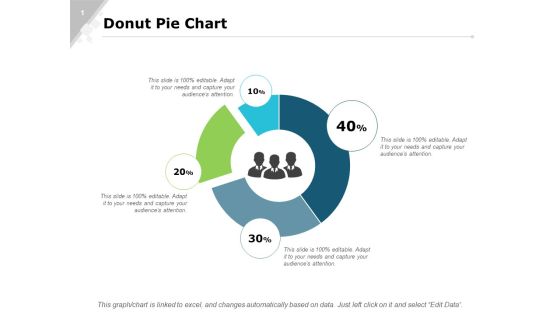
Donut Pie Chart Bar Ppt PowerPoint Presentation Infographics Slide Portrait
This is a donut pie chart bar ppt powerpoint presentation infographics slide portrait. This is a four stage process. The stages in this process are finance, marketing, analysis, investment, million.

Area Chart Graph Ppt PowerPoint Presentation Professional Format Ideas
This is a column chart graph ppt powerpoint presentation slides file formats. This is a stage three process. The stages in this process are finance, marketing, analysis, investment, million.

Cycle Chart Of Mutual Funds Sample Diagram Ppt Images
This is a cycle chart of mutual funds sample diagram ppt images. This is a five stage process. The stages in this process are reinvestment, returns, investors, fund manager, financial securities.

Four Employees Timeline Chart With Years Powerpoint Slides
This PowerPoint template has been designed with graphics of timeline with team pictures. You may download this timeline diagram slide to display team planning and management steps. Chart the course you intend to take with this slide.

Financial Planning Steps Infographic Chart Ppt Samples Download
This is a financial planning steps infographic chart ppt samples download. This is a five stage process. The stages in this process are investments, retirement, estate planning, risk management, cash flow.

Activity Planning Chart Ppt PowerPoint Presentation Visual Aids Model
This is a activity planning chart ppt powerpoint presentation visual aids model. This is a six stage process. The stages in this process are activities, business, management, table, planning.

Circular Chart Showing Business Plan Ppt PowerPoint Presentation Shapes
This is a circular chart showing business plan ppt powerpoint presentation shapes. This is a seven stage process. The stages in this process are business, marketing, arrows, process, management.
Six Steps Circular Chart With Icons Powerpoint Slides
This PowerPoint template has been designed with six steps circular chart with icons. This PPT slide may be used to display business and management functions. Download this slide to build unique presentation.

Cost Benefit Analysis Chart With Icons Powerpoint Layout
This is a cost benefit analysis chart with icons powerpoint layout. This is a two stage process. The stages in this process are balance scale, compare, business, marketing, management.

Combo Chart Marketing Analysis Ppt Powerpoint Presentation Pictures Icons
This is a combo chart marketing analysis ppt powerpoint presentation pictures icons. This is a three stage process. The stages in this process are finance, marketing, management, investment, analysis.

Clustered Bar Chart Finance Ppt Powerpoint Presentation Icon Graphics Template
This is a clustered bar chart finance ppt powerpoint presentation icon graphics template. This is a four stage process. The stages in this process are finance, marketing, management, investment, analysis.
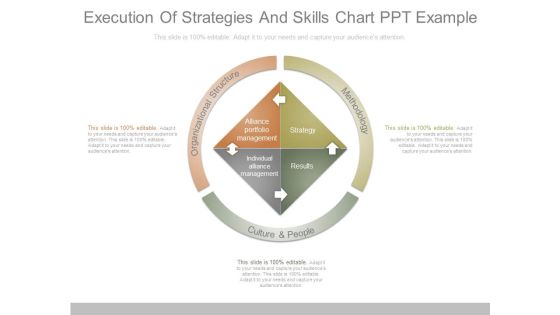
Execution Of Strategies And Skills Chart Ppt Example
This is a execution of strategies and skills chart ppt example. This is a three stage process. The stages in this process are methodology, culture and people, organizational structure, alliance portfolio management, strategy, individual alliance management, results.

Small Business Structure Chart Example Powerpoint Slide Background Image
This is a small business structure chart example powerpoint slide background image. This is a six stage process. The stages in this process are financial manager, sales, distributions, finance, operations, general manager.

Bar Chart Ppt PowerPoint Presentation Infographic Template Skills
This is a bar chart ppt powerpoint presentation infographic template skills. This is a nine stage process. The stages in this process are sales in percentage, finance, business, marketing, strategy, success.

Departments And Team Hierarchy Chart Ppt PowerPoint Presentation Styles
This is a departments and team hierarchy chart ppt powerpoint presentation styles. This is a three stage process. The stages in this process are director, financial advisor, marketing head, manager, web designer, graphic designer.

Business Card Marketing Workflow Chart Ppt Portfolio Aids PDF
This slide showcases the flowchart of business card request for corporate marketing, this flowchart covers request for business card by requester to card approval. Deliver an awe-inspiring pitch with this creative business card marketing workflow chart ppt portfolio aids pdf bundle. Topics like business card marketing workflow chart can be discussed with this completely editable template. It is available for immediate download depending on the needs and requirements of the user.
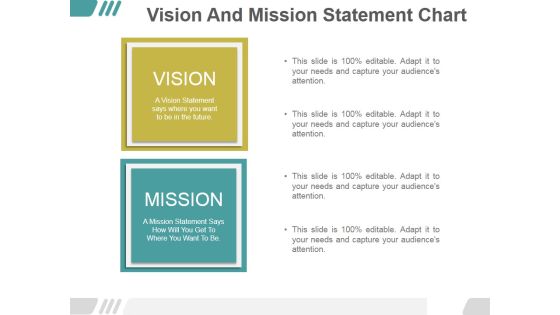
Vision And Mission Statement Chart Ppt PowerPoint Presentation Samples
This is a vision and mission statement chart ppt powerpoint presentation samples. This is a two stage process. The stages in this process are vision, business, marketing, mission, management.
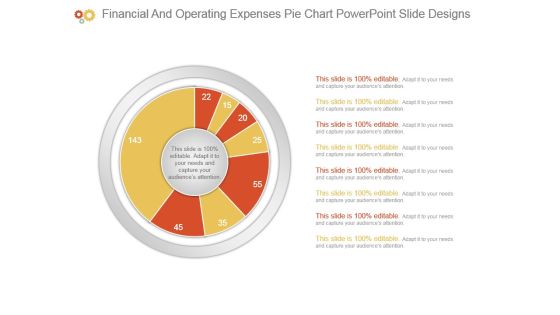
Financial And Operating Expenses Pie Chart Powerpoint Slide Designs
This is a financial and operating expenses pie chart powerpoint slide designs. This is a eight stage process. The stages in this process are business, diagram, marketing, management, presentation.
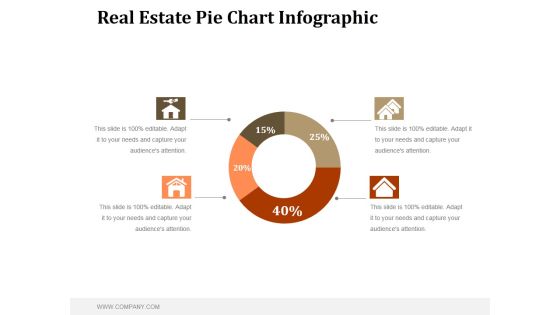
Real Estate Pie Chart Infographic Ppt PowerPoint Presentation Shapes
This is a real estate pie chart infographic ppt powerpoint presentation shapes. This is a four stage process. The stages in this process are business, marketing, management, finance, planning.

data collection and analysis flow chart ppt powerpoint presentation microsoft
This is a data collection and analysis flow chart ppt powerpoint presentation microsoft. This is a nine stage process. The stages in this process are business, planning, marketing, strategy, management.

Email Marketing Performance Chart Ppt Powerpoint Presentation Pictures Show
This is a email marketing performance chart ppt powerpoint presentation pictures show. This is a nine stage process. The stages in this process are finance, planning, marketing, business, management, strategy.
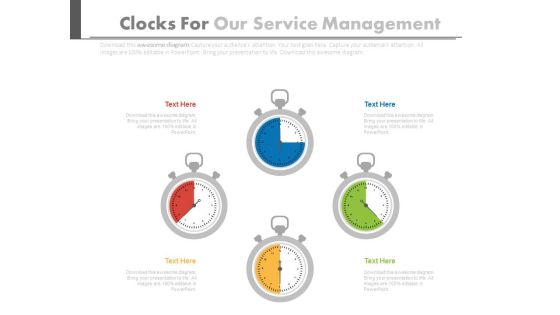
Four Stopwatches In Pie Chart Style Powerpoint Slides
This PPT slide has been designed with graphics of four stop watches in pie chart style. You may sue this PowerPoint template for time management. This dashboard slide may useful for multilevel status report creation and approval process.

Business Development Skills Business Development Skills Chart Slides
This is a business development skills business development skills chart slides. This is a eleven stage process. The stages in this process are entrepreneur, strategies, commercial, project, leadership, marketing, international, innovation, gestation, management, developer.

Strategy Development Fro Effective Market Chart Powerpoint Guide
This is a strategy development fro effective market chart powerpoint guide. This is a six stage process. The stages in this process are customers, leading distributors, other competitors, suppliers to the target, local provincial governments, associations institutions, target company management.
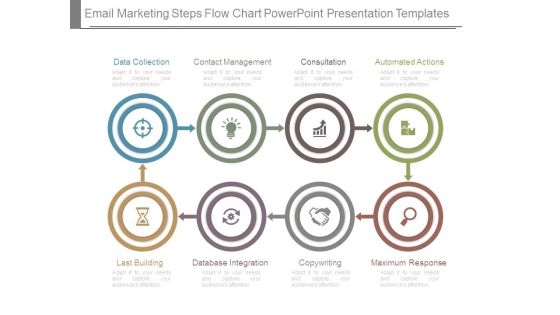
Email Marketing Steps Flow Chart Powerpoint Presentation Templates
This is a email marketing steps flow chart powerpoint presentation templates. This is a eight stage process. The stages in this process are data collection, contact management, consultation, automated actions, last building, database integration, copywriting, maximum response.
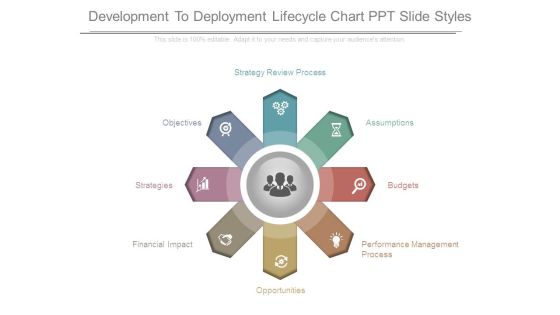
Development To Deployment Lifecycle Chart Ppt Slide Styles
This is a development to deployment lifecycle chart ppt slide styles. This is a eight stage process. The stages in this process are performance management process, opportunities, financial impact, strategies, objectives, strategy review process, assumptions, budgets.
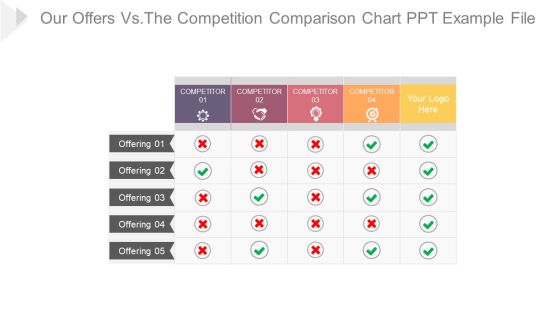
Our Offers Vs The Competition Comparison Chart Ppt Example File
This is a our offers vs the competition comparison chart ppt example file. This is a five stage process. The stages in this process are compare, table, management, business, strategy.

Column Chart Ppt PowerPoint Presentation Infographic Template Graphic Images
This is a column chart ppt powerpoint presentation infographic template graphic images. This is a nine stage process. The stages in this process are business, marketing, growth, product, management.
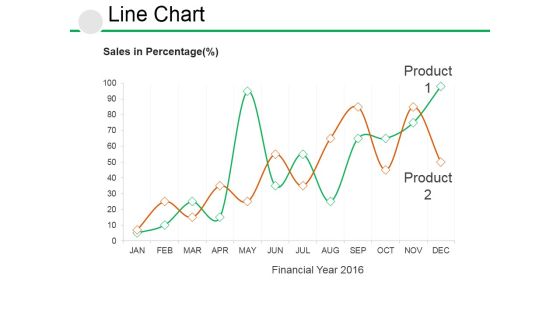
Line Chart Ppt PowerPoint Presentation Visual Aids Example File
This is a line chart ppt powerpoint presentation visual aids example file. This is a two stage process. The stages in this process are business, growth, strategy, analysis, management.
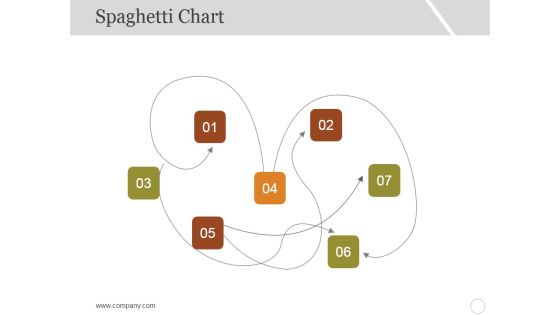
Spaghetti Chart Template 1 Ppt PowerPoint Presentation Slides Graphics Example
This is a spaghetti chart template 1 ppt powerpoint presentation slides graphics example. This is a seven stage process. The stages in this process are business, marketing, management, numbering.
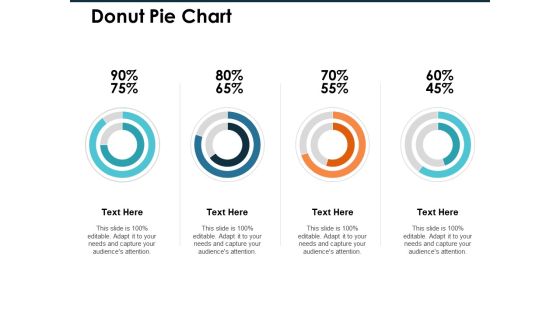
Donut Pie Chart Ppt PowerPoint Presentation Infographic Template Professional
This is a donut pie chart ppt powerpoint presentation infographic template professional. This is a four stage process. The stages in this process are finance, marketing, management, investment, analysis.
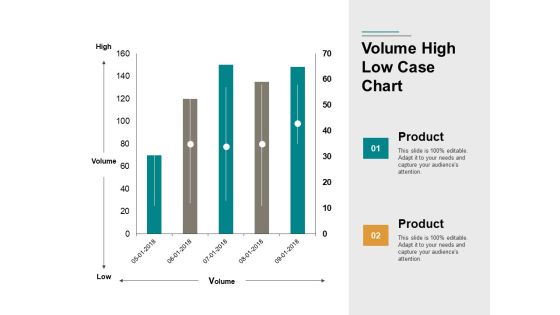
Volume High Low Case Chart Ppt PowerPoint Presentation Portfolio Images
This is a volume high low case chart ppt powerpoint presentation portfolio images. This is a two stage process. The stages in this process are finance, business, marketing, management.

Bubble Chart Finance Ppt PowerPoint Presentation File Master Slide
This is a bubble chart finance ppt powerpoint presentation file master slide. This is a three stage process. The stages in this process are finance, marketing, management, investment, analysis.

Volume High Low Close Chart Ppt PowerPoint Presentation Pictures Objects
This is a volume high low close chart ppt powerpoint presentation pictures objects. This is a one stage process. The stages in this process are finance, marketing, management, investment, analysis.
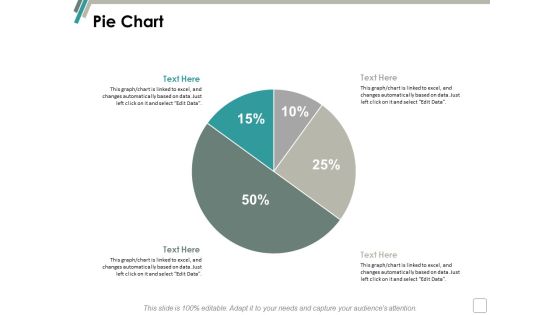
Pie Chart Finance Marketing Ppt Powerpoint Presentation Infographics Background
This is a pie chart finance marketing ppt powerpoint presentation infographics background. This is a two stage process. The stages in this process are finance, marketing, management, investment, analysis.

Volume High Low Close Chart Ppt Powerpoint Presentation Slides Images
This is a volume high low close chart ppt powerpoint presentation slides images. This is a five stage process. The stages in this process are finance, marketing, management, investment, analysis.

Area Chart Finance Marketing Ppt Powerpoint Presentation Gallery Slides
This is a area chart finance marketing ppt powerpoint presentation gallery slides. This is a three stage process. The stages in this process are finance, marketing, management, investment, analysis.
 Home
Home