AI PPT Maker
Templates
PPT Bundles
Design Services
Business PPTs
Business Plan
Management
Strategy
Introduction PPT
Roadmap
Self Introduction
Timelines
Process
Marketing
Agenda
Technology
Medical
Startup Business Plan
Cyber Security
Dashboards
SWOT
Proposals
Education
Pitch Deck
Digital Marketing
KPIs
Project Management
Product Management
Artificial Intelligence
Target Market
Communication
Supply Chain
Google Slides
Research Services
 One Pagers
All Categories
-
Home
- Customer Favorites
- Solution
Solution
QA Modification For Product Quality Development And Consumer Satisfaction Positive Outcomes And Results Icons PDF
This slide shows some Positive Outcomes and Results of Effective QA Transformation in long term such as Consistent Test Effectiveness, Strong Governance Framework Structure, Reduction in Test Preparation Time, Automation of System Test Execution, Large Savings through Faster Global Delivery etc. Presenting qa modification for product quality development and consumer satisfaction positive outcomes and results icons pdf to provide visual cues and insights. Share and navigate important information on nine stages that need your due attention. This template can be used to pitch topics like framework, effectiveness, execution, optimization, global. In addtion, this PPT design contains high resolution images, graphics, etc, that are easily editable and available for immediate download.
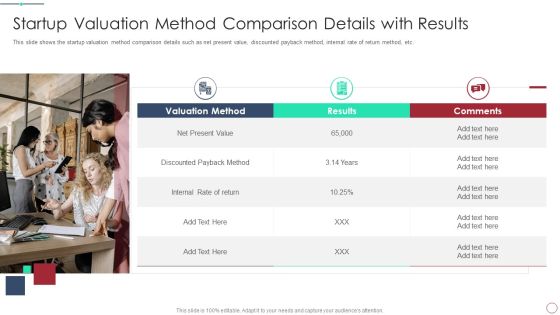
Initial Phase Investor Value For New Business Startup Valuation Method Comparison Details With Results Template PDF
This slide shows the startup failure rate with funding sequence, failure to raise next round, failure to exit, etc. Presenting initial phase investor value for new business startup valuation method comparison details with results template pdf to provide visual cues and insights. Share and navigate important information on three stages that need your due attention. This template can be used to pitch topics like startup valuation method comparison details with results. In addtion, this PPT design contains high resolution images, graphics, etc, that are easily editable and available for immediate download.

Artificial Intelligence Transformation Playbook Stage One Questionnaire Results And Key Considerations Designs PDF
Mentioned slide displays the results of assessment questionnaire along with key considerations about the AI technology. It also showcases information about the capabilities of AI approach. Presenting artificial intelligence transformation playbook stage one questionnaire results and key considerations designs pdf to provide visual cues and insights. Share and navigate important information on six stages that need your due attention. This template can be used to pitch topics like incremental gains, cloud first and shared services, enhanced user experience, minimal risk. In addtion, this PPT design contains high resolution images, graphics, etc, that are easily editable and available for immediate download.

AI Playbook For Business Stage One Questionnaire Results And Key Considerations Diagrams PDF
Mentioned slide displays the results of assessment questionnaire along with key considerations about the AI technology. It also showcases information about the capabilities of AI approach. Presenting AI Playbook For Business Stage One Questionnaire Results And Key Considerations Diagrams PDF to provide visual cues and insights. Share and navigate important information on six stages that need your due attention. This template can be used to pitch topics like Incremental Gains, Key Considerations, Enhanced User Experience. In addtion, this PPT design contains high resolution images, graphics, etc, that are easily editable and available for immediate download.
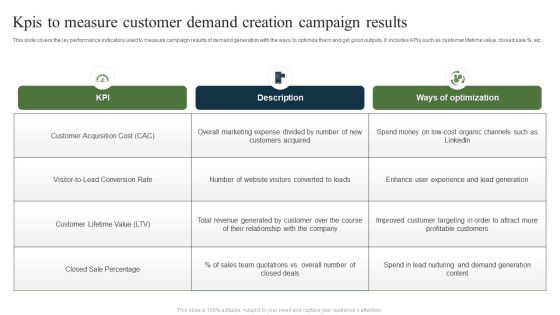
Kpis To Measure Customer Demand Creation Campaign Results Ppt Ideas Portrait PDF
This slide covers the ley performance indicators used to measure campaign results of demand generation with the ways to optimize them and get good outputs. It includes KPIs such as customer lifetime value, closed sale percent, etc. Pitch your topic with ease and precision using this Kpis To Measure Customer Demand Creation Campaign Results Ppt Ideas Portrait PDF. This layout presents information on KPI, Description, Ways Optimization, Customer Acquisition Cost. It is also available for immediate download and adjustment. So, changes can be made in the color, design, graphics or any other component to create a unique layout.

Project Management Under Supervision Product Quality Register With Scope And Result Topics PDF
In this slide, we are tabulating multiple activities that must be performed to ensure highest product quality. Presenting project management under supervision product quality register with scope and result topics pdf to provide visual cues and insights. Share and navigate important information on eleven stages that need your due attention. This template can be used to pitch topics like product id, title, method, reviewer, planned date, actual review date, actual approval date, scope. In addtion, this PPT design contains high resolution images, graphics, etc, that are easily editable and available for immediate download.

Application Patient Satisfaction Tactics Enhance Clinical Results Major Reasons For Low Patient Satisfaction Download PDF
This slide shows major reasons for Low patient Satisfaction in a hospital or medical facility such as difficulty in appointment scheduling, long waiting times, inability to access health information, high treatment costs, poor calling experience etc. Presenting application patient satisfaction tactics enhance clinical results major reasons for low patient satisfaction download pdf to provide visual cues and insights. Share and navigate important information on six stages that need your due attention. This template can be used to pitch topics like appointments, information, treatment costs, experience. In addtion, this PPT design contains high resolution images, graphics, etc, that are easily editable and available for immediate download.

Application Patient Satisfaction Tactics Enhance Clinical Results Tools And Resources To Increase Introduction PDF
This slide shows the various tools and resources that can be used by the medical facility hospital in order to increase and boost the patient satisfaction along with their relative implementation cost. Presenting application patient satisfaction tactics enhance clinical results tools and resources to increase introduction pdf to provide visual cues and insights. Share and navigate important information on six stages that need your due attention. This template can be used to pitch topics like patient feedback system, patient portals, complete team evaluation, healthcare analytics. In addtion, this PPT design contains high resolution images, graphics, etc, that are easily editable and available for immediate download.

Consumer Journey Mapping Techniques Website Performance Audit And Review Results Icons PDF
This slide covers the website conversate rate based on page type, page view, conversion rate, and average session duration with a key takeaway section. Presenting Consumer Journey Mapping Techniques Website Performance Audit And Review Results Icons PDF to provide visual cues and insights. Share and navigate important information on four stages that need your due attention. This template can be used to pitch topics like Average Conversion Rate, Global Conversion Rate, Pricing Page. In addtion, this PPT design contains high resolution images, graphics, etc, that are easily editable and available for immediate download.

Optimizing E Business Promotion Plan Campaign Result By Key Channels Microsoft PDF
This slide shows the campaign performance on the basis of key channels used such as social, search, website, etc. with channel description, objectives and metrics. This is a Optimizing E Business Promotion Plan Campaign Result By Key Channels Microsoft PDF template with various stages. Focus and dispense information on one stage using this creative set, that comes with editable features. It contains large content boxes to add your information on topics like Channel Objectives, Campaign Performance, Percentage Of Audience. You can also showcase facts, figures, and other relevant content using this PPT layout. Grab it now.

Implementing Ecommerce Marketing Services Plan Campaign Result By Key Channels Elements PDF
This slide shows the campaign performance on the basis of key channels used such as social, search, website, etc. with channel description, objectives and metrics. Want to ace your presentation in front of a live audience Our Implementing Ecommerce Marketing Services Plan Campaign Result By Key Channels Elements PDF can help you do that by engaging all the users towards you. Slidegeeks experts have put their efforts and expertise into creating these impeccable powerpoint presentations so that you can communicate your ideas clearly. Moreover, all the templates are customizable, and easy to edit and downloadable. Use these for both personal and commercial use.

Optimizing Digital Channels To Enhance Marketing Strategy Campaign Result By Key Channels Demonstration PDF
This slide shows the campaign performance on the basis of key channels used such as social, search, website, etc. with channel description, objectives and metrics. Make sure to capture your audiences attention in your business displays with our gratis customizable Optimizing Digital Channels To Enhance Marketing Strategy Campaign Result By Key Channels Demonstration PDF. These are great for business strategies, office conferences, capital raising or task suggestions. If you desire to acquire more customers for your tech business and ensure they stay satisfied, create your own sales presentation with these plain slides.

Management Team Interpretation Sales Strategy Timeline Ppt Example
This is a management team interpretation sales strategy timeline ppt example. This is a three stage process. The stages in this process are business, arrows, marketing.

Business Interpreters Ppt PowerPoint Presentation Gallery Files Cpb
This is a business interpreters ppt powerpoint presentation gallery files cpb. This is a three stage process. The stages in this process are business, management, marketing.

Business Process After Restructuring The Organization Ppt PowerPoint Presentation Gallery Slide Download PDF
This slide covers the business process after implementing the organizational restructuring program starting from product definition to warranty process including various customer touch points. Deliver an awe inspiring pitch with this creative Business Process After Restructuring The Organization Ppt PowerPoint Presentation Gallery Slide Download PDF bundle. Topics like Product Definition, Bidding Process, Purchasing Process can be discussed with this completely editable template. It is available for immediate download depending on the needs and requirements of the user.

Business Framework Model Faq Session To Interpret Things Consulting Diagram
Analyze Ailments On Our Business Framework Model Faq Session To Interpret Things Consulting Diagram Powerpoint Templates. Bring Out The Thinking Doctor In You. Dock Your Thoughts With Our Business Framework Model Faq Session To Interpret Things Consulting Diagram Powerpoint Templates. They Will Launch Them Into Orbit.

Interpretation Data Analysis Ppt PowerPoint Presentation Portfolio Display Cpb
Presenting this set of slides with name interpretation data analysis ppt powerpoint presentation portfolio display cpb. The topics discussed in these slides are interpretation data analysis. This is a completely editable PowerPoint presentation and is available for immediate download. Download now and impress your audience.

Big Data Interpretation And Evaluation Management Demonstration PDF
Presenting Big Data Interpretation And Evaluation Management Demonstration PDF to dispense important information. This template comprises four stages. It also presents valuable insights into the topics including Evaluation Management, Big Data Interpretation. This is a completely customizable PowerPoint theme that can be put to use immediately. So, download it and address the topic impactfully.
Data And Interpretation Skills Evaluation Icon Demonstration PDF
Persuade your audience using this Data And Interpretation Skills Evaluation Icon Demonstration PDF. This PPT design covers four stages, thus making it a great tool to use. It also caters to a variety of topics including Interpretation, Skills Evaluation. Download this PPT design now to present a convincing pitch that not only emphasizes the topic but also showcases your presentation skills.
Digital Marketing Data Interpretation And Evaluation Icon Clipart PDF
Presenting Digital Marketing Data Interpretation And Evaluation Icon Clipart PDF to dispense important information. This template comprises four stages. It also presents valuable insights into the topics including Digital Marketing, Data Interpretation, Evaluation Icon. This is a completely customizable PowerPoint theme that can be put to use immediately. So, download it and address the topic impactfully.

Research Analyst Analyzing Information To Interpret Market Conditions Infographics PDF
Presenting Research Analyst Analyzing Information To Interpret Market Conditions Infographics PDF to dispense important information. This template comprises three stages. It also presents valuable insights into the topics including Research Analyzing, Information, Interpret Market This is a completely customizable PowerPoint theme that can be put to use immediately. So, download it and address the topic impactfully.
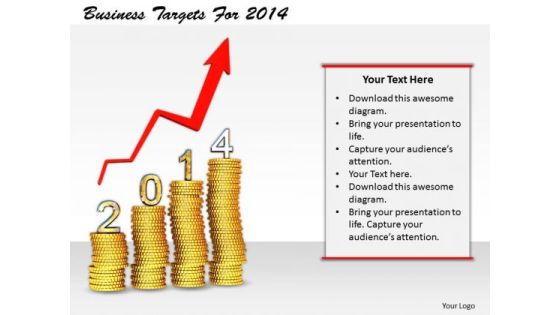
Stock Photo Business Management Strategy Targets For 2014 Image
Anticipate Contingencies With Our stock photo business management strategy targets for 2014 image. Draw Up Foolproof Answers For Any Eventuality. With Our arrows You Will Land On Your Feet. Your Efforts Will Achieve Favorable Results.

Stock Photo Developing Business Strategy Scooter Toy For Kids Clipart
Anticipate contingencies with our stock photo developing business strategy scooter toy for kids clipart. Draw up foolproof answers for any eventuality. With our transportation you will land on your feet. Your efforts will achieve favourable results.
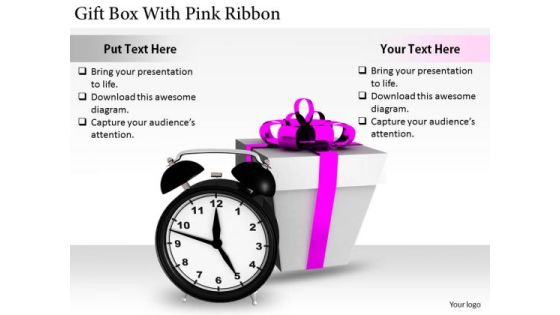
Stock Photo International Marketing Concepts Gift Box With Pink Ribbon Stock Photo Business Photos
Anticipate Contingencies With Our stock photo international marketing concepts gift box with pink ribbon stock photo business photos. Draw Up Foolproof Answers For Any Eventuality. With Our Boxes You Will Land On Your Feet. Your Efforts Will Achieve Favorable Results.

Strategies Employing PPC Advertising Tracking A B Testing Results For PPC Ads Template PDF
This slide provides glimpse about tracking A or B tests on different pay per click metrics that help the businesses to select the right hypothesis for increasing large audiences. It includes platform, description, owner, rationale, etc. Whether you have daily or monthly meetings, a brilliant presentation is necessary. Strategies Employing PPC Advertising Tracking A B Testing Results For PPC Ads Template PDF can be your best option for delivering a presentation. Represent everything in detail using Strategies Employing PPC Advertising Tracking A B Testing Results For PPC Ads Template PDF and make yourself stand out in meetings. The template is versatile and follows a structure that will cater to your requirements. All the templates prepared by Slidegeeks are easy to download and edit. Our research experts have taken care of the corporate themes as well. So, give it a try and see the results.
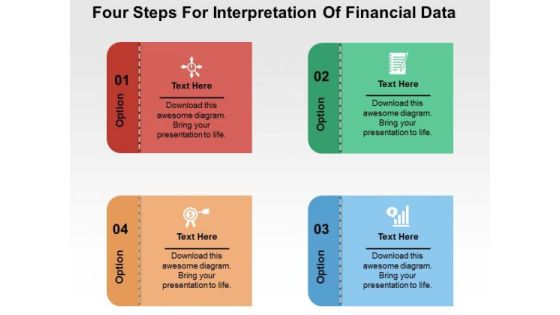
Four Steps For Interpretation Of Financial Data PowerPoint Templates
Our PPT above slide displays graphics of four text boxes with icons. This template may be used to depict interpretation of financial data. You can present your opinions using this impressive slide.

Data Interpretation Percentage Analysis Ppt Powerpoint Presentation Summary Icon
This is a data interpretation percentage analysis ppt powerpoint presentation summary icon. This is a six stage process. The stages in this process are data presentation, content presentation, information presentation.
Human Behaviours Trends Interpretation Ppt PowerPoint Presentation Icon Microsoft
This is a human behaviours trends interpretation ppt powerpoint presentation icon microsoft. This is a five stage process. The stages in this process are customer experience, customer insight, consumer insight.

Ppt Circular Interpretation Of 9 Steps Involved Procedure PowerPoint Templates
PPT circular interpretation of 9 steps involved procedure PowerPoint Templates-Use this Circular flow diagram to describe key strategic issues and information flows and internal communication.-PPT circular interpretation of 9 steps involved procedure PowerPoint Templates-Affiliate, Affiliation, Arrow, Business, Chart, Circular, Commerce, Concept, Contribution, Cycle, Development, Diagram, Idea, Informative, Internet, Join, Making, Manage, Management, Market, Marketing, Member, Money, Network, Partner, Partnership, Pay, Paying, Performance, Plans, Process, Productive, Productivity, Profit, Profitable, Project, Recruit, Recruiting, Recruitment, Refer, Referral, Referring, Revenue, Sales, Socialize, Steps, Strategy

Ppt Circular Interpretation Of 12 Steps Involved Procedure PowerPoint Templates
PPT circular interpretation of 12 steps involved procedure PowerPoint Templates-Use this Circular flow diagram to describe key strategic issues and information flows and internal communication.-PPT circular interpretation of 12 steps involved procedure PowerPoint Templates-Affiliate, Affiliation, Arrow, Business, Chart, Circular, Commerce, Concept, Contribution, Cycle, Development, Diagram, Idea, Informative, Internet, Join, Making, Manage, Management, Market, Marketing, Member, Money, Network, Partner, Partnership, Pay, Paying, Performance, Plans, Process, Productive, Productivity, Profit, Profitable, Project, Recruit, Recruiting, Recruitment, Refer, Referral, Referring, Revenue, Sales, Socialize, Steps, Strategy
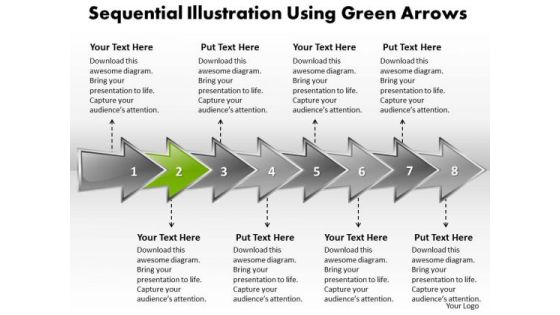
Ppt Sequential Interpretation Using PowerPoint Graphics Arrows Templates
PPT sequential interpretation using powerpoint graphics arrows Templates-Use this Diagram containing Arrow graphics to highlight the key issues of your presentation. It is also useful to represent drawing conclusion. Motivate your team to cross all barriers-PPT sequential interpretation using powerpoint graphics arrows Templates-action, arrow, badge, banner, blank, business, button, collection, colorful, concern, connect, decoration, design, direction, element, financial, flow, graph, instruction, involve, label, link, method, navigation, operate, procedure, process, relate, sequence, sequent, series, shape, stage, step, successive, technique
Market Indicators Icon To Interpret Financial Information Rules PDF
Persuade your audience using this Market Indicators Icon To Interpret Financial Information Rules PDF This PPT design covers three stages, thus making it a great tool to use. It also caters to a variety of topics including Market Indicators, Icon To Interpret, Financial Information Download this PPT design now to present a convincing pitch that not only emphasizes the topic but also showcases your presentation skills.

Customer Segmentation Dashboard To Monitor Results Ppt PowerPoint Presentation File Deck PDF
The following slide showcases a dashboard to monitor customer segmentation based on similar traits and characteristics. It highlights elements such as total customer in each segments, segments description, segment characteristics and search customer by ID. Formulating a presentation can take up a lot of effort and time, so the content and message should always be the primary focus. The visuals of the PowerPoint can enhance the presenters message, so our Customer Segmentation Dashboard To Monitor Results Ppt PowerPoint Presentation File Deck PDF was created to help save time. Instead of worrying about the design, the presenter can concentrate on the message while our designers work on creating the ideal templates for whatever situation is needed. Slidegeeks has experts for everything from amazing designs to valuable content, we have put everything into Customer Segmentation Dashboard To Monitor Results Ppt PowerPoint Presentation File Deck PDF.
Explainable Machine Learning Explainability Versus Interpretability In AI Icons PDF
This slide compares explainability and interpretability in artificial intelligence by showing how both explain with the machine learning models. Do you have to make sure that everyone on your team knows about any specific topic I yes, then you should give Explainable Machine Learning Explainability Versus Interpretability In AI Icons PDF a try. Our experts have put a lot of knowledge and effort into creating this impeccable Explainable Machine Learning Explainability Versus Interpretability In AI Icons PDF. You can use this template for your upcoming presentations, as the slides are perfect to represent even the tiniest detail. You can download these templates from the Slidegeeks website and these are easy to edit. So grab these today
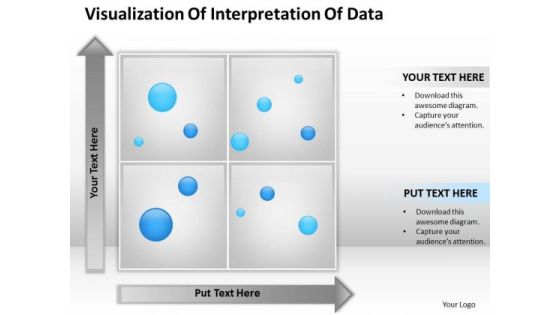
Business PowerPoint Template Visualization Of Interpretation Data Ppt Slides
Open up doors that lead to success. Our Business powerpoint template visualization of interpretation data ppt Slidesprovide the handles. Oppurtunity will come knocking at your door. Welcome it with our Success PowerPoint Templates. Our Advertising PowerPoint Templates abhor doodling. They never let the interest flag.
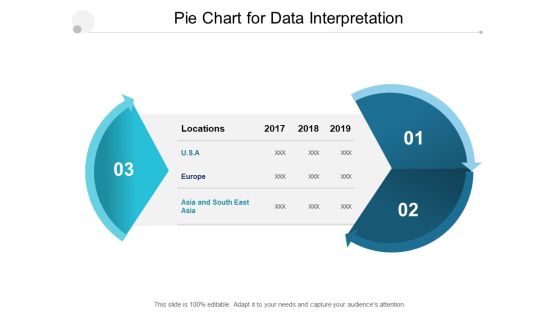
Pie Chart For Data Interpretation Ppt PowerPoint Presentation Portfolio Guide
Presenting this set of slides with name pie chart for data interpretation ppt powerpoint presentation portfolio guide. The topics discussed in these slides are pie chart, finance, donut chart. This is a completely editable PowerPoint presentation and is available for immediate download. Download now and impress your audience.

Application Patient Satisfaction Tactics Enhance Clinical Results Strategies To Decrease Wait Brochure PDF
This slide shows the strategies that can be used by the medical facility institution in order to decrease the patient waiting time such as avoid overbooking, speed up patient intake process, use a mobile queue system, use secure messaging offer multiple scheduling options etc. Presenting application patient satisfaction tactics enhance clinical results strategies to decrease wait brochure pdf to provide visual cues and insights. Share and navigate important information on six stages that need your due attention. This template can be used to pitch topics like avoid overbooking, use secure messaging, conduct a survey, scheduling options. In addtion, this PPT design contains high resolution images, graphics, etc, that are easily editable and available for immediate download.

Application Patient Satisfaction Tactics Enhance Clinical Results Benefits Of Patient Feedback Topics PDF
This slide shows the benefits of implementing patient feedback system to the medical facility such as helps in monitoring service quality, improves patient engagement and responses, retain loyal patients, help to gain better insights on healthcare practices, helps to measure medical facilitys performance etc. Presenting application patient satisfaction tactics enhance clinical results benefits of patient feedback topics pdf to provide visual cues and insights. Share and navigate important information on nine stages that need your due attention. This template can be used to pitch topics like retain loyal patients, service quality, patient preferences, engagement and response. In addtion, this PPT design contains high resolution images, graphics, etc, that are easily editable and available for immediate download.

Application Patient Satisfaction Tactics Enhance Clinical Results Strategies To Improve Patient Retention Rate Introduction PDF
This slide shows some strategies that can be used by the medical facility hospital institution to improve and increase the patient satisfaction rate such as decrease the wait times, improving the calling experience, simplifying the billing process, application of digitalized technology, personalizing the patient experience etc. Presenting application patient satisfaction tactics enhance clinical results strategies to improve patient retention rate introduction pdf to provide visual cues and insights. Share and navigate important information on six stages that need your due attention. This template can be used to pitch topics like decrease wait times, improve calling experience, simplify the billing process, digital technology. In addtion, this PPT design contains high resolution images, graphics, etc, that are easily editable and available for immediate download.
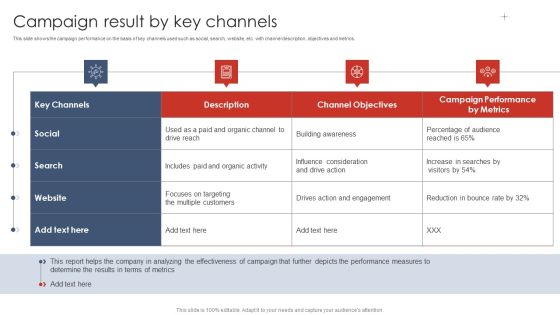
Campaign Result By Key Channels Digital Marketing Strategy Deployment Template PDF
This slide shows the campaign performance on the basis of key channels used such as social, search, website, etc. with channel description, objectives and metrics.Do you know about Slidesgeeks Campaign Result By Key Channels Digital Marketing Strategy Deployment Template PDF These are perfect for delivering any kind od presentation. Using it, create PowerPoint presentations that communicate your ideas and engage audiences. Save time and effort by using our pre-designed presentation templates that are perfect for a wide range of topic. Our vast selection of designs covers a range of styles, from creative to business, and are all highly customizable and easy to edit. Download as a PowerPoint template or use them as Google Slides themes.

Customer Segmentation Dashboard To Monitor Results Ppt Layouts Graphics Pictures PDF
The following slide showcases a dashboard to monitor customer segmentation based on similar traits and characteristics. It highlights elements such as total customer in each segments, segments description, segment characteristics and search customer by ID. Boost your pitch with our creative Customer Segmentation Dashboard To Monitor Results Ppt Layouts Graphics Pictures PDF. Deliver an awe inspiring pitch that will mesmerize everyone. Using these presentation templates you will surely catch everyones attention. You can browse the ppts collection on our website. We have researchers who are experts at creating the right content for the templates. So you do not have to invest time in any additional work. Just grab the template now and use them.
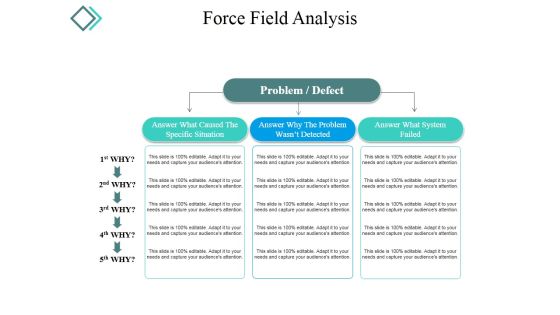
Force Field Analysis Template 2 Ppt PowerPoint Presentation Visual Aids
This is a force field analysis template 2 ppt powerpoint presentation visual aids. This is a two stage process. The stages in this process are problem defect, answer what system failed, answer why the problem was not detected.
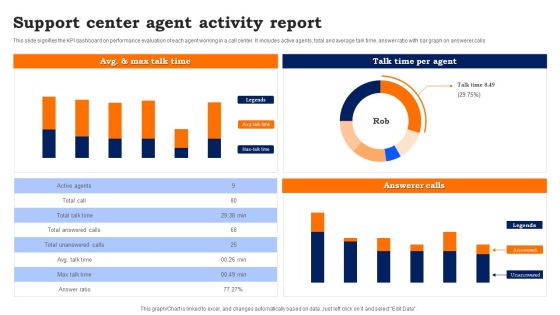
Support Center Agent Activity Report Guidelines PDF
This slide signifies the KPI dashboard on performance evaluation of each agent working in a call center. It includes active agents, total and average talk time, answer ratio with bar graph on answerer calls.

Data Science Capability And Interpretation Maturity Evaluation Model Download PDF
Presenting Data Science Capability And Interpretation Maturity Evaluation Model Download PDF to dispense important information. This template comprises five stages. It also presents valuable insights into the topics including Organization And Culture, Data And Technology, Ability To Ask Question. This is a completely customizable PowerPoint theme that can be put to use immediately. So, download it and address the topic impactfully. Presenting Data Science Capability And Interpretation Maturity Evaluation Model Download PDF to dispense important information. This template comprises five stages. It also presents valuable insights into the topics including Organization And Culture, Data And Technology, Ability To Ask Question. This is a completely customizable PowerPoint theme that can be put to use immediately. So, download it and address the topic impactfully.

4 Phases Of Data Interpretation And Evaluation Lifecycle Guidelines PDF
This slide demonstrates stages of data analytics and assessment lifecycle. It includes four phases such as ingestion, data quality and governance, data lake administration and analytics. Presenting 4 Phases Of Data Interpretation And Evaluation Lifecycle Guidelines PDF to dispense important information. This template comprises four stages. It also presents valuable insights into the topics including Ingestion, Data Quality And Governance, Analytics. This is a completely customizable PowerPoint theme that can be put to use immediately. So, download it and address the topic impactfully.

Project Description Ppt Model
This is a project description ppt model. This is a three stage process. The stages in this process are business, marketing, strategy, icons.

Big Data Interpretation And Evaluation Framework Portrait PDF
This slide covers the model representing the business objectives, strategies and enterprise metrics for data analytics and assessment. It includes metrics for data assessment such as analytics, people, data governance, people, process, technology and information architecture. Persuade your audience using this Big Data Interpretation And Evaluation Framework Portrait PDF. This PPT design covers six stages, thus making it a great tool to use. It also caters to a variety of topics including Data Governance, Information Architecture, Technology. Download this PPT design now to present a convincing pitch that not only emphasizes the topic but also showcases your presentation skills.

Big Data Interpretation Evaluation In Risk Management Lifecycle Designs PDF
This slide demonstrates the four phases of big data analytics assessment in risk management lifecycle. It includes four phases such as risk assessment and measurement, front office and risk operations, risk control, monitoring, reporting and governance. Persuade your audience using this Big Data Interpretation Evaluation In Risk Management Lifecycle Designs PDF. This PPT design covers four stages, thus making it a great tool to use. It also caters to a variety of topics including Risk Assessment And Measurement, Risk Control And Monitoring , Risk Reporting And Governance. Download this PPT design now to present a convincing pitch that not only emphasizes the topic but also showcases your presentation skills.

Data And Interpretation Evaluation Weekly Timeline Elements PDF
This slide represents the weekly timeline for analysis and assessment of big data. It includes activities such as DVI survey and R, as-is state, to-be state, identify quick wins, prioritize, roadmap and standards and implementation approach. Presenting Data And Interpretation Evaluation Weekly Timeline Elements PDF to dispense important information. This template comprises seven stages. It also presents valuable insights into the topics including Prioritize, Implementation Approach, Identify Quick Wins. This is a completely customizable PowerPoint theme that can be put to use immediately. So, download it and address the topic impactfully.
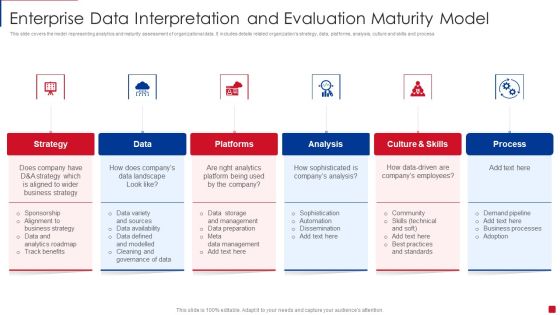
Enterprise Data Interpretation And Evaluation Maturity Model Slides PDF
This slide covers the model representing analytics and maturity assessment of organizational data. It includes details related organizations strategy, data, platforms, analysis, culture and skills and process Persuade your audience using this Enterprise Data Interpretation And Evaluation Maturity Model Slides PDF. This PPT design covers six stages, thus making it a great tool to use. It also caters to a variety of topics including Platforms, Analysis, Culture And Skills. Download this PPT design now to present a convincing pitch that not only emphasizes the topic but also showcases your presentation skills.

Supply Chain Data Interpretation And Vulnerability Evaluation Report Pictures PDF
This slide shows the assessment report prepared through data analytics showing the weaknesses identified in management of supply chain risks. It includes details related to vulnerability comparison to industry benchmark and financial resiliency scores Showcasing this set of slides titled Supply Chain Data Interpretation And Vulnerability Evaluation Report Pictures PDF. The topics addressed in these templates are Planning And Supplier Network, Transportation And Logistics, Financial Flexibility. All the content presented in this PPT design is completely editable. Download it and make adjustments in color, background, font etc. as per your unique business setting.

Interpreter Ppt PowerPoint Presentation Complete Deck With Slides
If designing a presentation takes a lot of your time and resources and you are looking for a better alternative, then this Interpreter Ppt PowerPoint Presentation Complete Deck With Slides is the right fit for you. This is a prefabricated set that can help you deliver a great presentation on the topic. All the twelve slides included in this sample template can be used to present a birds-eye view of the topic. These slides are also fully editable, giving you enough freedom to add specific details to make this layout more suited to your business setting. Apart from the content, all other elements like color, design, theme are also replaceable and editable. This helps in designing a variety of presentations with a single layout. Not only this, you can use this PPT design in formats like PDF, PNG, and JPG once downloaded. Therefore, without any further ado, download and utilize this sample presentation as per your liking.

Interpreting Core Functioning Of ML Process Graphics PDF
This slide provides information regarding prime functioning of ML process as the systems learns from historical data and prepare predict output based on it. ML algorithm is competent in consistent learning and gradually enhance its accuracy. Are you in need of a template that can accommodate all of your creative concepts This one is crafted professionally and can be altered to fit any style. Use it with Google Slides or PowerPoint. Include striking photographs, symbols, depictions, and other visuals. Fill, move around, or remove text boxes as desired. Test out color palettes and font mixtures. Edit and save your work, or work with colleagues. Download Interpreting Core Functioning Of ML Process Graphics PDF and observe how to make your presentation outstanding. Give an impeccable presentation to your group and make your presentation unforgettable.

Question With Arrows Symbol PowerPoint Templates And PowerPoint Backgrounds 0411
Microsoft PowerPoint Template and Background with a question mark at the center of many colorful arrows representing different answers

Question With Arrows Symbol PowerPoint Themes And PowerPoint Slides 0411
Microsoft PowerPoint Theme and Slide with a question mark at the center of many colorful arrows representing different answers
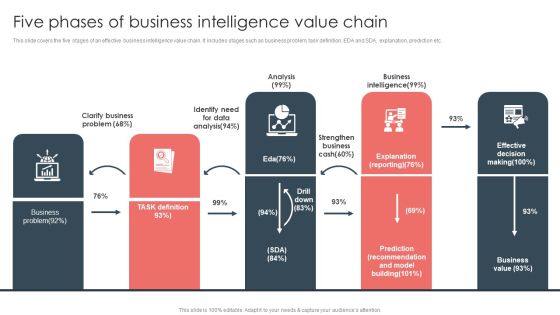
Overview Of BI For Enhanced Decision Making Five Phases Of Business Intelligence Value Chain Template PDF
This slide covers the five stages of an effective business intelligence value chain. It includes stages such as business problem, task definition, EDA and SDA, explanation, prediction etc. From laying roadmaps to briefing everything in detail, our templates are perfect for you. You can set the stage with your presentation slides. All you have to do is download these easy to edit and customizable templates. Overview Of BI For Enhanced Decision Making Five Phases Of Business Intelligence Value Chain Template PDF will help you deliver an outstanding performance that everyone would remember and praise you for. Do download this presentation today.

Ring Data Analysis And Interpretation Business Plan Template PowerPoint Templates
We present our ring data analysis and interpretation business plan template PowerPoint templates.Present our Circle Charts PowerPoint Templates because Our PowerPoint Templates and Slides are a sure bet. Gauranteed to win against all odds. Download and present our Business PowerPoint Templates because you should once Tap the ingenuity of our PowerPoint Templates and Slides. They are programmed to succeed. Download our Shapes PowerPoint Templates because Our PowerPoint Templates and Slides are truly out of this world. Even the MIB duo has been keeping tabs on our team. Present our Signs PowerPoint Templates because They will Put your wonderful verbal artistry on display. Our PowerPoint Templates and Slides will provide you the necessary glam and glitter. Download our Metaphors-Visual Concepts PowerPoint Templates because Our PowerPoint Templates and Slides are Clear and concise. Use them and dispel any doubts your team may have.Use these PowerPoint slides for presentations relating to metal, wallpaper, decoration, chrome, vivid, blank, glossy, bright, template, curvy, copyspace, circle, light, decor, element, digital, card, simple, wavy, shape, abstract, wave, modern, creative, circular, round, shiny, backdrop, reflection, design, abstraction, gold, cover, color, colorful, empty, picture, banner, twirl, art, golden, background, border, vortex. The prominent colors used in the PowerPoint template are Green dark , Green, Green lime .
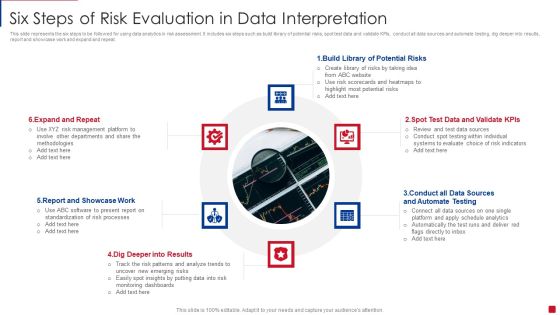
Six Steps Of Risk Evaluation In Data Interpretation Sources Brochure PDF
This slide represents the six steps to be followed for using data analytics in risk assessment. It includes six steps such as build library of potential risks, spot test data and validate KPIs, conduct all data sources and automate testing, dig deeper into results, report and showcase work and expand and repeat. Presenting Six Steps Of Risk Evaluation In Data Interpretation Sources Brochure PDF to dispense important information. This template comprises ten stages. It also presents valuable insights into the topics including Target Personas, Define The Questions, Define The Business Model. This is a completely customizable PowerPoint theme that can be put to use immediately. So, download it and address the topic impactfully.

Create Unique Question Id Example Of Ppt Presentation
This is a create unique question id example of ppt presentation. This is a eight stage process. The stages in this process are add question text, add answer rows and columns, add instruction test, process to scripting, create unique question id, add question properties, add answer properties, add answer formatting.
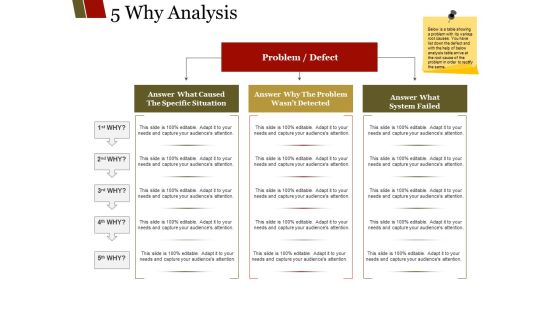
Why Analysis Ppt PowerPoint Presentation Outline Infographics
This is a why analysis ppt powerpoint presentation outline infographics. This is a three stage process. The stages in this process are answer what caused the specific situation, answer why the problem wasn t detected, answer what, system failed, problem defect.
