Software Icon
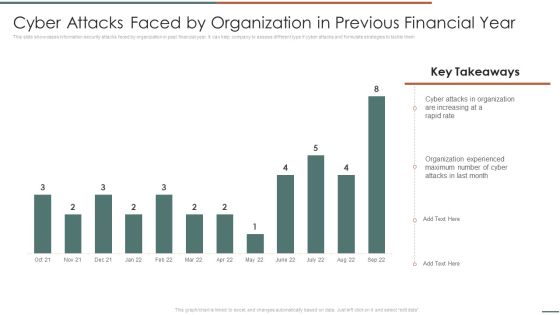
Information Security Risk Evaluation Cyber Attacks Faced By Organization In Previous Financial Year Template PDF
This slide showcases information security attacks faced by organization in past financial year. It can help company to assess different type if cyber attacks and formulate strategies to tackle them.Deliver and pitch your topic in the best possible manner with this Information Security Risk Evaluation Cyber Attacks Faced By Organization In Previous Financial Year Template PDF. Use them to share invaluable insights on Attacks In Organization, Organization Experienced, Attacks Last and impress your audience. This template can be altered and modified as per your expectations. So, grab it now.
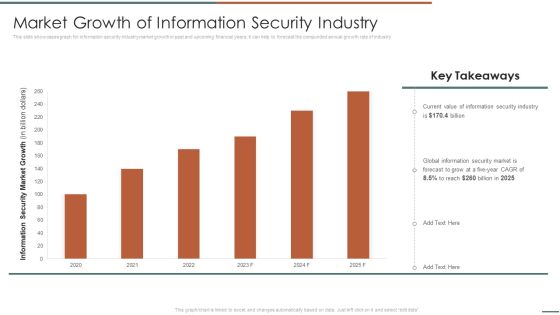
Information Security Risk Evaluation Market Growth Of Information Security Industry Infographics PDF
This slide showcases graph for information security industry market growth in past and upcoming financial years. It can help to forecast the compunded annual growth rate of industry .Deliver and pitch your topic in the best possible manner with this Information Security Risk Evaluation Market Growth Of Information Security Industry Infographics PDF. Use them to share invaluable insights on Information Security, Global Information, Security Market and impress your audience. This template can be altered and modified as per your expectations. So, grab it now.

Information Security Risk Evaluation Risk Management Dashboard For Information Security Summary PDF
This slide showcases dashboard that can help organization to track the major information security risks and resolve them in timely manner. Its key components are risk rating breakdown, heat map, action plan and top 5 vulnerabilities.Deliver and pitch your topic in the best possible manner with this Information Security Risk Evaluation Risk Management Dashboard For Information Security Summary PDF. Use them to share invaluable insights on Rating Breakdown, Vulnerabilities, Response Progress and impress your audience. This template can be altered and modified as per your expectations. So, grab it now.
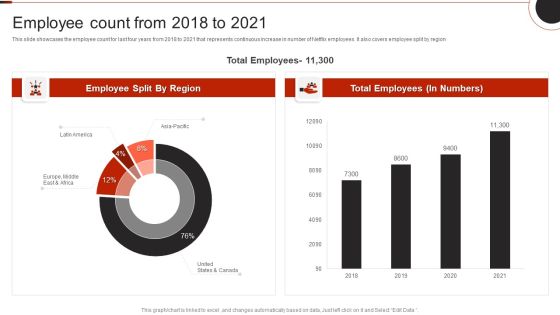
Netflix Company Outline Employee Count From 2018 To 2021 Information PDF
This slide showcases the employee count for last four years from 2018 to 2021 that represents continuous increase in number of Netflix employees. It also covers employee split by region.Deliver and pitch your topic in the best possible manner with this Netflix Company Outline Employee Count From 2018 To 2021 Information PDF. Use them to share invaluable insights on Employee Split, Total Employees, Europe Middle and impress your audience. This template can be altered and modified as per your expectations. So, grab it now.

Digital Marketing Guide For B2B Firms Dashboard To Track Social Media Ads Campaign Results Topics PDF
This slide showcases dashboard that can help organization to track performance of social media advertising campaigns. Its key components are cost per conversion, CTR, link clicks, impressions, conversion rate, click through rate and cost per click.Deliver and pitch your topic in the best possible manner with this Digital Marketing Guide For B2B Firms Dashboard To Track Social Media Ads Campaign Results Topics PDF. Use them to share invaluable insights on Website Conversions, Conversions Rate, Cost Per Conversion and impress your audience. This template can be altered and modified as per your expectations. So, grab it now.

Digital Marketing Guide For B2B Firms Dashboard To Track Social Media Marketing Campaign Metrics Demonstration PDF
This slide showcases dashboard that can help organization to track the metrics of social media marketing campaign. Its key components are followers, post reach, page impressions, visitors, avg engagement and lifetime views.Deliver an awe inspiring pitch with this creative Digital Marketing Guide For B2B Firms Dashboard To Track Social Media Marketing Campaign Metrics Demonstration PDF bundle. Topics like Page Impressions, New Followers, Talking About can be discussed with this completely editable template. It is available for immediate download depending on the needs and requirements of the user.
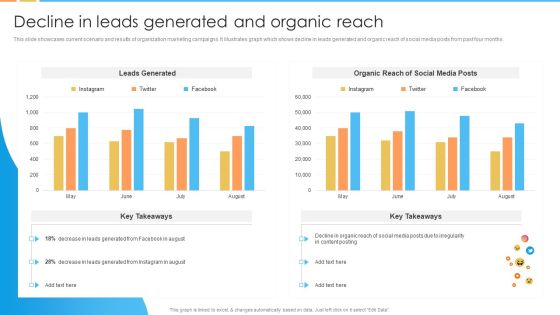
Digital Marketing Guide For B2B Firms Decline In Leads Generated And Organic Reach Pictures PDF
This slide showcases current scenario and results of organization marketing campaigns. It illustrates graph which shows decline in leads generated and organic reach of social media posts from past four months.Deliver and pitch your topic in the best possible manner with this Digital Marketing Guide For B2B Firms Decline In Leads Generated And Organic Reach Pictures PDF. Use them to share invaluable insights on Leads Generated, Organic Reach, Leads Generated and impress your audience. This template can be altered and modified as per your expectations. So, grab it now.
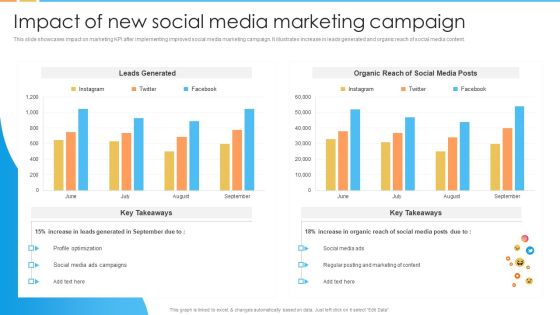
Digital Marketing Guide For B2B Firms Impact Of New Social Media Marketing Campaign Guidelines PDF
This slide showcases impact on marketing KPI after implementing improved social media marketing campaign. It illustrates increase in leads generated and organic reach of social media content.Deliver and pitch your topic in the best possible manner with this Digital Marketing Guide For B2B Firms Impact Of New Social Media Marketing Campaign Guidelines PDF. Use them to share invaluable insights on Profile Optimization, Organic Reach, Regular Posting and impress your audience. This template can be altered and modified as per your expectations. So, grab it now.
Effective Company Event Communication Tactics Dashboard For Tracking Active Number Of Attendances Demonstration PDF
This slide covers metrics for analyzing the number of most active event participants. It includes KPIs such as check-in status, contract roles, top industries, contract by country, top 5 job functions, etc. Deliver and pitch your topic in the best possible manner with this Effective Company Event Communication Tactics Dashboard For Tracking Active Number Of Attendances Demonstration PDF. Use them to share invaluable insights on Attendance, Exhibitors, Management and impress your audience. This template can be altered and modified as per your expectations. So, grab it now.

Marketing Strategy For Shipping Business Key Performance Indicator Dashboard Graphics PDF
The following slide depicts the key areas in Marketing Strategy for Shipping Business to monitor and optimize supply chain processes. It includes elements such as fleet and shipment status, country wise revenue, location wise delivery, average shipment time etc.Pitch your topic with ease and precision using this Marketing Strategy For Shipping Business Key Performance Indicator Dashboard Graphics PDF. This layout presents information on Shipment Status, Average Shipment, Wise Revenue. It is also available for immediate download and adjustment. So, changes can be made in the color, design, graphics or any other component to create a unique layout.
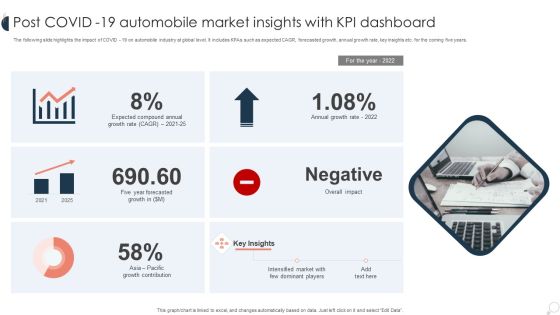
Post COVID 19 Automobile Market Insights With KPI Dashboard Ppt PowerPoint Presentation Slides Background Images PDF
The following slide highlights the impact of COVID 19 on automobile industry at global level. It includes KPAs such as expected CAGR, forecasted growth, annual growth rate, key insights etc. for the coming five years. Showcasing this set of slides titled Post COVID 19 Automobile Market Insights With KPI Dashboard Ppt PowerPoint Presentation Slides Background Images PDF. The topics addressed in these templates are Expected Compound, Annual Growth, Overall Impact. All the content presented in this PPT design is completely editable. Download it and make adjustments in color, background, font etc. as per your unique business setting.
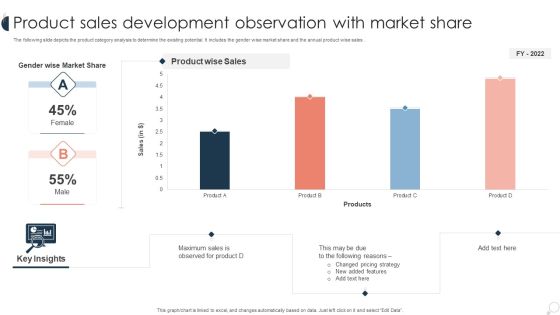
Product Sales Development Observation With Market Share Ppt PowerPoint Presentation Infographic Template Guide PDF
The following slide depicts the product category analysis to determine the existing potential. It includes the gender wise market share and the annual product wise sales . Pitch your topic with ease and precision using this Product Sales Development Observation With Market Share Ppt PowerPoint Presentation Infographic Template Guide PDF. This layout presents information on Changed Pricing, Observed For Product, Product Wise. It is also available for immediate download and adjustment. So, changes can be made in the color, design, graphics or any other component to create a unique layout.

Project Budgetary Trends Analysis With Revised Forecast And Variance Elements PDF
The following slide shows trend analysis to find out whether the budget of the project is under or overrun . It includes project, budget YTD of previous and current month, revised forecast and variance.Showcasing this set of slides titled Project Budgetary Trends Analysis With Revised Forecast And Variance Elements PDF. The topics addressed in these templates are Current Month, Previous Month, Revised Forecast. All the content presented in this PPT design is completely editable. Download it and make adjustments in color, background, font etc. as per your unique business setting.

Big Data Architect Impact Of Big Data Management On Business Processes Designs PDF
This slide represents the impacts of the big data deployment on the organization, and it shows the effect on decision making, decrease in expenses, customer service, and speed to market.Deliver and pitch your topic in the best possible manner with this Big Data Architect Impact Of Big Data Management On Business Processes Designs PDF. Use them to share invaluable insights on Advanced Analytics, Better Decision, Decrease Expenses and impress your audience. This template can be altered and modified as per your expectations. So, grab it now.

Data Analytics Management Impacts Of Big Data Management On Business Processes Sample PDF
This slide represents the impacts of the big data deployment on the organization, and it shows the effect on decision making, decrease in expenses, customer service, and speed to market.Deliver and pitch your topic in the best possible manner with this Data Analytics Management Impacts Of Big Data Management On Business Processes Sample PDF. Use them to share invaluable insights on Advanced Analytics, Decrease Expenses, Customer Service and impress your audience. This template can be altered and modified as per your expectations. So, grab it now.
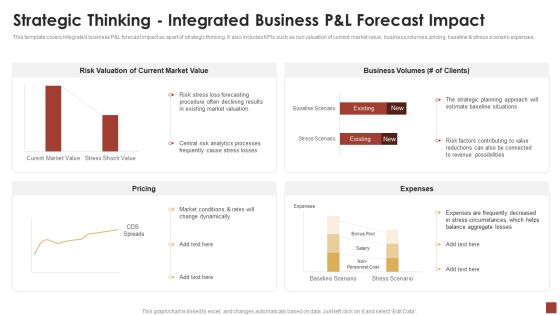
Strategical And Tactical Planning Strategic Thinking Integrated Business Pandl Forecast Impact Pictures PDF
This template covers integrated business P and L forecast impact as apart of strategic thinking. It also includes KPIs such as risk valuation of current market value, business volumes, pricing, baseline and stress scenario expenses. Deliver and pitch your topic in the best possible manner with this Strategical And Tactical Planning Strategic Thinking Integrated Business Pandl Forecast Impact Pictures PDF. Use them to share invaluable insights on Risk Valuation, Current Market Value, Business Volumes and impress your audience. This template can be altered and modified as per your expectations. So, grab it now.

Five Year Comparison Of Registered Mobile Money Customers Spread By Region Introduction PDF
This slide shows the information statistics about region wise registered mobile money customers spread during last 5 years. It indicates that customers spread in south asia recorded highest that is 28.4persent over the last five years.Deliver and pitch your topic in the best possible manner with this Five Year Comparison Of Registered Mobile Money Customers Spread By Region Introduction PDF. Use them to share invaluable insights on Region Recorded, Mobile Money, Customers Spread and impress your audience. This template can be altered and modified as per your expectations. So, grab it now.

Linkedin Company Outline Listed Organizations And Schools Rules PDF
The slide showcases company revenue for last six years along with forecasted revenue for Q4F Y22. It also depicts CAGR and key insights for revenue analysis.The slide highlights the growth in the number of organizations and hospitals listed with LinkedIn, which are used for marketing material and to connecting graduates. Deliver an awe inspiring pitch with this creative Linkedin Company Outline Listed Organizations And Schools Rules PDF bundle. Topics like Organizations Increased, Schools Doubled, Organizations can be discussed with this completely editable template. It is available for immediate download depending on the needs and requirements of the user.
Online Customer Interaction Dashboard For Tracking Customer Service Team Performance Infographics PDF
This slide covers the KPI dashboard for analyzing the performance of client support department. It includes metrics such as first call resolution, unresolved calls, average response rate, the best day to call, average time to solve issues, etc. Deliver and pitch your topic in the best possible manner with this Online Customer Interaction Dashboard For Tracking Customer Service Team Performance Infographics PDF. Use them to share invaluable insights on Response Time, Issue Solving, Call Resolution and impress your audience. This template can be altered and modified as per your expectations. So, grab it now.
Online Customer Interaction Online Ad Campaign Performance Tracking Dashboard Demonstration PDF
This slide covers the KPI dashboard for measuring digital campaign results. It includes metrics such as Ad cost, clicks, impressions, CTR, cost per click, conversions, conversion rate, cost per click, cost per thousand impressions, etc. Deliver and pitch your topic in the best possible manner with this Online Customer Interaction Online Ad Campaign Performance Tracking Dashboard Demonstration PDF. Use them to share invaluable insights on Conversations, Impressions, Conversation Rate and impress your audience. This template can be altered and modified as per your expectations. So, grab it now.
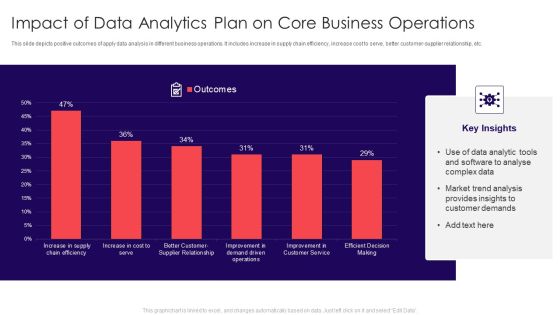
Impact Of Data Analytics Plan On Core Business Operations Summary PDF
This slide depicts positive outcomes of apply data analysis in different business operations. It includes increase in supply chain efficiency, increase cost to serve, better customer-supplier relationship, etc. Showcasing this set of slides titled Impact Of Data Analytics Plan On Core Business Operations Summary PDF. The topics addressed in these templates are Customer Demands, Market Trend Analysis, Complex Data. All the content presented in this PPT design is completely editable. Download it and make adjustments in color, background, font etc. as per your unique business setting.
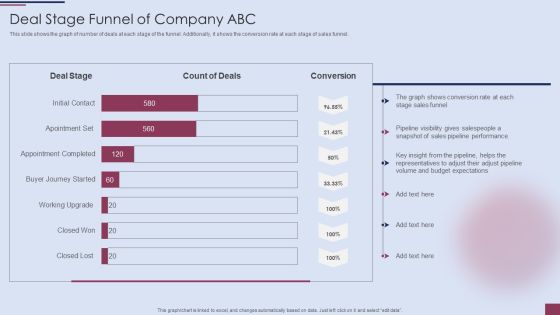
Sales Process Management To Boost Business Effectiveness Deal Stage Funnel Of Company ABC Mockup PDF
This slide shows the graph of number of deals at each stage of the funnel. Additionally, it shows the conversion rate at each stage of sales funnel.Deliver and pitch your topic in the best possible manner with this Sales Process Management To Boost Business Effectiveness Deal Stage Funnel Of Company ABC Mockup PDF. Use them to share invaluable insights on Shows Conversion, Sales Funnel, Pipeline Performance and impress your audience. This template can be altered and modified as per your expectations. So, grab it now.

Sales Process Management To Boost Business Effectiveness Decline In Total Sales Of Company ABC Template PDF
This slide shows graph of impact of sales pipeline challenges on overall sales of the company. Additionally, it provides the reasons behind the sales decline.Deliver and pitch your topic in the best possible manner with this Sales Process Management To Boost Business Effectiveness Decline In Total Sales Of Company ABC Template PDF. Use them to share invaluable insights on Pipeline Management, Opportunities In Pipeline, Decline In Pipeline and impress your audience. This template can be altered and modified as per your expectations. So, grab it now.

Healthcare Big Data Assessment Dashboard Portrait PDF
This slide displays the data of healthcare sector showing the total number of patients in the hospital, average treatment cost and waiting time. It also shows the outpatient and impatient trends. Pitch your topic with ease and precision using this Healthcare Big Data Assessment Dashboard Portrait PDF. This layout presents information on Patient Status, Treatment Costs. It is also available for immediate download and adjustment. So, changes can be made in the color, design, graphics or any other component to create a unique layout.

Content Freelance Marketing Metrics With Total Visits And Bounce Rate Slides PDF
The following slide highlights the content freelance marketing metrics with total visits and bounce rate. It showcases total visits, average visit per day, page overview, page engagement, unique visits, bounce rate, retention rate and top content Pitch your topic with ease and precision using this Content Freelance Marketing Metrics With Total Visits And Bounce Rate Slides PDF. This layout presents information on Average, Page Engagement, Bounce Rate. It is also available for immediate download and adjustment. So, changes can be made in the color, design, graphics or any other component to create a unique layout.

Dashboard For Freelance Content Marketing Metrics Dashboard With Blog Visits Guidelines PDF
Showcasing this set of slides titled Dashboard For Freelance Content Marketing Metrics Dashboard With Blog Visits Guidelines PDF. The topics addressed in these templates are Traffic Source, Signup Conversion Rate, Search Network. All the content presented in this PPT design is completely editable. Download it and make adjustments in color, background, font etc. as per your unique business setting. The following slide highlights the dashboard for freelance content marketing metrics dashboard with blog visits. It showcases overall visits, conversions, blog visits, unique visitors, signup conversion rate, blog pages per visit, conversion by search query, conversion by social network, blog post visits and conversion by traffic source

Freelance Content Marketing Dashboard With Metrics Demonstration PDF
The following slide highlights the freelance content marketing dashboard with metrics illustrating most visited content, monthly total visit, average content score. It depicts key metrics which includes content reach, unique visits, organic ranking, number of shares, rating, session time and repeat visitors. Showcasing this set of slides titled Freelance Content Marketing Dashboard With Metrics Demonstration PDF. The topics addressed in these templates are Organic Ranking, Manufacturing, Average Content Score. All the content presented in this PPT design is completely editable. Download it and make adjustments in color, background, font etc. as per your unique business setting.

Freelance Content Marketing Performance Metrics Dashboard Elements PDF
The following slide highlights the freelance content marketing performance metrics dashboard. It depicts content visitor and number of leads for last 24 hours, cost per click, number of content visitor, daily content visitor, lead generation source, top converting landing pages, top converting marketing channels and return on investment. Showcasing this set of slides titled Freelance Content Marketing Performance Metrics Dashboard Elements PDF. The topics addressed in these templates are Lead Generation Source, Return On Investment, Converting Marketing Channels. All the content presented in this PPT design is completely editable. Download it and make adjustments in color, background, font etc. as per your unique business setting.
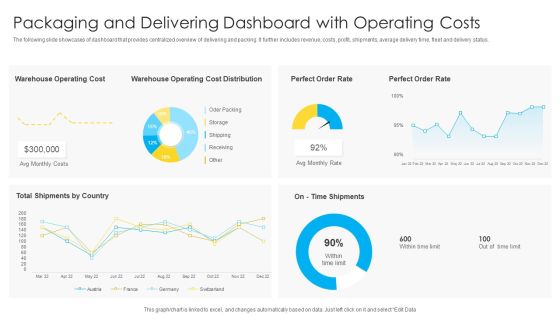
Packaging And Delivering Dashboard With Operating Costs Topics PDF
The following slide showcases of dashboard that provides centralized overview of delivering and packing. It further includes revenue, costs, profit, shipments, average delivery time, fleet and delivery status. Showcasing this set of slides titled Packaging And Delivering Dashboard With Operating Costs Topics PDF. The topics addressed in these templates are Warehouse Operating Cost, Perfect Order Rate, Avg Monthly Costs. All the content presented in this PPT design is completely editable. Download it and make adjustments in color, background, font etc. as per your unique business setting.

Quarterly Overall Employee Performance Evaluation Sheet Sample PDF
The below slide illustrates the quarter2 performance review of an employee to analyze their strengths and weakness. It includes employee name, department and KPIs such as overall performance, goals achieved, improvement, core values etc. Showcasing this set of slides titled Quarterly Overall Employee Performance Evaluation Sheet Sample PDF. The topics addressed in these templates are Overall Performance, Goals Achieved, Improvement. All the content presented in this PPT design is completely editable. Download it and make adjustments in color, background, font etc. as per your unique business setting.

Monthly Resource Planning Management Of Project Team Demonstration PDF
This slide covers the resourcing plan with the name of the project manager and its team members which shows the monthly percentage of absence, project, speculative, overhead and availability using graphical presentation. Showcasing this set of slides titled Monthly Resource Planning Management Of Project Team Demonstration PDF. The topics addressed in these templates are Project Team, Resource Planning Management. All the content presented in this PPT design is completely editable. Download it and make adjustments in color, background, font etc. as per your unique business setting.

6 Year Revenue Declining Graph Ppt PowerPoint Presentation Outline Sample PDF
This slide shows the revenues of the company over the last years to have a clear idea of organization growth and financial status . It includes the 6 year 2017 to 2022 revenue earned by the company.Showcasing this set of slides titled 6 Year Revenue Declining Graph Ppt PowerPoint Presentation Outline Sample PDF. The topics addressed in these templates are Revenue Company, Highest Comparison, Conditions Restrictions. All the content presented in this PPT design is completely editable. Download it and make adjustments in color, background, font etc. as per your unique business setting.
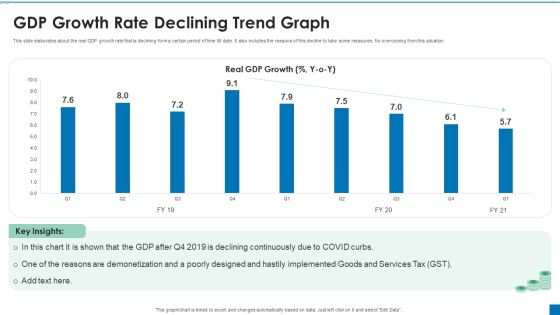
GDP Growth Rate Declining Trend Graph Ppt PowerPoint Presentation Slides Professional PDF
This slide elaborates about the real GDP growth rate that is declining form a certain period of time till date. It also includes the reasons of this decline to take some measures for overcoming from this situation. Showcasing this set of slides titled GDP Growth Rate Declining Trend Graph Ppt PowerPoint Presentation Slides Professional PDF. The topics addressed in these templates are Declining Continuously, Poorly Designed, Reasons Demonetization. All the content presented in this PPT design is completely editable. Download it and make adjustments in color, background, font etc. as per your unique business setting.
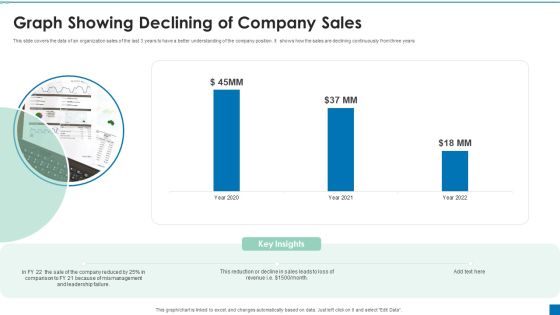
Graph Showing Declining Of Company Sales Ppt PowerPoint Presentation Portfolio Graphics Example PDF
This slide covers the data of an organization sales of the last 3 years to have a better understanding of the company position. It shows how the sales are declining continuously from three years.Pitch your topic with ease and precision using this Graph Showing Declining Of Company Sales Ppt PowerPoint Presentation Portfolio Graphics Example PDF. This layout presents information on Reduction Decline, Comparison, Mismanagement. It is also available for immediate download and adjustment. So, changes can be made in the color, design, graphics or any other component to create a unique layout.
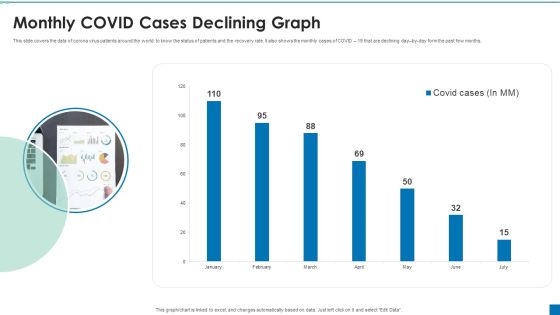
Monthly COVID Cases Declining Graph Ppt PowerPoint Presentation Ideas Slide Portrait PDF
This slide covers the data of corona virus patients around the world to know the status of patients and the recovery rate. It also shows the monthly cases of COVID 19 that are declining day by day form the past few months.Showcasing this set of slides titled Monthly COVID Cases Declining Graph Ppt PowerPoint Presentation Ideas Slide Portrait PDF. The topics addressed in these templates are Monthly Covid Cases, Declining Graph. All the content presented in this PPT design is completely editable. Download it and make adjustments in color, background, font etc. as per your unique business setting.

Organic Page Reach Declining Graph With Stock Prices Ppt PowerPoint Presentation Ideas Styles PDF
This slide covers the information related to the share price and organic page reach of an organization to check the position of its working and to have records of them.Pitch your topic with ease and precision using this Organic Page Reach Declining Graph With Stock Prices Ppt PowerPoint Presentation Ideas Styles PDF. This layout presents information on Increasing High, Reach Declining, Supply Market. It is also available for immediate download and adjustment. So, changes can be made in the color, design, graphics or any other component to create a unique layout.
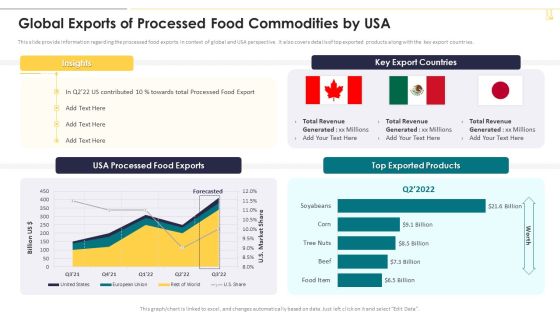
Global Exports Of Processed Food Commodities By Usa Graphics PDF
This slide provide information regarding the processed food exports in context of global and USA perspective. It also covers details of top exported products along with the key export countries. Deliver and pitch your topic in the best possible manner with this Global Exports Of Processed Food Commodities By Usa Graphics PDF. Use them to share invaluable insights on Top Exported Products, Key Export Countries, Total Revenue and impress your audience. This template can be altered and modified as per your expectations. So, grab it now.
KPI Dashboard For Tracking Supply Chain Costs Inspiration PDF
This slide represents the KPI dashboard to track the multiple cost associated with supply chain in food manufacturing industry. It includes information regarding cash to cash cycle in days, carry cost of inventory along with details of net sales. Deliver an awe inspiring pitch with this creative KPI Dashboard For Tracking Supply Chain Costs Inspiration PDF bundle. Topics like Supply Chain Costs, Average Cash, Service can be discussed with this completely editable template. It is available for immediate download depending on the needs and requirements of the user.
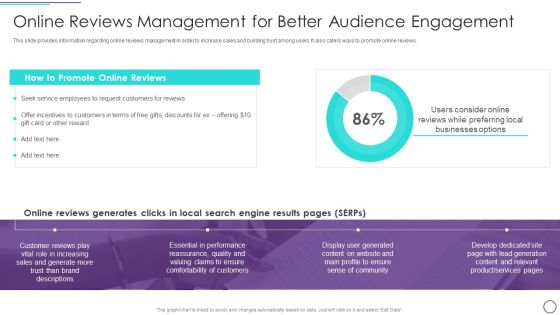
Franchise Marketing Plan Playbook Online Reviews Management For Better Audience Engagement Mockup PDF
This slide provides information regarding online reviews management in order to increase sales and building trust among users. It also caters ways to promote online reviews. Deliver and pitch your topic in the best possible manner with this Franchise Marketing Plan Playbook Online Reviews Management For Better Audience Engagement Mockup PDF. Use them to share invaluable insights on Customers For Reviews, Service Employees, Businesses Options and impress your audience. This template can be altered and modified as per your expectations. So, grab it now.

Guide To Client Success Customer Success KPI Dashboard To Measure Support Team Performance Topics PDF
Mentioned slide showcases customer success dashboard that company is currently using to measure its support team performance. Kpis covered in the dashboard are health score, retention cost, churn rate etc. Deliver an awe inspiring pitch with this creative Guide To Client Success Customer Success KPI Dashboard To Measure Support Team Performance Topics PDF bundle. Topics like Customer Churn Rate, Customer Retention Cost, Revenue can be discussed with this completely editable template. It is available for immediate download depending on the needs and requirements of the user.

Guide To Client Success Determining The Customer Effort Score Microsoft PDF
Following slide portrays customer effort score based on the survey conducted by the firm. It reveals that 27 percent of participants spent a long time looking for the desired product. Deliver and pitch your topic in the best possible manner with this Guide To Client Success Determining The Customer Effort Score Microsoft PDF. Use them to share invaluable insights on Survey Question, Desired Product, Customer Effort Score and impress your audience. This template can be altered and modified as per your expectations. So, grab it now.
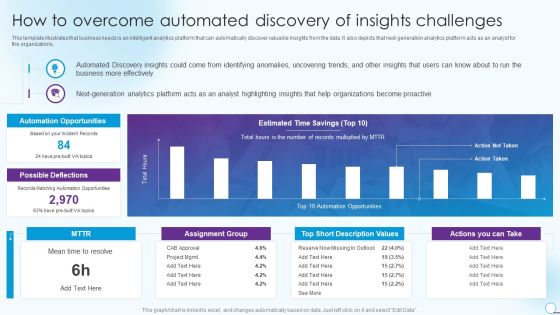
Information Analytics And Ml Strategy Playbook How To Overcome Automated Discovery Of Insights Challenges Information PDF
This template illustrates that business needs is an intelligent analytics platform that can automatically discover valuable insights from the data. It also depicts that next-generation analytics platform acts as an analyst for the organizations. Deliver an awe inspiring pitch with this creative Information Analytics And Ml Strategy Playbook How To Overcome Automated Discovery Of Insights Challenges Information PDF bundle. Topics like Organizations, Automation Opportunities, Description Values can be discussed with this completely editable template. It is available for immediate download depending on the needs and requirements of the user.
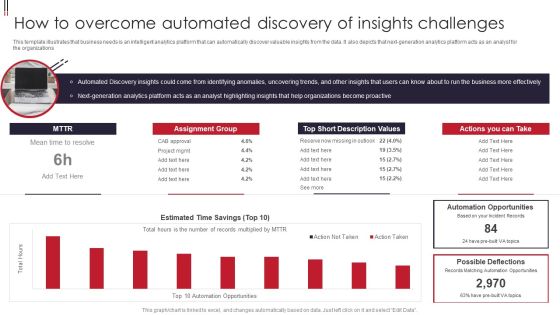
Information Visualizations Playbook How To Overcome Automated Discovery Of Insights Challenges Designs PDF
This template illustrates that business needs is an intelligent analytics platform that can automatically discover valuable insights from the data. It also depicts that next-generation analytics platform acts as an analyst for the organizations. Deliver and pitch your topic in the best possible manner with this Information Visualizations Playbook How To Overcome Automated Discovery Of Insights Challenges Designs PDF. Use them to share invaluable insights on Short Description Values, Automation Opportunities, Short Description Values, Analytics Platform and impress your audience. This template can be altered and modified as per your expectations. So, grab it now.
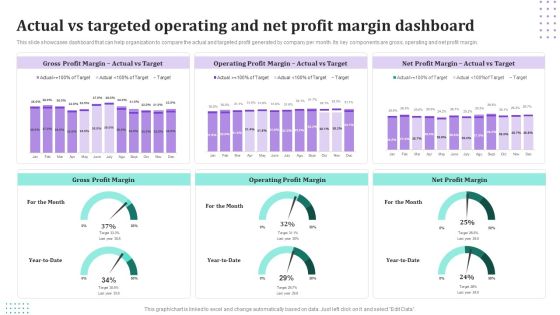
Actual Vs Targeted Operating And Net Profit Margin Dashboard Information PDF
This slide showcases dashboard that can help organization to compare the actual and targeted profit generated by company per month. Its key components are gross, operating and net profit margin. Showcasing this set of slides titled Actual Vs Targeted Operating And Net Profit Margin Dashboard Information PDF. The topics addressed in these templates are Gross Profit Margin, Operating Profit Margin, Net Profit Margin. All the content presented in this PPT design is completely editable. Download it and make adjustments in color, background, font etc. as per your unique business setting.

Monthly Comparison Graph For Operating And Gross Profit Margin Pictures PDF
This slide showcases monthly comparison graph that can help organization to compare the profits margin generated in different months. Its key components are gross, operating and net profit margin. Showcasing this set of slides titled Monthly Comparison Graph For Operating And Gross Profit Margin Pictures PDF. The topics addressed in these templates are Gross Profit Margin, Operating Profit Margin, Net Profit Margin. All the content presented in this PPT design is completely editable. Download it and make adjustments in color, background, font etc. as per your unique business setting.
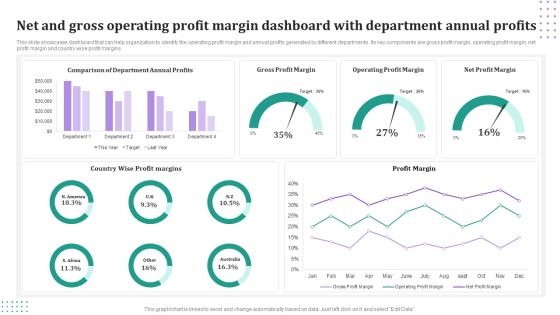
Net And Gross Operating Profit Margin Dashboard With Department Annual Profits Mockup PDF
This slide showcases dashboard that can help organization to identify the operating profit margin and annual profits generated by different departments. Its key components are gross profit margin, operating profit margin, net profit margin and country wise profit margins. Pitch your topic with ease and precision using this Net And Gross Operating Profit Margin Dashboard With Department Annual Profits Mockup PDF. This layout presents information on Gross Profit Margin, Operating Profit Margin, Net Profit Margin. It is also available for immediate download and adjustment. So, changes can be made in the color, design, graphics or any other component to create a unique layout.

Fashion Marketing And Advertisement Analysis Dashboard Ppt PowerPoint Presentation Gallery Topics PDF
This slide defines the dashboard for fashion marketing and Advertisement revenue analysis . It includes information related to the revenue, sales, brands and gender breakdown. Pitch your topic with ease and precision using this Fashion Marketing And Advertisement Analysis Dashboard Ppt PowerPoint Presentation Gallery Topics PDF. This layout presents information on Total Revenue, Total Brands, Total Sales. It is also available for immediate download and adjustment. So, changes can be made in the color, design, graphics or any other component to create a unique layout.
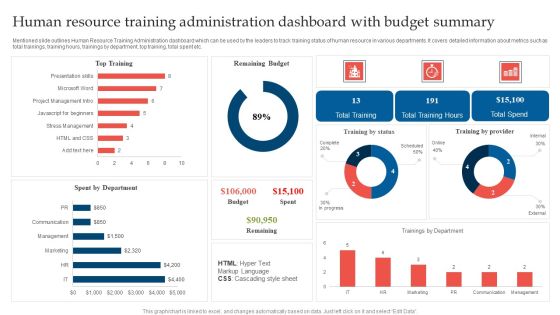
Human Resource Training Administration Dashboard With Budget Summary Microsoft PDF
Mentioned slide outlines Human Resource Training Administration dashboard which can be used by the leaders to track training status of human resource in various departments. It covers detailed information about metrics such as total trainings, training hours, trainings by department, top training, total spent etc. Showcasing this set of slides titled Human Resource Training Administration Dashboard With Budget Summary Microsoft PDF. The topics addressed in these templates are Remaining Budget, Top Training, Spent Department. All the content presented in this PPT design is completely editable. Download it and make adjustments in color, background, font etc. as per your unique business setting.

Kpi Dashboard Highlighting Results Of Human Resource Training Administration Background PDF
Mentioned slide outlines a dashboard through which the organization can track and evaluate the results of Human Resource Training Administration. It provides information about metrics such as training budget, total cost, cost per participant, total hours of training, etc. Showcasing this set of slides titled Kpi Dashboard Highlighting Results Of Human Resource Training Administration Background PDF. The topics addressed in these templates are Actual Cost Vs, Training Budget, Approved Training Budget, Online Training. All the content presented in this PPT design is completely editable. Download it and make adjustments in color, background, font etc. as per your unique business setting.
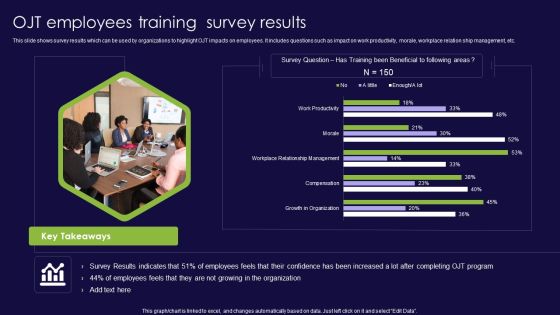
OJT Employees Training Survey Results Ppt PowerPoint Presentation File Master Slide PDF
This slide shows survey results which can be used by organizations to highlight OJT impacts on employees. It includes questions such as impact on work productivity, morale, workplace relation ship management, etc. Pitch your topic with ease and precision using this OJT Employees Training Survey Results Ppt PowerPoint Presentation File Master Slide PDF. This layout presents information on Growth Organization, Compensation, Workplace Relationship Management. It is also available for immediate download and adjustment. So, changes can be made in the color, design, graphics or any other component to create a unique layout.
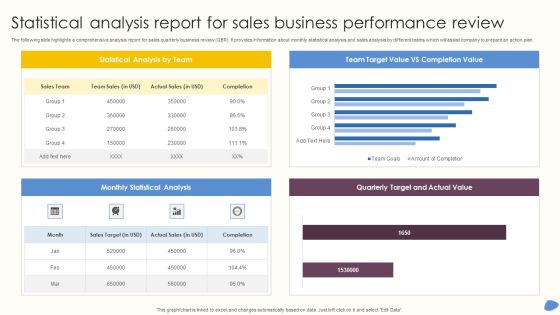
Statistical Analysis Report For Sales Business Performance Review Background PDF
The following slide highlights a comprehensive analysis report for sales quarterly business review QBR. It provides information about monthly statistical analysis and sales analysis by different teams which will assist company to prepare an action plan. Showcasing this set of slides titled Statistical Analysis Report For Sales Business Performance Review Background PDF. The topics addressed in these templates are Team Target, Quarterly Target, Monthly Statistical Analysis, Statistical Analysis Team. All the content presented in this PPT design is completely editable. Download it and make adjustments in color, background, font etc. as per your unique business setting.

Key Trends Dashboard Required For Human Resources Strategic Plan Information PDF
The given slide illustrates a checklist for employee welfare and wellness. It includes activities such as designing schedule, keeping yourself physically fit, developing a social network etc. Showcasing this set of slides titled Key Trends Dashboard Required For Human Resources Strategic Plan Information PDF. The topics addressed in these templates are Organizational Cultural Management, Engaging Workforce, Talent Retention. All the content presented in this PPT design is completely editable. Download it and make adjustments in color, background, font etc. as per your unique business setting.

Commercial Marketing KPI With Monthly And Daily Lead Breakdown Ideas PDF
This template slide covers about lead generated by organization on daily and monthly basis by different region. Further, it covers about customer engagement by different social media channels. Pitch your topic with ease and precision using this Commercial Marketing KPI With Monthly And Daily Lead Breakdown Ideas PDF. This layout presents information on Conversion Metrics, Quality Trial, Lead Breakdown. It is also available for immediate download and adjustment. So, changes can be made in the color, design, graphics or any other component to create a unique layout.
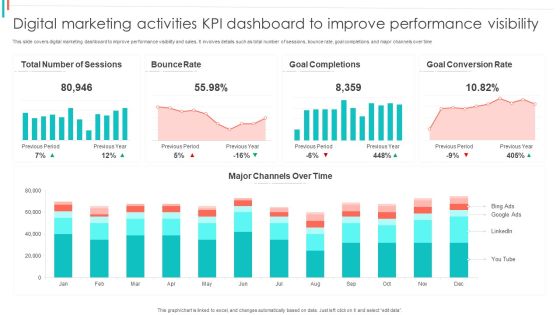
Digital Marketing Activities KPI Dashboard To Improve Performance Visibility Summary PDF
This slide covers digital marketing dashboard to improve performance visibility and sales. It involves details such as total number of sessions, bounce rate, goal completions and major channels over time.Showcasing this set of slides titled Digital Marketing Activities KPI Dashboard To Improve Performance Visibility Summary PDF. The topics addressed in these templates are Bounce Rate, Goal Completions, Goal Conversion. All the content presented in this PPT design is completely editable. Download it and make adjustments in color, background, font etc. as per your unique business setting.

Ecommerce Marketing Activities KPI Dashboard To Analyse Performance Guidelines PDF
This slide covers ecommerce marketing KPI dashboard to track performance. It involves details such as ecommerce revenue generated, number of new customers, repeat buying rate, attribute revenue and conversion rate and attributed revenue and conversion rate by marketing channel.Pitch your topic with ease and precision using this Ecommerce Marketing Activities KPI Dashboard To Analyse Performance Guidelines PDF. This layout presents information on Revenue Generated, Ecommerce Revenue, Generate Conversion. It is also available for immediate download and adjustment. So, changes can be made in the color, design, graphics or any other component to create a unique layout.
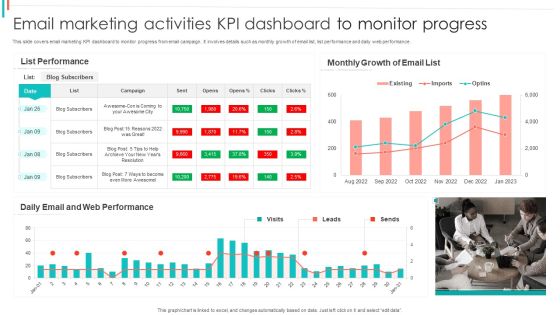
Email Marketing Activities KPI Dashboard To Monitor Progress Pictures PDF
This slide covers email marketing KPI dashboard to monitor progress from email campaign. It involves details such as monthly growth of email list, list performance and daily web performance.Showcasing this set of slides titled Email Marketing Activities KPI Dashboard To Monitor Progress Pictures PDF. The topics addressed in these templates are List Performance, Monthly Growth, Web Performance. All the content presented in this PPT design is completely editable. Download it and make adjustments in color, background, font etc. as per your unique business setting.

Online Marketing Activities KPI Dashboard To Improve Sales Ideas PDF
This slide covers online marketing dashboard to improve sales. It involves details such as web performance, conversion funnel, revenue this month, traffic sources and number of followers on social media.Pitch your topic with ease and precision using this Online Marketing Activities KPI Dashboard To Improve Sales Ideas PDF. This layout presents information on Email Performance, Web Performance, Cost Conversion. It is also available for immediate download and adjustment. So, changes can be made in the color, design, graphics or any other component to create a unique layout.
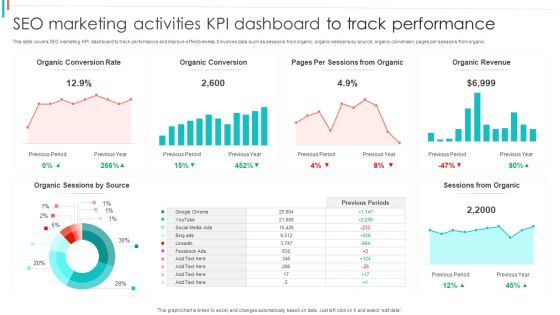
SEO Marketing Activities KPI Dashboard To Track Performance Brochure PDF
This slide covers SEO marketing KPI dashboard to track performance and improve effectiveness. It involves data such as sessions from organic, organic sessions by source, organic conversion, pages per sessions from organic.Pitch your topic with ease and precision using this SEO Marketing Activities KPI Dashboard To Track Performance Brochure PDF. This layout presents information on Organic Conversion, Sessions Organic, Organic Revenue. It is also available for immediate download and adjustment. So, changes can be made in the color, design, graphics or any other component to create a unique layout.

SEO Marketing Activities KPI Dashboard With Major Leads Formats PDF
This slide covers CMO marketing KPI dashboard to improve performance visibility of marketing. It involves details such as conversion metrics, quality of trial leads, engagement from social media and top channels.Showcasing this set of slides titled SEO Marketing Activities KPI Dashboard With Major Leads Formats PDF. The topics addressed in these templates are Conversion Metrics, Media Engagement, Conversion Rate. All the content presented in this PPT design is completely editable. Download it and make adjustments in color, background, font etc. as per your unique business setting.

Four Year Company Sales Unsatisfactory Performance Demonstration PDF
This slide covers the data on the performance of sales department of the company to have a clear idea about the revenues. It shows decrease in the number of sales in the last 4 years 2020 to 2023 which leads in degrading companys reputation and loss of stakeholders.Showcasing this set of slides titled Four Year Company Sales Unsatisfactory Performance Demonstration PDF. The topics addressed in these templates are Declining Sales, Restrictions, Insights. All the content presented in this PPT design is completely editable. Download it and make adjustments in color, background, font etc. as per your unique business setting.
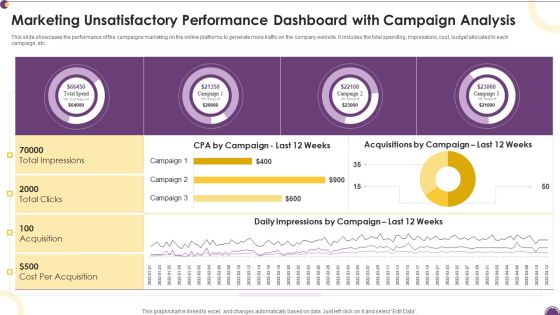
Marketing Unsatisfactory Performance Dashboard With Campaign Analysis Information PDF
This slide showcases the performance of the campaigns marketing on the online platforms to generate more traffic on the company website. It includes the total spending, impressions, cost, budget allocated to each campaign, etc.Pitch your topic with ease and precision using this Marketing Unsatisfactory Performance Dashboard With Campaign Analysis Information PDF. This layout presents information on Cost Acquisition, Total Clicks, Total Impressions. It is also available for immediate download and adjustment. So, changes can be made in the color, design, graphics or any other component to create a unique layout.

Comparative Analysis Of Major Players In Global Automotive Industry Cont Topics PDF
This slide covers a comparative assessment of key manufacturers of the worldwide automobile industry. It includes comparison on basis of cars sold, countries, dealerships, manufacturing facilities, vehicles delivered, produced, shipped, sold, wholesale vehicles sold, funding raised, etc. Deliver an awe inspiring pitch with this creative Comparative Analysis Of Major Players In Global Automotive Industry Cont Topics PDF bundle. Topics like Manufacturing Facilities, Vehicles Produced, Vehicles Shipped can be discussed with this completely editable template. It is available for immediate download depending on the needs and requirements of the user.
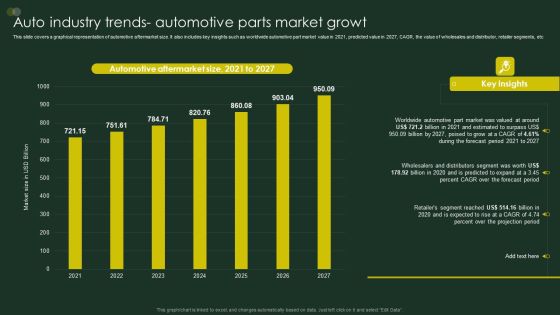
Global Automobile Sector Overview Auto Industry Trends Automotive Parts Market Growt Topics PDF
This slide covers a graphical representation of automotive aftermarket size. It also includes key insights such as worldwide automotive part market value in 2021, predicted value in 2027, CAGR, the value of wholesales and distributor, retailer segments, etc.Deliver an awe inspiring pitch with this creative Global Automobile Sector Overview Auto Industry Trends Automotive Parts Market Growt Topics PDF bundle. Topics like Automotive Aftermarket, Worldwide Automotive, Distributors Segment can be discussed with this completely editable template. It is available for immediate download depending on the needs and requirements of the user.

Global Automobile Sector Overview Auto Industry Trends Increasing Connected Cars Market Professional PDF
This slide covers a graphical representation of the global connected car market size. It includes key insights about the growth of 5G and IOT, implementation of severe safety rules, high-end and luxury vehicles, etc.Deliver and pitch your topic in the best possible manner with this Global Automobile Sector Overview Auto Industry Trends Increasing Connected Cars Market Professional PDF. Use them to share invaluable insights on Global Connected, Estimates Through, Demand Connected and impress your audience. This template can be altered and modified as per your expectations. So, grab it now.

Global Automobile Sector Overview Auto Industry Trends Increasing Online Carbuying Market Demonstration PDF
This slide covers a graphical representation of worldwide online vehicle sales. It also includes key insights about projected market reach and CAGR by 2030, major identified players in the online car buying market, etc. Deliver an awe inspiring pitch with this creative Global Automobile Sector Overview Auto Industry Trends Increasing Online Carbuying Market Demonstration PDF bundle. Topics like Automotive Group, Cox Automotive, Market Include can be discussed with this completely editable template. It is available for immediate download depending on the needs and requirements of the user.
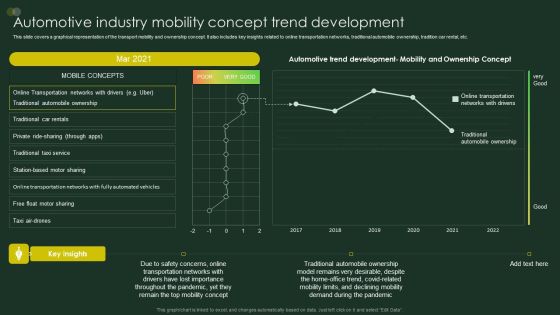
Global Automobile Sector Overview Automotive Industry Mobility Concept Trend Development Elements PDF
This slide covers a graphical representation of the transport mobility and ownership concept. It also includes key insights related to online transportation networks, traditional automobile ownership, tradition car rental, etc. Deliver and pitch your topic in the best possible manner with this Global Automobile Sector Overview Automotive Industry Mobility Concept Trend Development Elements PDF. Use them to share invaluable insights on Transportation Networks, Throughout Pandemic, Traditional Automobile and impress your audience. This template can be altered and modified as per your expectations. So, grab it now.

Global Automobile Sector Overview Electric Vehicle Sales Growth In California And The US Slides PDF
This slide covers a graphical representation of EV sales in the United States and California. It also includes key insights about Californias 2022 Q1 sales in comparison to 2021 Q4, increased fuel costs and large super bowl EV ad, etc. Deliver and pitch your topic in the best possible manner with this Global Automobile Sector Overview Electric Vehicle Sales Growth In California And The US Slides PDF. Use them to share invaluable insights on Increased Fuel, Drive Deliveries, Record Amount and impress your audience. This template can be altered and modified as per your expectations. So, grab it now.

Global Automobile Sector Overview Global Electric Vehicle Sales With Market Share In 2021 Designs PDF
This slide covers the graphical representation of the global EV market share along with BEV and PHEV sales. It also includes key insights about the global plugin electric car sales, chinas share in global EV sales, etc. Deliver and pitch your topic in the best possible manner with this Global Automobile Sector Overview Global Electric Vehicle Sales With Market Share In 2021 Designs PDF. Use them to share invaluable insights on Electric Vehicles, Battery Electric, Electric Vehicle and impress your audience. This template can be altered and modified as per your expectations. So, grab it now.
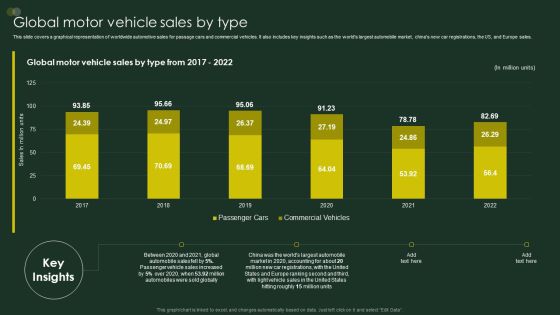
Global Automobile Sector Overview Global Motor Vehicle Sales By Type Mockup PDF
This slide covers a graphical representation of worldwide automotive sales for passage cars and commercial vehicles. It also includes key insights such as the worlds largest automobile market, chinas new car registrations, the US, and Europe sales. Deliver an awe inspiring pitch with this creative Global Automobile Sector Overview Global Motor Vehicle Sales By Type Mockup PDF bundle. Topics like Automobile Sales, Automobiles Were, Hitting Roughly can be discussed with this completely editable template. It is available for immediate download depending on the needs and requirements of the user.
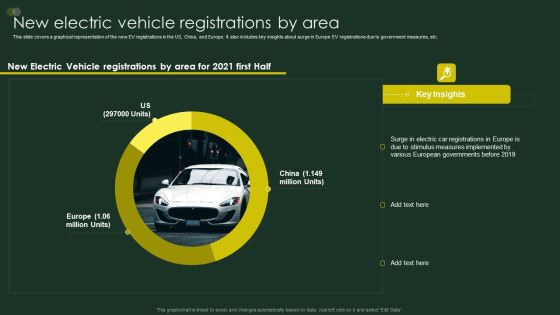
Global Automobile Sector Overview New Electric Vehicle Registrations By Area Demonstration PDF
This slide covers a graphical representation of the new EV registrations in the US, China, and Europe. It also includes key insights about surge in Europe EV registrations due to government measures, etc. Deliver an awe inspiring pitch with this creative Global Automobile Sector Overview New Electric Vehicle Registrations By Area Demonstration PDF bundle. Topics like Electric Vehicle, Registrations Area, European Governments can be discussed with this completely editable template. It is available for immediate download depending on the needs and requirements of the user.
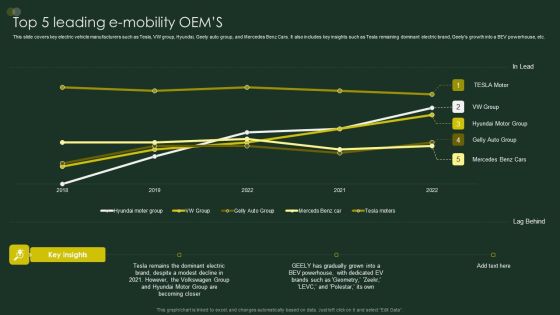
Global Automobile Sector Overview Top 5 Leading E Mobility OEMS Summary PDF
This slide covers key electric vehicle manufacturers such as Tesla, VW group, Hyundai, Geely auto group, and Mercedes Benz Cars. It also includes key insights such as Tesla remaining dominant electric brand, Geelys growth into a BEV powerhouse, etc. Deliver an awe inspiring pitch with this creative Global Automobile Sector Overview Top 5 Leading E Mobility OEMS Summary PDF bundle. Topics like Tesla Remains, Dominant Electric, Gradually Grown can be discussed with this completely editable template. It is available for immediate download depending on the needs and requirements of the user.
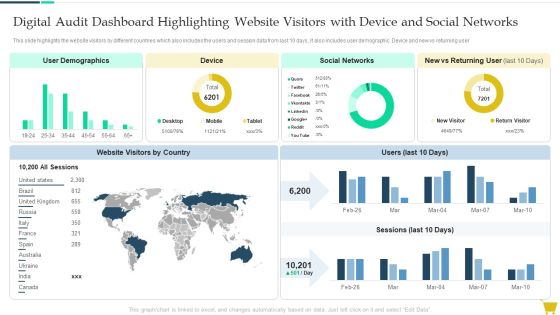
Digital Audit Dashboard Highlighting Website Visitors With Device And Social Networks Guidelines PDF
This slide highlights the website visitors by different countries which also includes the users and session data from last 10 days, it also includes user demographic. Device and new vs returning user. Deliver and pitch your topic in the best possible manner with this Digital Audit Dashboard Highlighting Website Visitors With Device And Social Networks Guidelines PDF. Use them to share invaluable insights on Device, Social Networks, User Demographics and impress your audience. This template can be altered and modified as per your expectations. So, grab it now.
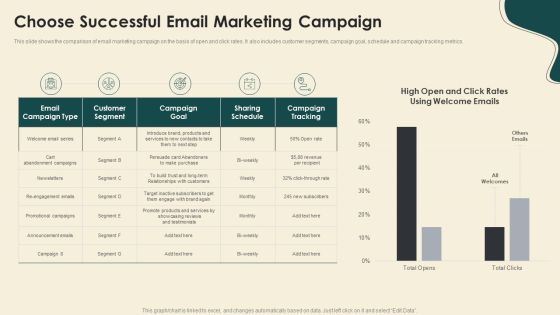
Digitally Streamline Automation Sales Operations Choose Successful Email Marketing Campaign Pictures PDF
This slide shows the comparison of email marketing campaign on the basis of open and click rates. It also includes customer segments, campaign goal, schedule and campaign tracking metrics. Deliver and pitch your topic in the best possible manner with this Digitally Streamline Automation Sales Operations Choose Successful Email Marketing Campaign Pictures PDF. Use them to share invaluable insights on Campaign Goal, Customer Segment, Target and impress your audience. This template can be altered and modified as per your expectations. So, grab it now.

B2B Market Segmentation Dashboard Microsoft PDF
This slide illustrates the market segmentation dashboard for B2B which can benefit them to improve the focus and boost the revenue of the organization. It includes segmentation based in company size and different industries under B2B market. Pitch your topic with ease and precision using this B2B Market Segmentation Dashboard Microsoft PDF. This layout presents information on Industries, Market Segmentation, Service. It is also available for immediate download and adjustment. So, changes can be made in the color, design, graphics or any other component to create a unique layout.
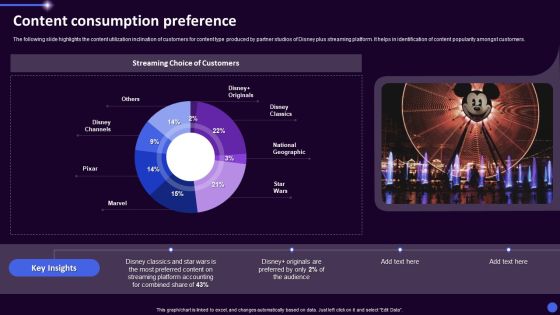
Disney Plus OTT Platform Company Summary Content Consumption Preference Ppt Portfolio Summary PDF
The following slide highlights the content utilization inclination of customers for content type produced by partner studios of Disney plus streaming platform. It helps in identification of content popularity amongst customers. Deliver an awe inspiring pitch with this creative Disney Plus OTT Platform Company Summary Content Consumption Preference Ppt Portfolio Summary PDF bundle. Topics like Streaming Choice, Customers, Disney Classics, National Geographic can be discussed with this completely editable template. It is available for immediate download depending on the needs and requirements of the user.
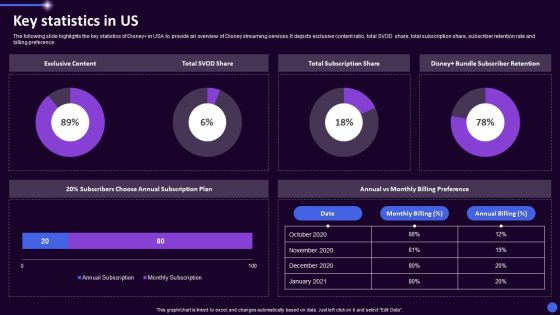
Disney Plus OTT Platform Company Summary Key Statistics In Us Ppt Ideas Backgrounds PDF
The following slide highlights the key statistics of Disney in USA to provide an overview of Disney streaming services. It depicts exclusive content ratio, total SVOD share, total subscription share, subscriber retention rate and billing preference. Deliver an awe inspiring pitch with this creative Disney Plus OTT Platform Company Summary Key Statistics In Us Ppt Ideas Backgrounds PDF bundle. Topics like Exclusive Content, Total SVOD Share, Total Subscription Share can be discussed with this completely editable template. It is available for immediate download depending on the needs and requirements of the user.
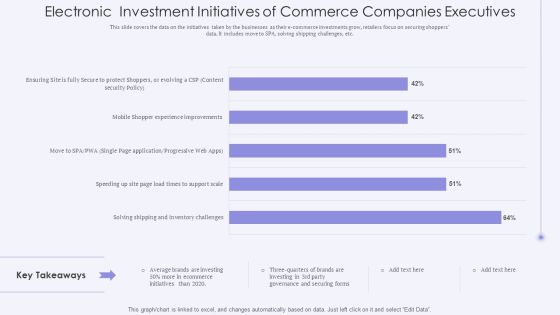
Electronic Investment Initiatives Of Commerce Companies Executives Professional PDF
This slide covers the data on the initiatives taken by the businesses as their e commerce investments grow, retailers focus on securing shoppers data. It includes move to SPA, solving shipping challenges, etc. Showcasing this set of slides titled Electronic Investment Initiatives Of Commerce Companies Executives Professional PDF. The topics addressed in these templates are Ecommerce, Investing, Average. All the content presented in this PPT design is completely editable. Download it and make adjustments in color, background, font etc. as per your unique business setting.

CRM System Implementation Stages CRM Dashboard For Tracking Sales Pipeline Background PDF
This slide covers the CRM KPI dashboard for monitoring lead status in the sales funnel. It includes metrics such as open pipeline value, open pipeline by product package, pipeline value forecast, etc. Deliver and pitch your topic in the best possible manner with this CRM System Implementation Stages CRM Dashboard For Tracking Sales Pipeline Background PDF. Use them to share invaluable insights on Pipeline Value, Value Forecast, Sales Opportunities and impress your audience. This template can be altered and modified as per your expectations. So, grab it now.

CRM System Implementation Stages Postimplementation Impacts On Company Sales Graphics PDF
This slide covers the forecasted impacts of deploying CRM systems in the organization. It includes outcomes such as increase in sales, increases in sales team productivity, increased rates of customer retention and satisfaction, return on investment, and shortened sales cycle. Deliver an awe inspiring pitch with this creative CRM System Implementation Stages Postimplementation Impacts On Company Sales Graphics PDF bundle. Topics like Data Accessibility, Team Productivity, Increase In Sales can be discussed with this completely editable template. It is available for immediate download depending on the needs and requirements of the user.
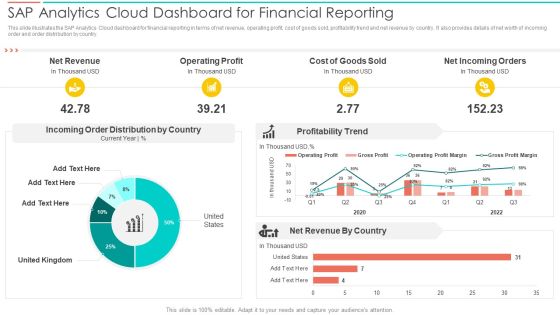
SAC Planning And Implementation SAP Analytics Cloud Dashboard For Financial Reporting Introduction PDF
This slide illustrates the SAP Analytics Cloud dashboard for financial reporting in terms of net revenue, operating profit, cost of goods sold, profitability trend and net revenue by country. It also provides details of net worth of incoming order and order distribution by country. Deliver an awe inspiring pitch with this creative SAC Planning And Implementation SAP Analytics Cloud Dashboard For Financial Reporting Introduction PDF bundle. Topics like Net Revenue, Operating Profit, Cost Goods Sold can be discussed with this completely editable template. It is available for immediate download depending on the needs and requirements of the user.
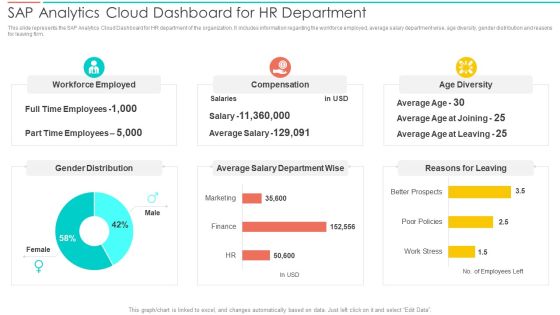
SAC Planning And Implementation SAP Analytics Cloud Dashboard For Hr Department Inspiration PDF
This slide represents the SAP Analytics Cloud Dashboard for HR department of the organization. It includes information regarding the workforce employed, average salary department wise, age diversity, gender distribution and reasons for leaving firm. Deliver and pitch your topic in the best possible manner with this SAC Planning And Implementation SAP Analytics Cloud Dashboard For Hr Department Inspiration PDF. Use them to share invaluable insights on Workforce Employed, Compensation, Age Diversity and impress your audience. This template can be altered and modified as per your expectations. So, grab it now.
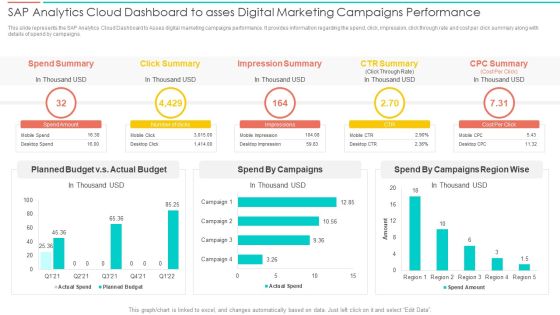
SAC Planning And Implementation SAP Analytics Cloud Dashboard To Asses Digital Marketing Pictures PDF
This slide represents the SAP Analytics Cloud Dashboard to Asses digital marketing campaigns performance. It provides information regarding the spend, click, impression, click through rate and cost per click summary along with details of spend by campaigns. Deliver an awe inspiring pitch with this creative SAC Planning And Implementation SAP Analytics Cloud Dashboard To Asses Digital Marketing Pictures PDF bundle. Topics like Spend Summary, Click Summary, Impression Summary, CTR Summary can be discussed with this completely editable template. It is available for immediate download depending on the needs and requirements of the user.

Sales Procedure Automation To Enhance Sales Choose Successful Email Marketing Campaign Summary PDF
This slide shows the comparison of email marketing campaign on the basis of open and click rates. It also includes customer segments, campaign goal, schedule and campaign tracking metrics.Deliver and pitch your topic in the best possible manner with this Sales Procedure Automation To Enhance Sales Choose Successful Email Marketing Campaign Summary PDF. Use them to share invaluable insights on Customer Segment, Promotional Campaigns, Announcement and impress your audience. This template can be altered and modified as per your expectations. So, grab it now.

Client Coverage Through Marketing Methods Ppt Inspiration Maker PDF
This slide displays the percentages of the amount of customers that are acquired by using these marketing methods. It includes influencer marketing, social media, guest blogging, paid distribution, etc. Pitch your topic with ease and precision using this Client Coverage Through Marketing Methods Ppt Inspiration Maker PDF. This layout presents information on Influencer Marketing, Paid Distribution, Social Media. It is also available for immediate download and adjustment. So, changes can be made in the color, design, graphics or any other component to create a unique layout.

ISO 27001 Organizational Qualifying Procedure Dashboard For Information Security Risk Management Background PDF
This slide displays dashboard for information security risk management. It includes KPIs such as risk analysis progress, persent risk, response progress for risks and number of risks encountered.Deliver and pitch your topic in the best possible manner with this ISO 27001 Organizational Qualifying Procedure Dashboard For Information Security Risk Management Background PDF. Use them to share invaluable insights on Analysis Progress, Response Progress, Plan Breakdown and impress your audience. This template can be altered and modified as per your expectations. So, grab it now.
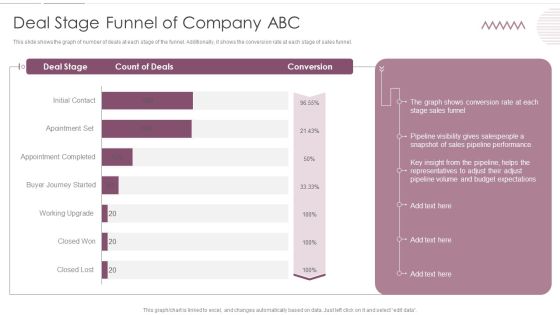
Sales Management Pipeline For Effective Lead Generation Deal Stage Funnel Of Company ABC Inspiration PDF
This slide shows the graph of number of deals at each stage of the funnel. Additionally, it shows the conversion rate at each stage of sales funnel. Deliver and pitch your topic in the best possible manner with this Sales Management Pipeline For Effective Lead Generation Deal Stage Funnel Of Company ABC Inspiration PDF. Use them to share invaluable insights on Pipeline Performance, Sales Funnel, Budget Expectations and impress your audience. This template can be altered and modified as per your expectations. So, grab it now.
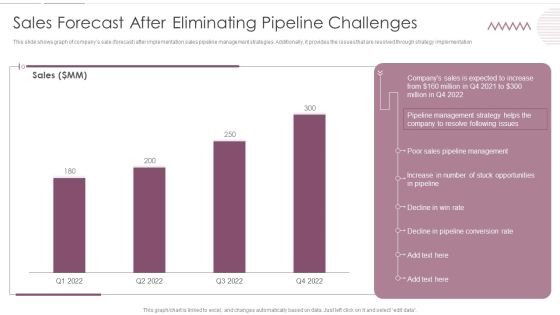
Sales Management Pipeline For Effective Lead Generation Sales Forecast After Eliminating Pipeline Challenges Inspiration PDF
This slide shows graph of companys sale forecast after implementation sales pipeline management strategies. Additionally, it provides the issues that are resolved through strategy implementation. Deliver and pitch your topic in the best possible manner with this Sales Management Pipeline For Effective Lead Generation Sales Forecast After Eliminating Pipeline Challenges Inspiration PDF. Use them to share invaluable insights on Sales Pipeline Management, Opportunities, Pipeline Conversion Rate and impress your audience. This template can be altered and modified as per your expectations. So, grab it now.

Logistics Shipment Company Profile CSR Support For Sustainable Growth Ppt Show Templates PDF
The slide highlights the CSR support for society and spend distribution for current year. It depicts poverty support, quench hunger, health support, quality education, clean drinking water, gender equality, others, clean energy, global warming and clean ocean drive. Deliver an awe inspiring pitch with this creative Logistics Shipment Company Profile CSR Support For Sustainable Growth Ppt Show Templates PDF bundle. Topics like CSR Spend 2022, Poverty Support, Quench Hunger, Health Support can be discussed with this completely editable template. It is available for immediate download depending on the needs and requirements of the user.
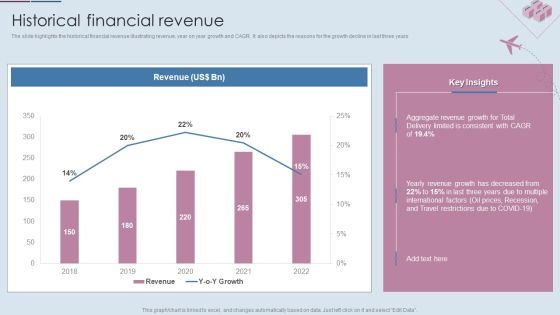
Logistics Shipment Company Profile Historical Financial Revenue Ppt Gallery Templates PDF
The slide highlights the historical financial revenue illustrating revenue, year on year growth and CAGR. It also depicts the reasons for the growth decline in last three years. Deliver and pitch your topic in the best possible manner with this Logistics Shipment Company Profile Historical Financial Revenue Ppt Gallery Templates PDF. Use them to share invaluable insights on Revenue, 2018 To 2022, Aggregate Revenue Growth and impress your audience. This template can be altered and modified as per your expectations. So, grab it now.
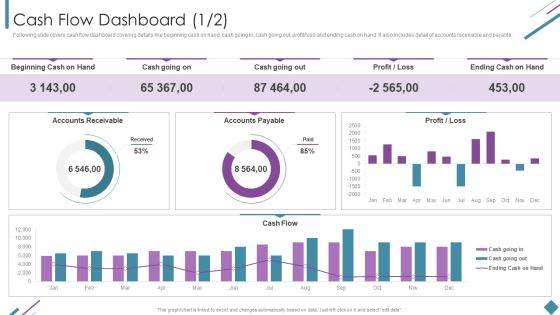
Metrics To Measure Business Performance Cash Flow Dashboard Rules PDF
Following slide covers cash flow dashboard covering details like beginning cash on hand, cash going in, cash going out, profit or loss and ending cash on hand. It also includes detail of accounts receivable and payable. Deliver an awe inspiring pitch with this creative Metrics To Measure Business Performance Cash Flow Dashboard Rules PDF bundle. Topics like Beginning Cash Hand, Cash Going Out, Accounts Payable, Accounts Receivable can be discussed with this completely editable template. It is available for immediate download depending on the needs and requirements of the user.
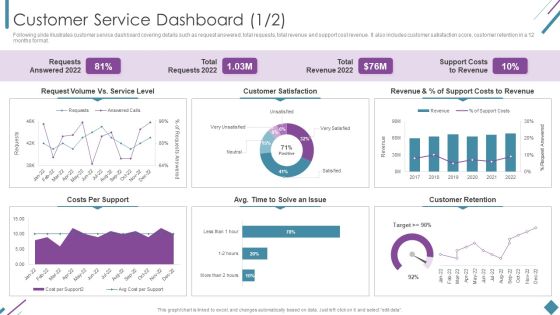
Metrics To Measure Business Performance Customer Service Dashboard Sample PDF
Following slide illustrates customer service dashboard covering details such as request answered, total requests, total revenue and support cost revenue. It also includes customer satisfaction score, customer retention in a 12 months format. Deliver and pitch your topic in the best possible manner with this Metrics To Measure Business Performance Customer Service Dashboard Sample PDF. Use them to share invaluable insights on Requests Answered 2022, Total Requests 2022, Total Revenue 2022 and impress your audience. This template can be altered and modified as per your expectations. So, grab it now.
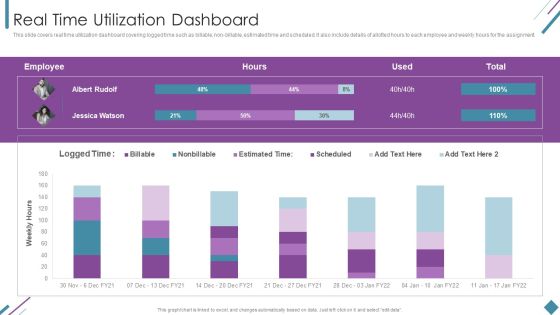
Metrics To Measure Business Performance Real Time Utilization Dashboard Topics PDF
This slide covers real time utilization dashboard covering logged time such as billable, non-billable, estimated time and scheduled. It also include details of allotted hours to each employee and weekly hours for the assignment. Deliver an awe inspiring pitch with this creative Metrics To Measure Business Performance Real Time Utilization Dashboard Topics PDF bundle. Topics like Weekly Hours, Employee, Estimated Time can be discussed with this completely editable template. It is available for immediate download depending on the needs and requirements of the user.
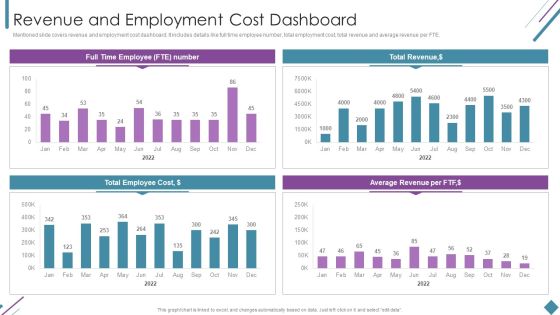
Metrics To Measure Business Performance Revenue And Employment Cost Dashboard Clipart PDF
Mentioned slide covers revenue and employment cost dashboard. It includes details like full time employee number, total employment cost, total revenue and average revenue per FTE. Deliver and pitch your topic in the best possible manner with this Metrics To Measure Business Performance Revenue And Employment Cost Dashboard Clipart PDF. Use them to share invaluable insights on Total Revenue, Average Revenue Per, Total Employee Cost and impress your audience. This template can be altered and modified as per your expectations. So, grab it now.

Dashboard For Education Institutes With Student Retention Metrics Slides PDF
This slide covers dashboard for tracking student and faculty members details. It include metrics such as faculty to student ratio, student attendance rate, faculty retention rate, student enrollment details, examination results overview, etc. Showcasing this set of slides titled Dashboard For Education Institutes With Student Retention Metrics Slides PDF. The topics addressed in these templates are Student Enrollment Details, Examination Results Overview, Faculty Student Ratio. All the content presented in this PPT design is completely editable. Download it and make adjustments in color, background, font etc. as per your unique business setting.
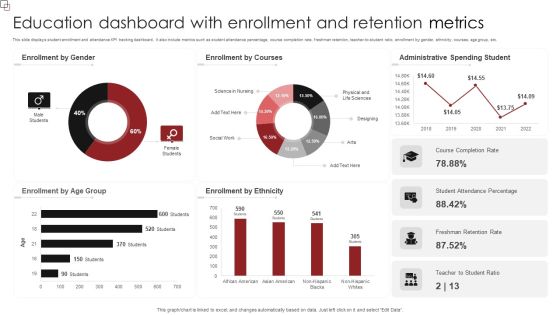
Education Dashboard With Enrollment And Retention Metrics Sample PDF
This slide displays student enrollment and attendance KPI tracking dashboard. It also include metrics such as student attendance percentage, course completion rate, freshman retention, teacher-to-student ratio, enrollment by gender, ethnicity, courses, age group, etc. Pitch your topic with ease and precision using this Education Dashboard With Enrollment And Retention Metrics Sample PDF. This layout presents information on Enrollment Gender, Enrollment Courses, Administrative Spending Student. It is also available for immediate download and adjustment. So, changes can be made in the color, design, graphics or any other component to create a unique layout.

Education Dashboard With Fees Collection And Expense Metrics Demonstration PDF
This slide covers education key performance indicators tracking dashboard. It also include metrics such as total students, teachers, parents, total earrings, social media followers, event calendar, fees collection, and expenses. Showcasing this set of slides titled Education Dashboard With Fees Collection And Expense Metrics Demonstration PDF. The topics addressed in these templates are Event Calender, Annual Holidays, Fees Collection, Expenses. All the content presented in this PPT design is completely editable. Download it and make adjustments in color, background, font etc. as per your unique business setting.
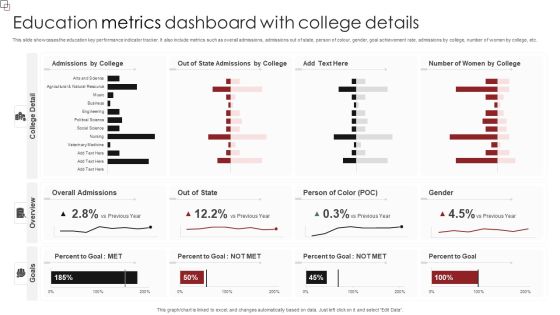
Education Metrics Dashboard With College Details Formats PDF
This slide showcases the education key performance indicator tracker. It also include metrics such as overall admissions, admissions out of state, person of colour, gender, goal achievement rate, admissions by college, number of women by college, etc. Pitch your topic with ease and precision using this Education Metrics Dashboard With College Details Formats PDF. This layout presents information on Overall Admissions, Person Of Color, Percent To Goal. It is also available for immediate download and adjustment. So, changes can be made in the color, design, graphics or any other component to create a unique layout.
Education Metrics Tracker For Students Performance Evaluation Professional PDF
This slide covers student performance analysis dashboard. It include metrics student count, student attendance, average subject score, branch examination results, student count by grade, etc. Showcasing this set of slides titled Education Metrics Tracker For Students Performance Evaluation Professional PDF. The topics addressed in these templates are Students Count, Grade And Gender, Students Details, Examination Results Branch. All the content presented in this PPT design is completely editable. Download it and make adjustments in color, background, font etc. as per your unique business setting.

Education Scorecard With Division Based Enrolment Metrics Professional PDF
This slide showcases dashboard for tracking student enrollment in a district. It include metrics such as student-teacher ratio, enrolment by gender, education assessment score, detention by school type, etc. Pitch your topic with ease and precision using this Education Scorecard With Division Based Enrolment Metrics Professional PDF. This layout presents information on Education Assessment Score, Enrollment Gender. It is also available for immediate download and adjustment. So, changes can be made in the color, design, graphics or any other component to create a unique layout.

Actual Vs Budgeted Expenses Graph For Human Resource Activities Guidelines PDF
This slide showcases graph that can help organization to compare the actual and budgeted expenses incurred in conducting human resource activities. Its key components are workplace safety, labour relations, recruitment and employee health. Showcasing this set of slides titled Actual Vs Budgeted Expenses Graph For Human Resource Activities Guidelines PDF. The topics addressed in these templates are Safety Equipment Webinars, Employee, Expenses. All the content presented in this PPT design is completely editable. Download it and make adjustments in color, background, font etc. as per your unique business setting.

Graph For Global Human Resource Employees Salary Trends Demonstration PDF
This slide showcases graph that can help to study the salary trends of HR employees and formulate compensation strategies according to industry standards. Its key components are minimum, average and maximum salary. Showcasing this set of slides titled Graph For Global Human Resource Employees Salary Trends Demonstration PDF. The topics addressed in these templates are Global Human Resource, Employees Salary Trends. All the content presented in this PPT design is completely editable. Download it and make adjustments in color, background, font etc. as per your unique business setting.
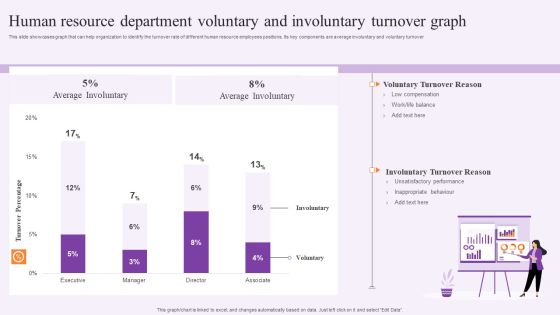
Human Resource Department Voluntary And Involuntary Turnover Graph Summary PDF
This slide showcases graph that can help organization to identify the turnover rate of different human resource employees positions. Its key components are average involuntary and voluntary turnover. Pitch your topic with ease and precision using this Human Resource Department Voluntary And Involuntary Turnover Graph Summary PDF. This layout presents information on Executive, Voluntary Turnover Reason, Average Involuntary. It is also available for immediate download and adjustment. So, changes can be made in the color, design, graphics or any other component to create a unique layout.
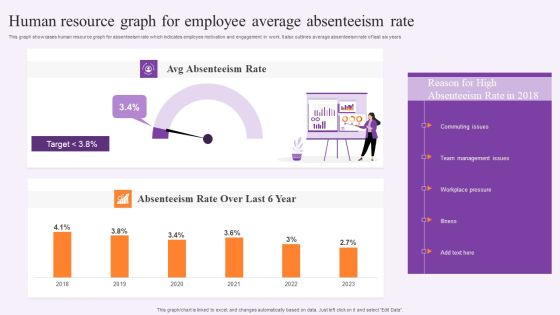
Human Resource Graph For Employee Average Absenteeism Rate Information PDF
This graph showcases human resource graph for absenteeism rate which indicates employee motivation and engagement in work. It also outlines average absenteeism rate of last six years. Showcasing this set of slides titled Human Resource Graph For Employee Average Absenteeism Rate Information PDF. The topics addressed in these templates are Team Management Issues, Workplace Pressure, Absenteeism Rate. All the content presented in this PPT design is completely editable. Download it and make adjustments in color, background, font etc. as per your unique business setting.
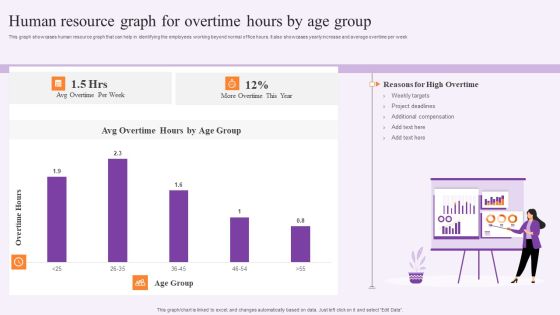
Human Resource Graph For Overtime Hours By Age Group Rules PDF
This graph showcases human resource graph that can help in identifying the employees working beyond normal office hours. It also showcases yearly increase and average overtime per week. Pitch your topic with ease and precision using this Human Resource Graph For Overtime Hours By Age Group Rules PDF. This layout presents information on Weekly Targets, Project Deadlines. It is also available for immediate download and adjustment. So, changes can be made in the color, design, graphics or any other component to create a unique layout.

Human Resource Graph To Compare Yearly Employee Count By Department Professional PDF
This slide showcases graph that can help organization to compare the yearly change in employees numbers of different departments. It showcases comparison for a period of two years. Showcasing this set of slides titled Human Resource Graph To Compare Yearly Employee Count By Department Professional PDF. The topics addressed in these templates are Marketing Department, Sales Department, Research Department. All the content presented in this PPT design is completely editable. Download it and make adjustments in color, background, font etc. as per your unique business setting.

Yearly Comparison Graph For Human Resource Employees Salary Template PDF
This slide showcases yearly comparison of salary of different employees in organization and identify the increment growth rate. It showcases comparative assessment for a period of 4 years. Pitch your topic with ease and precision using this Yearly Comparison Graph For Human Resource Employees Salary Template PDF. This layout presents information on Human Resource, Employees Salary. It is also available for immediate download and adjustment. So, changes can be made in the color, design, graphics or any other component to create a unique layout.

Quarterly Business Revenue Analysis Kpis Slides PDF
The following slide highlights the KPAs of revenue assessment to ascertain overall business performance and improve growth strategies. It includes KPIs such as total, actual versus budgeted quarter wise revenue, top customers etc. Showcasing this set of slides titled Quarterly Business Revenue Analysis Kpis Slides PDF. The topics addressed in these templates are Quarter Wise Revenue, Customers, Budgeted Quarter. All the content presented in this PPT design is completely editable. Download it and make adjustments in color, background, font etc. as per your unique business setting.

Quarterly Financial Performance Kpis With Balance Sheet Designs PDF
The given slide highlights the quarterly financial performance of a company. It also includes KPIs such as ROA, working capital ratio, return on equity, debt equity ratio etc. Pitch your topic with ease and precision using this Quarterly Financial Performance Kpis With Balance Sheet Designs PDF. This layout presents information on Total Liabilities, Return On Equity, Working Capital Ratio. It is also available for immediate download and adjustment. So, changes can be made in the color, design, graphics or any other component to create a unique layout.

Quarterly Marketing Performance Review Kpis Background PDF
The given below slide highlights the marketing insights to maximize the performance. It includes KPIs such as total marketing expenditure compared to target budget, total impressions, clicks, acquisitions, cost per acquisition etc. Showcasing this set of slides titled Quarterly Marketing Performance Review Kpis Background PDF. The topics addressed in these templates are Total Acquisitions, Cost Per Acquisition, Marketing Expenditure. All the content presented in this PPT design is completely editable. Download it and make adjustments in color, background, font etc. as per your unique business setting.

Quarterly Overall Business Performance Assessment With Kpi Dashboard Microsoft PDF
The given below slide showcases the overall business performance to evaluate the trends and KPAs. It includes quarterly insights of elements such as revenue, new customers, net profit, customer satisfaction, sales profitability, growth etc. Pitch your topic with ease and precision using this Quarterly Overall Business Performance Assessment With Kpi Dashboard Microsoft PDF. This layout presents information on Revenue, Customer Satisfaction, Net Profit. It is also available for immediate download and adjustment. So, changes can be made in the color, design, graphics or any other component to create a unique layout.
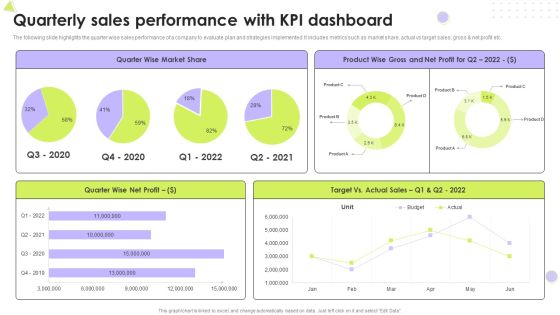
Quarterly Sales Performance With Kpi Dashboard Introduction PDF
The following slide highlights the quarter wise sales performance of a company to evaluate plan and strategies implemented. It includes metrics such as market share, actual vs target sales, gross and net profit etc. Pitch your topic with ease and precision using this Quarterly Sales Performance With Kpi Dashboard Introduction PDF. This layout presents information on Market Share, Net Profit, Target. It is also available for immediate download and adjustment. So, changes can be made in the color, design, graphics or any other component to create a unique layout.

Quarterly Sales Team Performance Analysis Kpis Slides PDF
The following slide depicts the efforts made my sales team in increasing companys growth. It also includes KPAs such as new customers acquired, sales, profit, average revenue per unit, customer lifetime value, acquisition cost etc. Showcasing this set of slides titled Quarterly Sales Team Performance Analysis Kpis Slides PDF. The topics addressed in these templates are Above Sales Target, Average Sales Revenue, Average Customer. All the content presented in this PPT design is completely editable. Download it and make adjustments in color, background, font etc. as per your unique business setting.
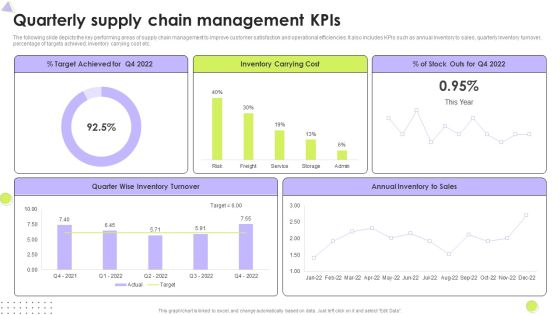
Quarterly Supply Chain Management Kpis Mockup PDF
The following slide depicts the key performing areas of supply chain management to improve customer satisfaction and operational efficiencies. It also includes KPIs such as annual inventory to sales, quarterly inventory turnover, percentage of targets achieved, inventory carrying cost etc. Pitch your topic with ease and precision using this Quarterly Supply Chain Management Kpis Mockup PDF. This layout presents information on Inventory Turnover, Inventory Carrying Cost, Target Achieved. It is also available for immediate download and adjustment. So, changes can be made in the color, design, graphics or any other component to create a unique layout.
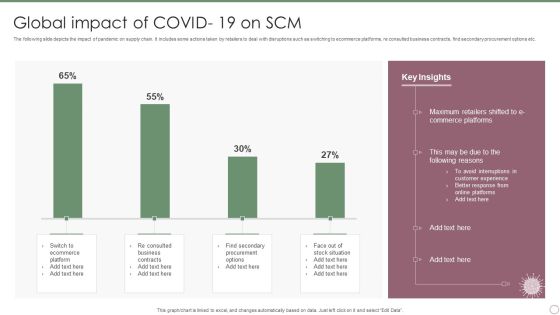
Global Impact Of COVID 19 On SCM Ppt PowerPoint Presentation File Sample PDF
The following slide depicts the impact of pandemic on supply chain. It includes some actions taken by retailers to deal with disruptions such as switching to ecommerce platforms, re consulted business contracts, find secondary procurement options etc. Showcasing this set of slides titled Global Impact Of COVID 19 On SCM Ppt PowerPoint Presentation File Sample PDF. The topics addressed in these templates are Maximum Retailers Shifted, Commerce Platforms, Customer Experience. All the content presented in this PPT design is completely editable. Download it and make adjustments in color, background, font etc. as per your unique business setting.
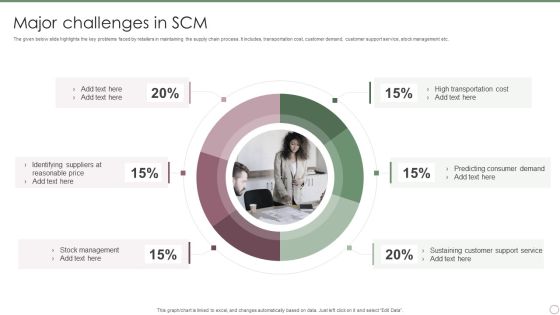
Major Challenges In SCM Ppt PowerPoint Presentation Gallery Pictures PDF
The given below slide highlights the key problems faced by retailers in maintaining the supply chain process. It includes, transportation cost, customer demand, customer support service, stock management etc. Pitch your topic with ease and precision using this Major Challenges In SCM Ppt PowerPoint Presentation Gallery Pictures PDF. This layout presents information on High Transportation Cost, Predicting Consumer Demand, Sustaining Customer, Support Service. It is also available for immediate download and adjustment. So, changes can be made in the color, design, graphics or any other component to create a unique layout.
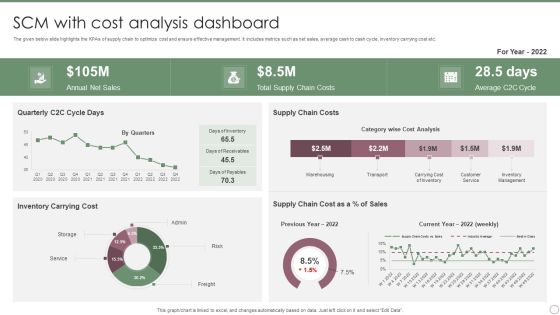
SCM With Cost Analysis Dashboard Ppt PowerPoint Presentation File Slides PDF
The given below slide highlights the KPAs of supply chain to optimize cost and ensure effective management. It includes metrics such as net sales, average cash to cash cycle, inventory carrying cost etc. Showcasing this set of slides titled SCM With Cost Analysis Dashboard Ppt PowerPoint Presentation File Slides PDF. The topics addressed in these templates are Annual Net Sales, Total Supply Chain, Costs, Average C2C Cycle. All the content presented in this PPT design is completely editable. Download it and make adjustments in color, background, font etc. as per your unique business setting.
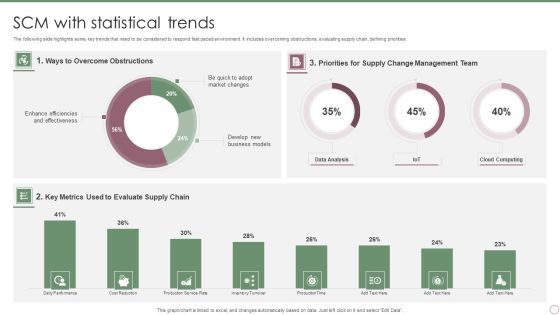
SCM With Statistical Trends Ppt PowerPoint Presentation Gallery Examples PDF
The following slide highlights some key trends that need to be considered to respond fast paced environment. It includes overcoming obstructions, evaluating supply chain, defining priorities. Pitch your topic with ease and precision using this SCM With Statistical Trends Ppt PowerPoint Presentation Gallery Examples PDF. This layout presents information on Ways To Overcome, Obstructions, Key Metrics, Evaluate Supply Chain. It is also available for immediate download and adjustment. So, changes can be made in the color, design, graphics or any other component to create a unique layout.

Positive Impact Post Successful Implementation Of Social Media Engagement Strategy Slides PDF
This slide shows major impact post implementing social media strategy for improved engagement. It provides information about organic reach, lead generation, average share per post, new page likes and followers, etc. Deliver and pitch your topic in the best possible manner with this Positive Impact Post Successful Implementation Of Social Media Engagement Strategy Slides PDF . Use them to share invaluable insights on Average, Organic Reach, Awareness and impress your audience. This template can be altered and modified as per your expectations. So, grab it now.
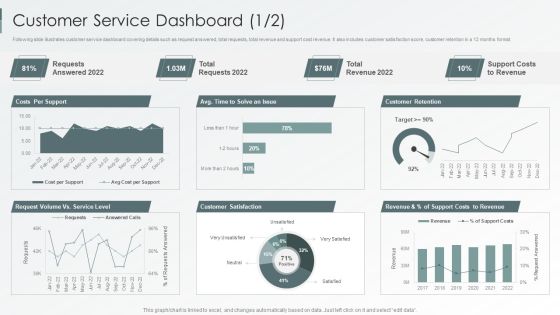
Enterprise Sustainability Performance Metrics Customer Service Dashboard Professional PDF
Following slide illustrates customer service dashboard covering details such as request answered, total requests, total revenue and support cost revenue. It also includes customer satisfaction score, customer retention in a 12 months format.Deliver and pitch your topic in the best possible manner with this Enterprise Sustainability Performance Metrics Customer Service Dashboard Professional PDF. Use them to share invaluable insights on Customer Satisfaction, Customer Retention, Support Revenue and impress your audience. This template can be altered and modified as per your expectations. So, grab it now.

Enterprise Sustainability Performance Metrics Employee Billable Hours Dashboard Information PDF
Following slide shows employee billable hours dashboard covering total hours capacity, allocated hours billable, total hours worked, and total billable hours worked for the assignment. It also includes details of each team member indulged for same assignment.Deliver an awe inspiring pitch with this creative Enterprise Sustainability Performance Metrics Employee Billable Hours Dashboard Information PDF bundle. Topics like Billable Worked, Allocated Billable, Total Capacity can be discussed with this completely editable template. It is available for immediate download depending on the needs and requirements of the user.

 Home
Home