Slider Scale

Successful Business People 3d Men Moving Up Bar Graph PowerPoint Templates
We present our successful business people 3d men moving up bar graph PowerPoint templates.Use our Process and Flows PowerPoint Templates because you should once Tap the ingenuity of our PowerPoint Templates and Slides. They are programmed to succeed. Use our People PowerPoint Templates because Our PowerPoint Templates and Slides are designed to help you succeed. They have all the ingredients you need. Download our Business PowerPoint Templates because Our PowerPoint Templates and Slides will let your ideas bloom. Create a bed of roses for your audience. Use our Finance PowerPoint Templates because You should Press the right buttons with our PowerPoint Templates and Slides. They will take your ideas down the perfect channel. Download our Shapes PowerPoint Templates because Our PowerPoint Templates and Slides will let you Hit the right notes. Watch your audience start singing to your tune.Use these PowerPoint slides for presentations relating to 3d, achievement, ascending, bar, business, career, chart, competition, concept, diagram, figures, finances, financial, grade, graphic, growth, height, human, hurry, improvement, level, men, money, moving, people, person, progress, promotion, red, rising, run, shape, speed, stage, stairs, step, success, up, white, winner. The prominent colors used in the PowerPoint template are Red, Gray, Green. Professionals tell us our successful business people 3d men moving up bar graph PowerPoint templates look good visually. People tell us our concept PowerPoint templates and PPT Slides will help you be quick off the draw. Just enter your specific text and see your points hit home. We assure you our successful business people 3d men moving up bar graph PowerPoint templates help you meet deadlines which are an element of today's workplace. Just browse and pick the slides that appeal to your intuitive senses. Presenters tell us our business PowerPoint templates and PPT Slides will generate and maintain the level of interest you desire. They will create the impression you want to imprint on your audience. We assure you our successful business people 3d men moving up bar graph PowerPoint templates provide you with a vast range of viable options. Select the appropriate ones and just fill in your text. PowerPoint presentation experts tell us our business PowerPoint templates and PPT Slides will generate and maintain the level of interest you desire. They will create the impression you want to imprint on your audience.

Images Of Business People 3d Men With Bar Graph Making Effort PowerPoint Templates
We present our images of business people 3d men with bar graph making effort PowerPoint templates.Use our People PowerPoint Templates because You canTake a leap off the starting blocks with our PowerPoint Templates and Slides. They will put you ahead of the competition in quick time. Present our Business PowerPoint Templates because our PowerPoint Templates and Slides are the string of your bow. Fire of your ideas and conquer the podium. Use our Marketing PowerPoint Templates because They will Put the wind in your sails. Skim smoothly over the choppy waters of the market. Use our Teamwork PowerPoint Templates because Our PowerPoint Templates and Slides will steer your racing mind. Hit the right buttons and spur on your audience. Download and present our Shapes PowerPoint Templates because Our PowerPoint Templates and Slides will let you Hit the target. Go the full distance with ease and elan.Use these PowerPoint slides for presentations relating to 3d, abstract, accounting, achievement, bar graph, business, cartoon, concept, financial, goal, gold, golden, graph, growth, help, icon, lifting, bar, market, meeting, men, partnership, people, presentation, profits, progress, report, strength, team, teamwork. The prominent colors used in the PowerPoint template are Green, Blue, White.

Images Of Business People 3d Man With Arrow On Bar Graph PowerPoint Templates
We present our images of business people 3d man with arrow on bar graph PowerPoint templates.Download our Success PowerPoint Templates because You should Bet on your luck with our PowerPoint Templates and Slides. Be assured that you will hit the jackpot. Download and present our Finance PowerPoint Templates because You can Be the puppeteer with our PowerPoint Templates and Slides as your strings. Lead your team through the steps of your script. Present our Business PowerPoint Templates because It will Raise the bar of your Thoughts. They are programmed to take you to the next level. Download our Technology PowerPoint Templates because our PowerPoint Templates and Slides will give your ideas the shape. Use our Arrows PowerPoint Templates because Our PowerPoint Templates and Slides will let you Leave a lasting impression to your audiences. They possess an inherent longstanding recall factor.Use these PowerPoint slides for presentations relating to 3d, Achievement, Analyst, Arrow, Background, Bar, Business, Businessman, Chart, Communication, Computer, Communication, Concept, Diagram, Equipment, Finance, Financial, Future, Graph, Graphic, Grow, Growth, Human, Icon, Improve, Income, Increase, Internet, Isolated, Laptop, Man, Market, Measure, People, Professional, Profit, Progress, Rate, Sales, Sign, Siting, Statistic, Success, Symbol, Technology, Up, Win, Winner, Work. The prominent colors used in the PowerPoint template are Green, Gray, Black.

Pictures Of Business Men 3d Man Holding Bar Graph On Arrow Growth PowerPoint Templates
We present our pictures of business men 3d man holding bar graph on arrow growth PowerPoint templates.Download and present our People PowerPoint Templates because Our PowerPoint Templates and Slides are Clear and concise. Use them and dispel any doubts your team may have. Use our Arrows PowerPoint Templates because Our PowerPoint Templates and Slides are the chords of your song. String them along and provide the lilt to your views. Present our Business PowerPoint Templates because Our PowerPoint Templates and Slides are the chords of your song. String them along and provide the lilt to your views. Present our Shapes PowerPoint Templates because Our PowerPoint Templates and Slides will fulfill your every need. Use them and effectively satisfy the desires of your audience. Download our Signs PowerPoint Templates because Our PowerPoint Templates and Slides help you pinpoint your timelines. Highlight the reasons for your deadlines with their use.Use these PowerPoint slides for presentations relating to Accounting, advertising, arrow, bar, business, character, computer, concept, diagram, fast, finance, forecast, gesture, goal, graphic, growth chart, hands, human, illustration, income, increase, investment, isolated, marketing, offer, people, person, present, presentation, presenter, profit, progress, render, rise, sale, showing, sign, standing, statistic, successful, table\n. The prominent colors used in the PowerPoint template are Green, Black, Red. Presenters tell us our pictures of business men 3d man holding bar graph on arrow growth PowerPoint templates are visually appealing. Professionals tell us our arrow PowerPoint templates and PPT Slides have awesome images to get your point across. Professionals tell us our pictures of business men 3d man holding bar graph on arrow growth PowerPoint templates will help them to explain complicated concepts. We assure you our character PowerPoint templates and PPT Slides are effectively colour coded to prioritise your plans They automatically highlight the sequence of events you desire. You can be sure our pictures of business men 3d man holding bar graph on arrow growth PowerPoint templates are designed by professionals PowerPoint presentation experts tell us our arrow PowerPoint templates and PPT Slides are second to none.
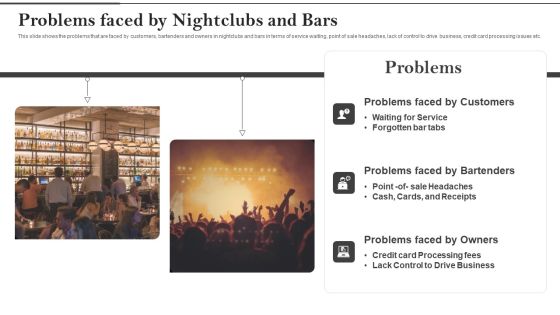
Flowtab Venture Capital Investment Problems Faced By Nightclubs And Bars Introduction PDF
This slide shows the problems that are faced by customers, bartenders and owners in nightclubs and bars in terms of service waiting, point of sale headaches, lack of control to drive business, credit card processing issues etc. Deliver and pitch your topic in the best possible manner with this flowtab venture capital investment problems faced by nightclubs and bars introduction pdf. Use them to share invaluable insights on business, credit card, service, customers and impress your audience. This template can be altered and modified as per your expectations. So, grab it now.

Bar Chart Representing Success Rate Of Linkedin Promotion Strategy Rules PDF
This slide shows graphical representation of LinkedIn marketing strategy in terms of success percentage by companies such as B2C, B2B software , B2B business services, etc. which reflects effectiveness of strategies in business Pitch your topic with ease and precision using this bar chart representing success rate of linkedin promotion strategy rules pdf. This layout presents information on bar chart representing success rate of linkedin promotion strategy. It is also available for immediate download and adjustment. So, changes can be made in the color, design, graphics or any other component to create a unique layout.

Business Revenue Bar Graph With Business Operational Expenditure Details Summary PDF
This slide represents business revenue bar graph with OPEX details which can be referred by companies to earn more revenue by controlling expenditures. It also provides information about marketing and sales, research and development, administration, total revenue, etc. Pitch your topic with ease and precision using this Business Revenue Bar Graph With Business Operational Expenditure Details Summary PDF. This layout presents information on Cost Of Marketing, Sales, Highest Amount. It is also available for immediate download and adjustment. So, changes can be made in the color, design, graphics or any other component to create a unique layout.

Bar Graph Depicting Liquidity Ratio Analysis For 5 Years Graphics PDF
This showcases bar graph that can help organization to compare the liquidity ratios and take mitigation actions in case of decline. It showcases comparison of cash, quick and current ratio for a period of 5 financial years. Showcasing this set of slides titled Bar Graph Depicting Liquidity Ratio Analysis For 5 Years Graphics PDF. The topics addressed in these templates are Organization To Compare, The Liquidity Ratios, Mitigation Action Decline. All the content presented in this PPT design is completely editable. Download it and make adjustments in color, background, font etc. as per your unique business setting.

Dual Branding Campaign To Boost Sales Of Product Or Services Clustered Bar Mockup PDF
This Dual Branding Campaign To Boost Sales Of Product Or Services Clustered Bar Mockup PDF is perfect for any presentation, be it in front of clients or colleagues. It is a versatile and stylish solution for organizing your meetings. TheDual Branding Campaign To Boost Sales Of Product Or Services Clustered Bar Mockup PDF features a modern design for your presentation meetings. The adjustable and customizable slides provide unlimited possibilities for acing up your presentation. Slidegeeks has done all the homework before launching the product for you. So, do not wait, grab the presentation templates today

Coca Cola Emotional Marketing Strategy Bar Chart Ppt Professional Picture PDF
This Coca Cola Emotional Marketing Strategy Bar Chart Ppt Professional Picture PDF is perfect for any presentation, be it in front of clients or colleagues. It is a versatile and stylish solution for organizing your meetings. The Coca Cola Emotional Marketing Strategy Bar Chart Ppt Professional Picture PDF features a modern design for your presentation meetings. The adjustable and customizable slides provide unlimited possibilities for acing up your presentation. Slidegeeks has done all the homework before launching the product for you. So, dont wait, grab the presentation templates today
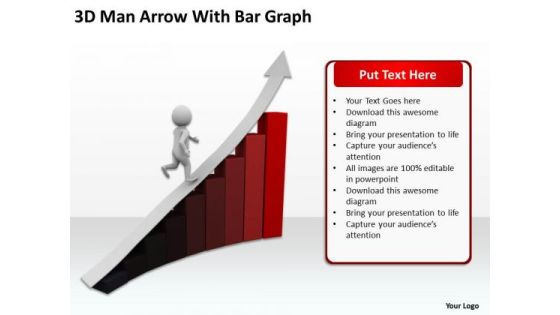
Business Organizational Chart Template 3d Man Arrow With Bar Graph PowerPoint Templates
We present our business organizational chart template 3d man arrow with bar graph PowerPoint templates.Present our Marketing PowerPoint Templates because It will mark the footprints of your journey. Illustrate how they will lead you to your desired destination. Present our Business PowerPoint Templates because Our PowerPoint Templates and Slides will let Your superior ideas hit the target always and everytime. Download and present our Sales PowerPoint Templates because Our PowerPoint Templates and Slides will provide weight to your words. They will bring out the depth of your thought process. Use our Arrows PowerPoint Templates because Our PowerPoint Templates and Slides will fulfill your every need. Use them and effectively satisfy the desires of your audience. Present our Success PowerPoint Templates because Our PowerPoint Templates and Slides will let you Illuminate the road ahead to Pinpoint the important landmarks along the way.Use these PowerPoint slides for presentations relating to 3d, Achievement, Arrow, Bars, Business, Businessman, Chart, Climbing, Column, Company, Concept, Corporate, Diagram, Economy, Effort, Finance, Firm, Goal, Graph, Green, Grow, Growth, Human, Illustration, Increase, Investment, Leader, Man, Manager, Market, Money, Person, Professional, Profit, Progress, Red, Render, Report, Rising, Sales, Stairs, Statistic, Step, Success, Suitcase, Tie, Up, Walking. The prominent colors used in the PowerPoint template are Red, Gray, Black. We assure you our business organizational chart template 3d man arrow with bar graph PowerPoint templates are visually appealing. Use our Businessman PowerPoint templates and PPT Slides are incredible easy to use. We assure you our business organizational chart template 3d man arrow with bar graph PowerPoint templates are designed by a team of presentation professionals. Professionals tell us our Column PowerPoint templates and PPT Slides will help them to explain complicated concepts. The feedback we get is that our business organizational chart template 3d man arrow with bar graph PowerPoint templates will make the presenter look like a pro even if they are not computer savvy. You can be sure our Businessman PowerPoint templates and PPT Slides are specially created by a professional team with vast experience. They diligently strive to come up with the right vehicle for your brilliant Ideas.

Business People Clipart 3d Man Reaching Top Of Bar Graph PowerPoint Templates
We present our business people clipart 3d man reaching top of bar graph PowerPoint templates.Download and present our Process and Flows PowerPoint Templates because You canTake a leap off the starting blocks with our PowerPoint Templates and Slides. They will put you ahead of the competition in quick time. Present our Shapes PowerPoint Templates because Our PowerPoint Templates and Slides will bullet point your ideas. See them fall into place one by one. Download and present our People PowerPoint Templates because They will Put your wonderful verbal artistry on display. Our PowerPoint Templates and Slides will provide you the necessary glam and glitter. Download and present our Success PowerPoint Templates because You can Stir your ideas in the cauldron of our PowerPoint Templates and Slides. Cast a magic spell on your audience. Use our Flow Charts PowerPoint Templates because It will Strengthen your hand with your thoughts. They have all the aces you need to win the day.Use these PowerPoint slides for presentations relating to 3d, achieve, bars, blue, business,businessman, career, cgi, challenge,chart, climbing, columns, company,competition, concept, corporate,diagram, difficult, economy, effort,finance, graph, green, growth, high,illustration, ladder, leader, man,manager, market, opportunity, peak,person, plan, profit, reach, render, rising,solution, stairs, step, strategy, success. The prominent colors used in the PowerPoint template are Red, Blue, White. The feedback we get is that our business people clipart 3d man reaching top of bar graph PowerPoint templates provide you with a vast range of viable options. Select the appropriate ones and just fill in your text. Professionals tell us our career PowerPoint templates and PPT Slides will make the presenter successul in his career/life. PowerPoint presentation experts tell us our business people clipart 3d man reaching top of bar graph PowerPoint templates look good visually. People tell us our businessman PowerPoint templates and PPT Slides will make the presenter successul in his career/life. Presenters tell us our business people clipart 3d man reaching top of bar graph PowerPoint templates provide great value for your money. Be assured of finding the best projection to highlight your words. Professionals tell us our challenge PowerPoint templates and PPT Slides are incredible easy to use.
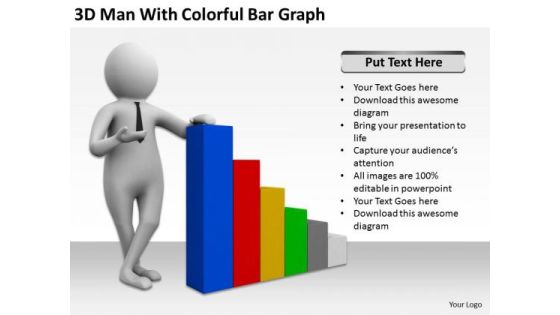
Top Business People 3d Man With Colorful Bar Graph PowerPoint Templates
We present our top business people 3d man with colorful bar graph PowerPoint templates.Download and present our Business PowerPoint Templates because Our PowerPoint Templates and Slides will let your words and thoughts hit bullseye everytime. Use our People PowerPoint Templates because Our PowerPoint Templates and Slides are effectively colour coded to prioritise your plans They automatically highlight the sequence of events you desire. Use our Future PowerPoint Templates because Our PowerPoint Templates and Slides will let you Hit the target. Go the full distance with ease and elan. Present our Marketing PowerPoint Templates because Our PowerPoint Templates and Slides will generate and maintain the level of interest you desire. They will create the impression you want to imprint on your audience. Present our Success PowerPoint Templates because Our PowerPoint Templates and Slides will provide weight to your words. They will bring out the depth of your thought process.Use these PowerPoint slides for presentations relating to 3d, achievement, ascending, bar, bargraph, business, businessman, career,chart, company, concept, corporate, design, development, executive, finance,financial, gain, goal, graph, graphic, growing, growth, happy, illustration, improvement, increase, man, manager, office, people, performance, person,photo, presentation, professional, profit, progress, report, rising, statistics,success, successful, technology, upward, top, winner. The prominent colors used in the PowerPoint template are Blue, Yellow, Red.
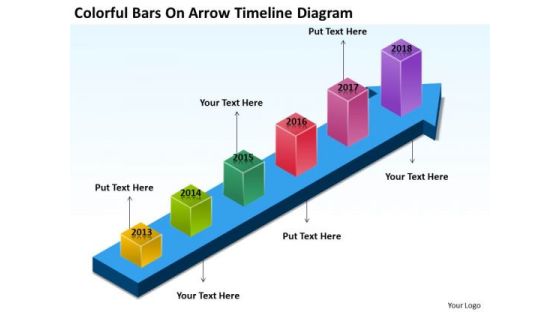
Colorful Bars On Arrow Timeline Diagram Catering Business Plan PowerPoint Templates
We present our colorful bars on arrow timeline diagram catering business plan PowerPoint templates.Present our Process and Flows PowerPoint Templates because You can Double your output with our PowerPoint Templates and Slides. They make beating deadlines a piece of cake. Use our Arrows PowerPoint Templates because Our PowerPoint Templates and Slides will let your words and thoughts hit bullseye everytime. Present our Business PowerPoint Templates because Your ideas provide food for thought. Our PowerPoint Templates and Slides will help you create a dish to tickle the most discerning palate. Use our Marketing PowerPoint Templates because Our PowerPoint Templates and Slides will provide you the cutting edge. Slice through the doubts in the minds of your listeners. Use our Success PowerPoint Templates because Our PowerPoint Templates and Slides are specially created by a professional team with vast experience. They diligently strive to come up with the right vehicle for your brilliant Ideas. Use these PowerPoint slides for presentations relating to Graph, chart, bar, growth, arrow, color,colorful,colour,colourful,market, grow, success, diagram, gain, stock, up, forecast, profile, holder, succeed, corporate, future, finance, analyst, goal,calculation, building, accounting, factor, company, progress, profit, firm, figures, statistic, financial, measure. The prominent colors used in the PowerPoint template are Purple, Pink, Blue.
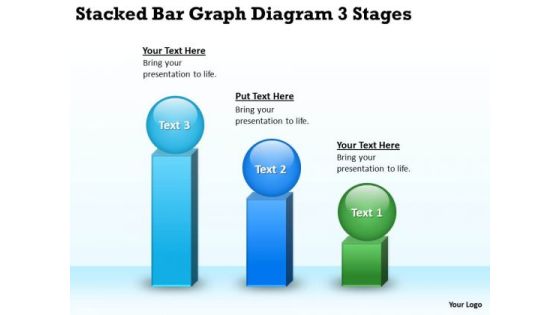
Stacked Bar Graph Diagram 3 Stages Business Plan Outline PowerPoint Templates
We present our stacked bar graph diagram 3 stages business plan outline PowerPoint templates.Use our Business PowerPoint Templates because These PowerPoint Templates and Slides will give the updraft to your ideas. See them soar to great heights with ease. Present our Spheres PowerPoint Templates because Our PowerPoint Templates and Slides will provide the perfect balance. Your weighty ideas will get the ideal impetus. Use our Competition PowerPoint Templates because You aspire to touch the sky with glory. Let our PowerPoint Templates and Slides provide the fuel for your ascent. Use our Shapes PowerPoint Templates because You can Inspire your team with our PowerPoint Templates and Slides. Let the force of your ideas flow into their minds. Download our Success PowerPoint Templates because Our PowerPoint Templates and Slides will let you Clearly mark the path for others to follow.Use these PowerPoint slides for presentations relating to bar, graph, statistics, economy, render, success, representation, diagram, graphic, achievment, obstruction, chevron, accounting, finances, energy eco, steps, figure, tall, barrier, strategy, ladder, up, planning, high, climb, stripes, growth, maintenance, profit, successful, repair, return, gradient, sustainability, financial, construction, upwards, increasing. The prominent colors used in the PowerPoint template are Blue light, Blue, Green.
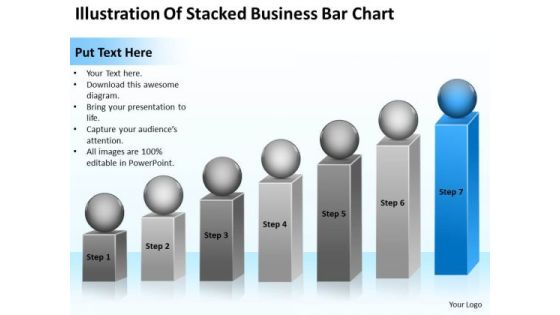
Illustration Of Stacked Business Bar Chart Ppt Examples Plan PowerPoint Templates
We present our illustration of stacked business bar chart ppt examples plan PowerPoint templates.Present our Flow Charts PowerPoint Templates because You can Bait your audience with our PowerPoint Templates and Slides. They will bite the hook of your ideas in large numbers. Use our Process and Flows PowerPoint Templates because Our PowerPoint Templates and Slides are innately eco-friendly. Their high recall value negate the need for paper handouts. Present our Spheres PowerPoint Templates because These PowerPoint Templates and Slides will give the updraft to your ideas. See them soar to great heights with ease. Present our Marketing PowerPoint Templates because Our PowerPoint Templates and Slides will definately Enhance the stature of your presentation. Adorn the beauty of your thoughts with their colourful backgrounds. Present our Business PowerPoint Templates because Our PowerPoint Templates and Slides are innately eco-friendly. Their high recall value negate the need for paper handouts.Use these PowerPoint slides for presentations relating to Diagram, chart, market, statistics, square, grow, infograph, bar, corporate, red, business, vector, success, presentation, growing, circle, finance,analyst, goal, report, marketing, different, accounting, management, graph, illustration, geometric, sphere, design, growth, infographic, progress, profit,information, increase, aim, analyze, financial, rising, measure, block. The prominent colors used in the PowerPoint template are Blue, Gray, Black.
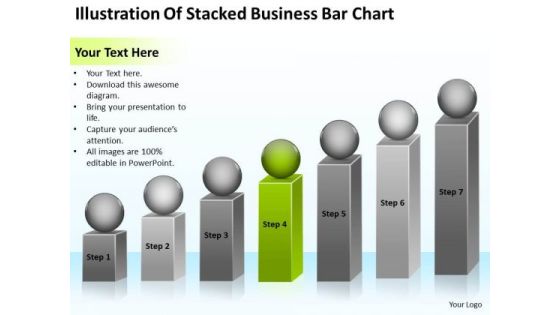
Illustration Of Stacked Business Bar Chart Ppt Plan For Hair Salon PowerPoint Templates
We present our illustration of stacked business bar chart ppt plan for hair salon PowerPoint templates.Download our Business PowerPoint Templates because you should Experience excellence with our PowerPoint Templates and Slides. They will take your breath away. Download our Spheres PowerPoint Templates because Our PowerPoint Templates and Slides will Activate the energies of your audience. Get their creative juices flowing with your words. Download our Marketing PowerPoint Templates because Our PowerPoint Templates and Slides are created with admirable insight. Use them and give your group a sense of your logical mind. Present our Process and Flows PowerPoint Templates because you should Whip up a frenzy with our PowerPoint Templates and Slides. They will fuel the excitement of your team. Download and present our Flow Charts PowerPoint Templates because Our PowerPoint Templates and Slides will let you Hit the target. Go the full distance with ease and elan.Use these PowerPoint slides for presentations relating to Diagram, chart, market, statistics, square, grow, infograph, bar, corporate, red, business, vector, success, presentation, growing, circle, finance,analyst, goal, report, marketing, different, accounting, management, graph, illustration, geometric, sphere, design, growth, infographic, progress, profit,information, increase, aim, analyze, financial, rising, measure, block. The prominent colors used in the PowerPoint template are Black, Green, Gray.

Illustration Of Stacked Business Bar Chart Ppt Plans Pro PowerPoint Templates
We present our illustration of stacked business bar chart ppt plans pro PowerPoint templates.Download our Spheres PowerPoint Templates because Our PowerPoint Templates and Slides will let you Clearly mark the path for others to follow. Download our Flow Charts PowerPoint Templates because You should Throw the gauntlet with our PowerPoint Templates and Slides. They are created to take up any challenge. Present our Process and Flows PowerPoint Templates because Your ideas provide food for thought. Our PowerPoint Templates and Slides will help you create a dish to tickle the most discerning palate. Use our Business PowerPoint Templates because Our PowerPoint Templates and Slides will definately Enhance the stature of your presentation. Adorn the beauty of your thoughts with their colourful backgrounds. Use our Shapes PowerPoint Templates because Our PowerPoint Templates and Slides will provide the perfect balance. Your weighty ideas will get the ideal impetus.Use these PowerPoint slides for presentations relating to Diagram, chart, market, statistics, square, grow, infograph, bar, corporate, red, business, vector, success, presentation, growing, circle, finance,analyst, goal, report, marketing, different, accounting, management, graph, illustration, geometric, sphere, design, growth, infographic, progress, profit,information, increase, aim, analyze, financial, rising, measure, block. The prominent colors used in the PowerPoint template are Green, Gray, Black.

Illustration Of Stacked Business Bar Chart Start Up Plan PowerPoint Templates
We present our illustration of stacked business bar chart start up plan PowerPoint templates.Use our Flow Charts PowerPoint Templates because Our PowerPoint Templates and Slides will bullet point your ideas. See them fall into place one by one. Use our Process and Flows PowerPoint Templates because Our PowerPoint Templates and Slides are Clear and concise. Use them and dispel any doubts your team may have. Download and present our Spheres PowerPoint Templates because It can Leverage your style with our PowerPoint Templates and Slides. Charm your audience with your ability. Download our Marketing PowerPoint Templates because Our PowerPoint Templates and Slides will let you Hit the right notes. Watch your audience start singing to your tune. Present our Shapes PowerPoint Templates because Our PowerPoint Templates and Slides are the chords of your song. String them along and provide the lilt to your views.Use these PowerPoint slides for presentations relating to Diagram, chart, market, statistics, square, grow, infograph, bar, corporate, red, business, vector, success, presentation, growing, circle, finance,analyst, goal, report, marketing, different, accounting, management, graph, illustration, geometric, sphere, design, growth, infographic, progress, profit,information, increase, aim, analyze, financial, rising, measure, block. The prominent colors used in the PowerPoint template are Blue, Black, Gray.

6 Stages Set Of Parallel Process Bar Business Plan Template PowerPoint Templates
We present our 6 stages set of parallel process bar business plan template PowerPoint templates.Present our Advertising PowerPoint Templates because It can Leverage your style with our PowerPoint Templates and Slides. Charm your audience with your ability. Present our Arrows PowerPoint Templates because our PowerPoint Templates and Slides will give your ideas the shape. Present our Business PowerPoint Templates because Our PowerPoint Templates and Slides will Embellish your thoughts. They will help you illustrate the brilliance of your ideas. Download our Shapes PowerPoint Templates because You can Create a matrix with our PowerPoint Templates and Slides. Feel the strength of your ideas click into place. Present our Process and Flows PowerPoint Templates because you can Break through with our PowerPoint Templates and Slides. Bring down the mental barriers of your audience.Use these PowerPoint slides for presentations relating to Arrow, Arrow Button, Arrow Vector, Art, Business, Button, Chart, Clip, communication, Decoration, Diagram, Direction, Drop, Element, Empty, Finance, Flow, Graph, Graphic, Illustration, Isometric, marketing, Presentation, Process, Shape, Sign, success, Step, Symbol, Template, Text, Vector. The prominent colors used in the PowerPoint template are Blue, White, Gray. Presenters tell us our 6 stages set of parallel process bar business plan template PowerPoint templates are effectively colour coded to prioritise your plans They automatically highlight the sequence of events you desire. Customers tell us our Button PowerPoint templates and PPT Slides provide you with a vast range of viable options. Select the appropriate ones and just fill in your text. The feedback we get is that our 6 stages set of parallel process bar business plan template PowerPoint templates are effectively colour coded to prioritise your plans They automatically highlight the sequence of events you desire. The feedback we get is that our Vector PowerPoint templates and PPT Slides are second to none. Presenters tell us our 6 stages set of parallel process bar business plan template PowerPoint templates are designed by professionals We assure you our Button PowerPoint templates and PPT Slides are specially created by a professional team with vast experience. They diligently strive to come up with the right vehicle for your brilliant Ideas.

Successful Business People 3d Men Climbing Bar Graph Finance PowerPoint Templates
We present our successful business people 3d men climbing bar graph finance PowerPoint templates.Use our People PowerPoint Templates because Our PowerPoint Templates and Slides have the Brilliant backdrops. Guaranteed to illuminate the minds of your audience. Download our Finance PowerPoint Templates because You should Bet on your luck with our PowerPoint Templates and Slides. Be assured that you will hit the jackpot. Use our Business PowerPoint Templates because Our PowerPoint Templates and Slides will generate and maintain the level of interest you desire. They will create the impression you want to imprint on your audience. Use our Success PowerPoint Templates because You should Bet on your luck with our PowerPoint Templates and Slides. Be assured that you will hit the jackpot. Present our Shapes PowerPoint Templates because Our PowerPoint Templates and Slides ensures Effective communication. They help you put across your views with precision and clarity.Use these PowerPoint slides for presentations relating to 3d, abstract, accuracy, accurate, achieved, achievement, aim, arrow, background,best, black, business, center, chance, character, circle, competition, concept,conceptual, dart, dartboard, game, goal, human, icon, illustration, isolated, luck,marketing, men, people, perfect, perfection, performance, person, red, shot,solution, sport, strategy, success, successful, symbol, target, white, win, winner. The prominent colors used in the PowerPoint template are Red, Blue, White. We assure you our successful business people 3d men climbing bar graph finance PowerPoint templates effectively help you save your valuable time. You can be sure our achievement PowerPoint templates and PPT Slides are the best it can get when it comes to presenting. Use our successful business people 3d men climbing bar graph finance PowerPoint templates are effectively colour coded to prioritise your plans They automatically highlight the sequence of events you desire. We assure you our achieved PowerPoint templates and PPT Slides are the best it can get when it comes to presenting. Use our successful business people 3d men climbing bar graph finance PowerPoint templates will make you look like a winner. Professionals tell us our achievement PowerPoint templates and PPT Slides provide you with a vast range of viable options. Select the appropriate ones and just fill in your text.

Bar Graph Showing Key Options For Business Diversion Ppt PowerPoint Presentation Professional Graphics PDF
Presenting this set of slides with name bar graph showing key options for business diversion ppt powerpoint presentation professional graphics pdf. This is a four stage process. The stages in this process are diversification, market development, market expansion, market penetration, enter new market with new product. This is a completely editable PowerPoint presentation and is available for immediate download. Download now and impress your audience.

Bar Graph Showing Revenues Generated By Sales Department Ppt Portfolio Graphics Example PDF
This graph or chart is linked to excel, and changes automatically based on data. Just left click on it and select edit data. Showcasing this set of slides titled bar graph showing revenues generated by sales department ppt portfolio graphics example pdf. The topics addressed in these templates are yearly sales revenues, sales team, profits. All the content presented in this PPT design is completely editable. Download it and make adjustments in color, background, font etc. as per your unique business setting.

Annual Training Schedule Bar Chart For Business Ppt PowerPoint Presentation File Infographics PDF
This graph chart is linked to excel, and changes automatically based on data. Just left click on it and select Edit Data. Showcasing this set of slides titled annual training schedule bar chart for business ppt powerpoint presentation file infographics pdf. The topics addressed in these templates are trainings, employees, competent officers. All the content presented in this PPT design is completely editable. Download it and make adjustments in color, background, font etc. as per your unique business setting.

Bar Chart With Percentage Representing Budget Allocation For Different Products Ppt PowerPoint Presentation File Samples PDF
Showcasing this set of slides titled bar chart with percentage representing budget allocation for different products ppt powerpoint presentation file samples pdf. The topics addressed in these templates arebar chart with percentage representing budget allocation for different products. All the content presented in this PPT design is completely editable. Download it and make adjustments in color, background, font etc. as per your unique business setting.

Cost Reduction Bar Graph For Organization Optimization Ppt Inspiration Vector PDF
This slide represent cost saving with benefits in an organization and areas where more efficiencies are utilized. It includes travel, administrative and hiring. Pitch your topic with ease and precision using this Cost Reduction Bar Graph For Organization Optimization Ppt Inspiration Vector PDF. This layout presents information on Total Cost Benefits, Promoting Employees, Providing Perks. It is also available for immediate download and adjustment. So, changes can be made in the color, design, graphics or any other component to create a unique layout.

How To Draw Business Process Diagram 3d Team Discussing Bar Graph PowerPoint Templates
We present our how to draw business process diagram 3d team discussing bar graph PowerPoint templates.Download and present our Business PowerPoint Templates because It will get your audience in sync. Download and present our People PowerPoint Templates because You can Be the puppeteer with our PowerPoint Templates and Slides as your strings. Lead your team through the steps of your script. Use our Finance PowerPoint Templates because Our PowerPoint Templates and Slides are created by a hardworking bunch of busybees. Always flitting around with solutions gauranteed to please. Download and present our Symbol PowerPoint Templates because Our PowerPoint Templates and Slides will provide you a launch platform. Give a lift off to your ideas and send them into orbit. Download and present our Success PowerPoint Templates because You have gained great respect for your brilliant ideas. Use our PowerPoint Templates and Slides to strengthen and enhance your reputation.Use these PowerPoint slides for presentations relating to 3d, art, boardroom, budget, business, ceo, character, communication, concept, conference, corporate, council, discussion, economy, executive, finance, gold, graph, growth, icon, idea, idiom, illustration, isolated, lecture, manage, management, market, meet, metaphor, money, office, over, percentage, planning, presentation, projection, prospectus, report, study, summit, symbol, talk, team, white. The prominent colors used in the PowerPoint template are Red, Gray, Black. The feedback we get is that our how to draw business process diagram 3d team discussing bar graph PowerPoint templates are designed by a team of presentation professionals. Customers tell us our character PowerPoint templates and PPT Slides will impress their bosses and teams. The feedback we get is that our how to draw business process diagram 3d team discussing bar graph PowerPoint templates are designed by professionals Professionals tell us our business PowerPoint templates and PPT Slides are readymade to fit into any presentation structure. Presenters tell us our how to draw business process diagram 3d team discussing bar graph PowerPoint templates will make you look like a winner. You can be sure our ceo PowerPoint templates and PPT Slides provide you with a vast range of viable options. Select the appropriate ones and just fill in your text.

Bar Graph Representing Accomplishment Metrics For Customer Service Team Icons PDF
This slide shows the graphical representation of success metrics that helps to measure the customer service team which includes customer lifetime value, customer churn, net promoter score, revenues churn, customer experience score, customer renewals, etc. Showcasing this set of slides titled bar graph representing accomplishment metrics for customer service team icons pdf. The topics addressed in these templates are importance level, least important. All the content presented in this PPT design is completely editable. Download it and make adjustments in color, background, font etc. as per your unique business setting.

Bar Chart Representing Quality Management Tools And Techniques For Process Improvement Download PDF
This slide focuses on the graphical representation of quality management software tools which includes quality management system, enterprise resource planning, business intelligence and manufacturing operations management with top performers, etc. Showcasing this set of slides titled bar chart representing quality management tools and techniques for process improvement download pdf. The topics addressed in these templates are manufacturing operations management, business intelligence, enterprise resource planning, quality management system. All the content presented in this PPT design is completely editable. Download it and make adjustments in color, background, font etc. as per your unique business setting.

Bar Graph Representing Importance Of Human Resource Cloud Automation System Background PDF
This slide shows the graphical representation of cloud automation system for human resource which includes the benefits to organization such as better employee experience, real time data, strategic functions, less training needs, better employee insights, etc. Showcasing this set of slides titled Bar Graph Representing Importance Of Human Resource Cloud Automation System Background PDF. The topics addressed in these templates are System, Resource, Reduced. All the content presented in this PPT design is completely editable. Download it and make adjustments in color, background, font etc. as per your unique business setting.

Bar Graph Representing Risk Assessment Variant On Basis Of Impact Level Topics PDF
This slide shows the graphical representation of risk scenario on the basis of impact category score and degree of severity which includes impacted categories such as people, economy, environment, territorial security, business reputation, etc. Showcasing this set of slides titled Bar Graph Representing Risk Assessment Variant On Basis Of Impact Level Topics PDF. The topics addressed in these templates are Measuring Metrics, Organization, Greater Impact. All the content presented in this PPT design is completely editable. Download it and make adjustments in color, background, font etc. as per your unique business setting.
Multiple Projects Progress Tracking Report Tracking Report With Bar Graph Information PDF
This slide shows the status report of various projects in order to help the project manager to track their performance. It includes project names, no.of tasks, start and end date, days taken for completion, progress and remaining percentage of projects.Showcasing this set of slides titled Multiple Projects Progress Tracking Report Tracking Report With Bar Graph Information PDF. The topics addressed in these templates are Multiple Projects, Progress Tracking, Report Tracking Report. All the content presented in this PPT design is completely editable. Download it and make adjustments in color, background, font etc. as per your unique business setting.
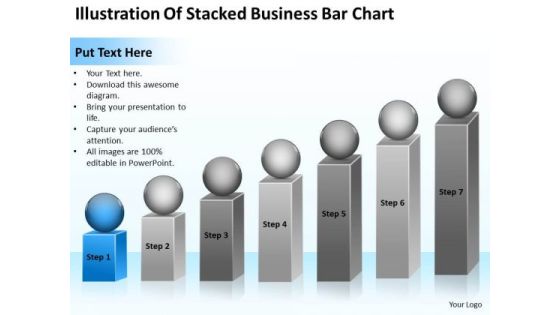
Illustration Of Stacked Business Bar Chart Ppt Consultant Plan PowerPoint Templates
We present our illustration of stacked business bar chart ppt consultant plan PowerPoint templates.Use our Process and Flows PowerPoint Templates because You will get more than you ever bargained for. Use our Spheres PowerPoint Templates because Our PowerPoint Templates and Slides provide you with a vast range of viable options. Select the appropriate ones and just fill in your text. Download our Flow Charts PowerPoint Templates because Our PowerPoint Templates and Slides are topically designed to provide an attractive backdrop to any subject. Present our Business PowerPoint Templates because You should Ascend the ladder of success with ease. Our PowerPoint Templates and Slides will provide strong and sturdy steps. Download our Shapes PowerPoint Templates because Our PowerPoint Templates and Slides will help you be quick off the draw. Just enter your specific text and see your points hit home.Use these PowerPoint slides for presentations relating to Diagram, chart, market, statistics, square, grow, infograph, bar, corporate, red, business, vector, success, presentation, growing, circle, finance,analyst, goal, report, marketing, different, accounting, management, graph, illustration, geometric, sphere, design, growth, infographic, progress, profit,information, increase, aim, analyze, financial, rising, measure, block. The prominent colors used in the PowerPoint template are Gray, Blue, Gray.
Four Banners With Idea Generation Bar Graph Gears Icons Powerpoint Templates
This PPT slide has been designed with four banners. This professional template contains concept of idea generation and analysis. Blend your views with this professional slide.

Tablet With Bar Graph Success PowerPoint Templates And PowerPoint Themes 1112
We present our Tablet With Bar Graph Success PowerPoint Templates And PowerPoint Themes 1112.Use our Business PowerPoint Templates because,Marketing Strategy Business Template:- Maximising sales of your product is the intended destination. Use our Marketing PowerPoint Templates because, The vision of being the market leader is clear to you. Use our Finance PowerPoint Templates because, Like your thoughts arrows are inherently precise and true. Use our Abstract PowerPoint Templates because,Explain the process by which you intend to right it. Use our Success PowerPoint Templates because, Expound on how you plan to gain their confidence and assure them of continued and consistent excellence in quality of service.Use these PowerPoint slides for presentations relating to Tablets with a bar graph Business Finance Marketing Abstract Success. The prominent colors used in the PowerPoint template are Red, Green, Black

Bar Graph With Globe On Top Global Business PowerPoint Templates And PowerPoint Themes 1112
We present our Bar Graph With Globe On Top Global Business PowerPoint Templates And PowerPoint Themes 1112.Use our Finance PowerPoint Templates because, Hence this diagram has the unique ability to drive home your ideas and show how they mesh to gaurantee sucess. Use our Future PowerPoint Templates because,Explain the process by which you intend to right it. Use our Business PowerPoint Templates because, Outline your targets to your team. Use our Success PowerPoint Templates because,Show them how you can save the day. Use our Globe PowerPoint Templates because, Place them where they need to be.Use these PowerPoint slides for presentations relating to Bar graph with globe on top, finance, future, business, success, globe. The prominent colors used in the PowerPoint template are Blue, White, Black

Approach Avoidance Conflict Gantt Chart With Project Progress Bar Topics PDF
This slide provides the glimpse about the project progress bar graph in gantt chart form which covers the general release, open and closed beta and development. Your complex projects can be managed and organized simultaneously using this detailed approach avoidance conflict gantt chart with project progress bar topics pdf template. Track the milestones, tasks, phases, activities, and subtasks to get an updated visual of your project. Share your planning horizon and release plan with this well crafted presentation template. This exemplary template can be used to plot various dependencies to distinguish the tasks in the pipeline and their impact on the schedules and deadlines of the project. Apart from this, you can also share this visual presentation with your team members and stakeholders. It a resourceful tool that can be incorporated into your business structure. Therefore, download and edit it conveniently to add the data and statistics as per your requirement.
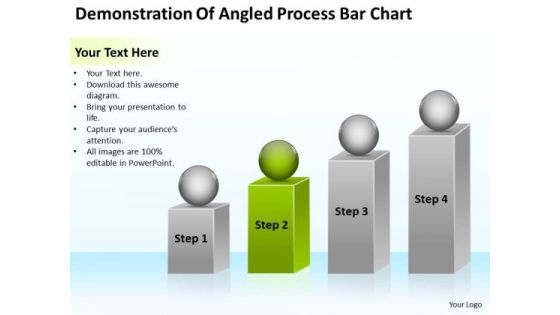
Demonstration Of Angled Process Bar Chart Ppt Make Business Plan PowerPoint Templates
We present our demonstration of angled process bar chart ppt make business plan PowerPoint templates.Present our Marketing PowerPoint Templates because Our PowerPoint Templates and Slides provide you with a vast range of viable options. Select the appropriate ones and just fill in your text. Present our Construction PowerPoint Templates because Our PowerPoint Templates and Slides are like the strings of a tennis racquet. Well strung to help you serve aces. Use our Spheres PowerPoint Templates because You can Score a slam dunk with our PowerPoint Templates and Slides. Watch your audience hang onto your every word. Present our Boxes PowerPoint Templates because It will let you Set new benchmarks with our PowerPoint Templates and Slides. They will keep your prospects well above par. Present our Business PowerPoint Templates because Our PowerPoint Templates and Slides will let you Leave a lasting impression to your audiences. They possess an inherent longstanding recall factor.Use these PowerPoint slides for presentations relating to 3d, human, cube, isolated, activity, achievement, business, success, decisions, teamwork, partnership, stack, occupation, people, building, shape, team, box, illustration, figure, creativity, togetherness, games, aspirations, group, growth, text, picking, progress, working, silhouette, puzzle, construction, concepts, structure, cartoon, ideas. The prominent colors used in the PowerPoint template are Green, White, Gray.
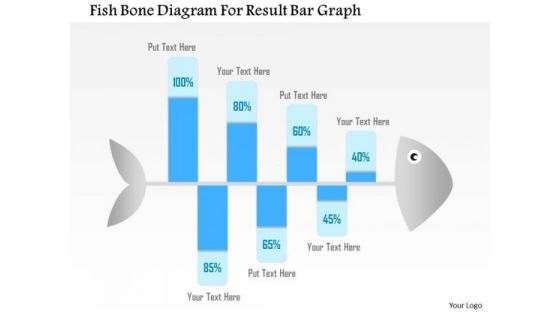
Business Diagram Fish Bone Diagram For Result Bar Graph Presentation Template
Graphic of fish bone has been used to design this Power Point template slide. This PPT slide contains the concept of problem analysis and root cause analysis. Use this PPT slide and display process of root cause analysis for any field. This PPT slide is very well designed for business and production related problem analysis.

Bar Graph Representing Macroeconomic Analysis Employment Change By Industry Background PDF
This slide focuses on the graphical presentation of macroeconomic indicator such as employment rate of different industries which includes service providing and goods producing industries which includes healthcare and social assistance, construction, manufacturing industry, etc. Pitch your topic with ease and precision using this Bar Graph Representing Macroeconomic Analysis Employment Change By Industry Background PDF. This layout presents information on Goods Producing, Service Providing, Financial, Business. It is also available for immediate download and adjustment. So, changes can be made in the color, design, graphics or any other component to create a unique layout.

Bar Chart Representing IT Risk Control Strategies Risk Management For Banks Themes PDF
This slide shows the graphical presentation of information technology risk management strategies adopted by banks such as mapping rules and requirements, regulatory impact management, data preparation and validation, compliance monitoring, analytical calculations, etc. Pitch your topic with ease and precision using this Bar Chart Representing IT Risk Control Strategies Risk Management For Banks Themes PDF. This layout presents information on IT Risk Management, Compliance Monitoring, Manages IT Risks. It is also available for immediate download and adjustment. So, changes can be made in the color, design, graphics or any other component to create a unique layout.

Monthly Business Operational Expenditure Bar Graph With Projected And Actual Expenses Introduction PDF
This slide shows monthly operating expenditure opex with projected and actual expenses which can be referred by companies to align budget with expenses effectively. It also provides information about machinery rent, personnel benefits, building rent, equipment, professional fees, etc. Pitch your topic with ease and precision using this Monthly Business Operational Expenditure Bar Graph With Projected And Actual Expenses Introduction PDF. This layout presents information on Projected Expenses, Costs, Service. It is also available for immediate download and adjustment. So, changes can be made in the color, design, graphics or any other component to create a unique layout.
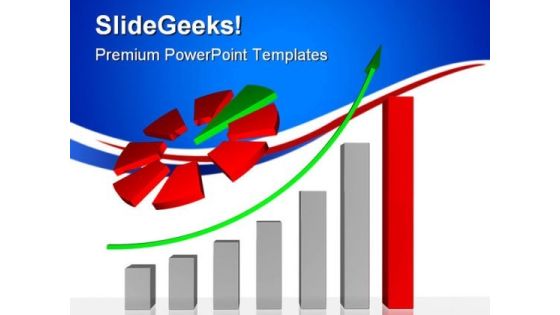
Statistique Success Business PowerPoint Themes And PowerPoint Slides 0811
Microsoft PowerPoint Theme and Slide with colorful bars and pie on white Slide

5 Stages Hub And Spoke Comparison Diagram Business Plan For Bar PowerPoint Templates
We present our 5 stages hub and spoke comparison diagram business plan for bar PowerPoint templates.Download our Technology PowerPoint Templates because Our PowerPoint Templates and Slides are created by a hardworking bunch of busybees. Always flitting around with solutions gauranteed to please. Present our Business PowerPoint Templates because Your audience will believe you are the cats whiskers. Download our Process and Flows PowerPoint Templates because You can Create a matrix with our PowerPoint Templates and Slides. Feel the strength of your ideas click into place. Download and present our Marketing PowerPoint Templates because You can Zap them with our PowerPoint Templates and Slides. See them reel under the impact. Use our Arrows PowerPoint Templates because It is Aesthetically crafted by artistic young minds. Our PowerPoint Templates and Slides are designed to display your dexterity.Use these PowerPoint slides for presentations relating to Experiment, spreadsheet, sociology, line chart, conclusion, pie chart, mathematics, innovation, sociological, business, bulb, concept, arrow, presentation, symbol, diagram, social, discovery, process, analysis, report, marketing, intelligent, creative, visualization, mathematical formula, trends, thinking, summary, infographic, exploration, information, conceptual, quantified, exploratory, business. The prominent colors used in the PowerPoint template are Blue, Yellow, White.

Growth Chart Business PowerPoint Themes And PowerPoint Slides 0411
Microsoft PowerPoint Theme and Slide with growth chart green bars and red arrow pointing upwards

Global Business Finance PowerPoint Themes And PowerPoint Slides 0211
Microsoft PowerPoint Theme and Slide with gold globe with many gold coins representing bar graph

Marketing Business Finance PowerPoint Themes And PowerPoint Slides 0211
Microsoft PowerPoint Theme and Slide with business bar graph and arrow shows growth

Accounts And Graph Business PowerPoint Themes And PowerPoint Slides 0511
Microsoft PowerPoint Theme and Slide with an accounts bar charts in different colors

Business Growth Finance PowerPoint Themes And PowerPoint Slides 0811
Microsoft PowerPoint Theme and Slide with business growth thumbs up on a golden bar graph
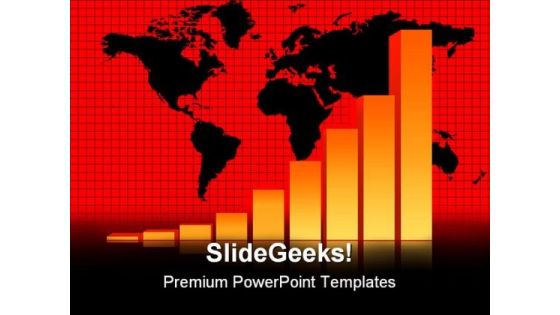
Business Data Graph Finance PowerPoint Themes And PowerPoint Slides 0511
Microsoft PowerPoint Slide and Theme with increasing bar chart business data graph with world map

Business Growth Chart Finance PowerPoint Themes And PowerPoint Slides 0511
Microsoft PowerPoint Slide and Theme with businessman pushes graph piece with earth and bar graph

Financial Report Business PowerPoint Themes And PowerPoint Slides 0511
Microsoft PowerPoint Slide and Theme with arrow pointing to the higher financial chart bar

Graph01 Finance PowerPoint Themes And PowerPoint Slides 0511
Microsoft PowerPoint Slide and Theme with financial computing deskto computer with bar chart

Manpower Graph People PowerPoint Themes And PowerPoint Slides 0811
Microsoft PowerPoint Theme and slide with bar graph showing increase in people size

Financial Success Business PowerPoint Themes And PowerPoint Slides 0511
Microsoft PowerPoint Theme and Slide with growing bar chart from golden coins with red arrow

Transparent Colorful Graph Business PowerPoint Themes And PowerPoint Slides 0811
Microsoft PowerPoint Theme and Slide with transparent colorful bars and pie

Business Graph Success PowerPoint Themes And PowerPoint Slides 0811
Microsoft PowerPoint Theme and Slide with of someone climbing up a bar chart

Leadership01 Success PowerPoint Themes And PowerPoint Slides 0811
Microsoft PowerPoint Theme and Slide with one figure stands atop the highest bar in a graph

Chart Business PowerPoint Themes And PowerPoint Slides 0511
Microsoft PowerPoint Theme and Slide with orange bar on screen business conceptual illustration
Growth Graph Finance PowerPoint Themes And PowerPoint Slides 0511
Microsoft PowerPoint Theme and Slide with businessman adding a red bar chart to increase financial growth

Growth01 Business PowerPoint Themes And PowerPoint Slides 0511
Microsoft PowerPoint Theme and Slide with confident businessman climbing a bar chart

Up Arrow Graph Business PowerPoint Themes And PowerPoint Slides 0511
Microsoft PowerPoint Theme and Slide with 3d rendered image of a bar-chart for success concept
Down Sales Business PowerPoint Themes And PowerPoint Slides 0711
Microsoft PowerPoint Theme and Slide with a bar graph in red showing possible sale

Increasing Costs Of Education PowerPoint Presentation Slides C
Microsoft PowerPoint Slides and Backgrounds with cost of education increasing in with bar graph
Increasing Costs Of Education PowerPoint Presentation Slides Cc
Microsoft PowerPoint Slides and Backgrounds with cost of education increasing in with bar graph

Increasing Costs Of Education PowerPoint Presentation Slides F
Microsoft PowerPoint Slides and Backgrounds with cost of education increasing in with bar graph

Increasing Costs Of Education PowerPoint Presentation Slides R
Microsoft PowerPoint Slides and Backgrounds with cost of education increasing in with bar graph
Increasing Costs Of Education PowerPoint Presentation Slides S
Microsoft PowerPoint Slides and Backgrounds with cost of education increasing in with bar graph
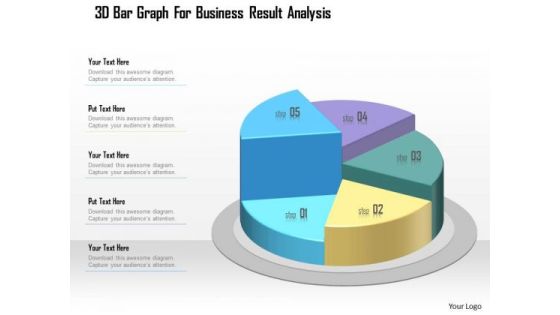
Business Diagram 3d Bar Graph For Business Result Analysis Presentation Template
This business slide displays five staged pie chart. This diagram is a data visualization tool that gives you a simple way to present statistical information. This slide helps your audience examine and interpret the data you present.

3 Stages Layered Diamond Process Sports Bar Business Plan PowerPoint Templates
We present our 3 stages layered diamond process sports bar business plan PowerPoint templates.Download and present our Marketing PowerPoint Templates because Our PowerPoint Templates and Slides are effectively colour coded to prioritise your plans They automatically highlight the sequence of events you desire. Download our Finance PowerPoint Templates because Our PowerPoint Templates and Slides will weave a web of your great ideas. They are gauranteed to attract even the most critical of your colleagues. Use our Process and Flows PowerPoint Templates because Your audience will believe you are the cats whiskers. Download and present our Shapes PowerPoint Templates because Watching this your Audience will Grab their eyeballs, they wont even blink. Download and present our Business PowerPoint Templates because Your audience will believe you are the cats whiskers.Use these PowerPoint slides for presentations relating to Surface, wallpaper, rough, dirty, plate, stamp, mark, surrounding, history, built, canvas, process, obsolete, paint, level, layer, revival, diamond, illustration, aging, wall, brush, retro, texture, inkblot, art, antique, effect, artistic, vintage, grunge, spot, pattern, construction, structure, rusted, metal, material. The prominent colors used in the PowerPoint template are Green, Blue, Black.
Growing Your Savings Future PowerPoint Presentation Slides C
Microsoft PowerPoint Templates and Backgrounds with growing your savings in with bar chart

Growing Your Savings Future PowerPoint Presentation Slides Cc
Microsoft PowerPoint Templates and Backgrounds with growing your savings in with bar chart

Growing Your Savings Future PowerPoint Presentation Slides F
Microsoft PowerPoint Templates and Backgrounds with growing your savings in with bar chart
Growing Your Savings Future PowerPoint Presentation Slides R
Microsoft PowerPoint Templates and Backgrounds with growing your savings in with bar chart

Growing Your Savings Future PowerPoint Presentation Slides S
Microsoft PowerPoint Templates and Backgrounds with growing your savings in with bar chart
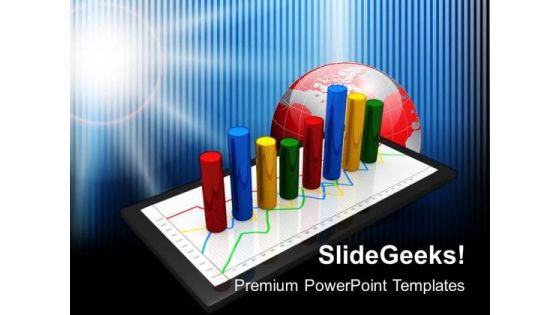
Tablet With Bar Graph Global Business PowerPoint Templates And PowerPoint Themes 1112
We present our Tablet With Bar Graph Global Business PowerPoint Templates And PowerPoint Themes 1112.Use our Business PowerPoint Templates because, You have it all down to a nicety, slice by slice, layer by layer. Use our Cylinders PowerPoint Templates because, Explain thecontribution of each of the elements and how they provide impetus to the next phase. Use our Technology PowerPoint Templates because, They enhance the essence of your viable ideas. Use our Marketing PowerPoint Templates because, Original thinking is the need of the hour. Use our Globe PowerPoint Templates because,But you have an idea of which you are sure.Use these PowerPoint slides for presentations relating to Tablet pc with graph, cylinders, business, technology, marketing, globe . The prominent colors used in the PowerPoint template are Red, Blue navy, Yellow

Bar Graph Option Market Diversification Strategy Ppt PowerPoint Presentation Complete Deck
Share a great deal of information on the topic by deploying this bar graph option market diversification strategy ppt powerpoint presentation complete deck. Support your ideas and thought process with this prefabricated set. It includes a set of eleven slides, all fully modifiable and editable. Each slide can be restructured and induced with the information and content of your choice. You can add or remove large content boxes as well, to make this PPT slideshow more personalized. Its high-quality graphics and visuals help in presenting a well-coordinated pitch. This PPT template is also a resourceful tool to take visual cues from and implement the best ideas to help your business grow and expand. The main attraction of this well-formulated deck is that everything is editable, giving you the freedom to adjust it to your liking and choice. Changes can be made in the background and theme as well to deliver an outstanding pitch. Therefore, click on the download button now to gain full access to this multifunctional set.
Graph With America Flag Americana PowerPoint Themes And PowerPoint Slides 0711
Microsoft PowerPoint Theme and Slide with bar chart and rippled american flag with currency
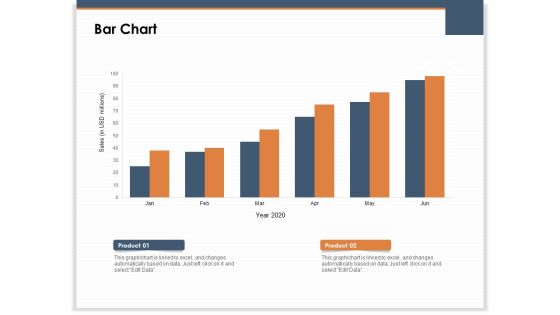
Main Revenues Progress Levers For Each Firm And Sector Bar Chart Ppt PowerPoint Presentation Gallery Skills PDF
Presenting this set of slides with name main revenues progress levers for each firm and sector bar chart ppt powerpoint presentation gallery skills pdf. The topics discussed in these slide is bar chart. This is a completely editable PowerPoint presentation and is available for immediate download. Download now and impress your audience.

Investor Deck For Capital Generation From Substitute Funding Options Clustered Bar Ppt PowerPoint Presentation Outline Graphics Tutorials PDF
Presenting this set of slides with name investor deck for capital generation from substitute funding options clustered bar ppt powerpoint presentation outline graphics tutorials pdf. The topics discussed in these slide is clustered bar. This is a completely editable PowerPoint presentation and is available for immediate download. Download now and impress your audience.

Bar Chart Showing Yearly Income Generated With Export And Import Of Goods Ppt PowerPoint Presentation Gallery Clipart Images PDF
Presenting this set of slides with name bar chart showing yearly income generated with export and import of goods ppt powerpoint presentation gallery clipart images pdf. The topics discussed in these slides are export of goods, import of goods. This is a completely editable PowerPoint presentation and is available for immediate download. Download now and impress your audience.

Bar Chart With Magnifying Glass And Dollar Symbol For Financial Analysis Ppt PowerPoint Presentation File Structure PDF
Presenting this set of slides with name bar chart with magnifying glass and dollar symbol for financial analysis ppt powerpoint presentation file structure pdf. This is a one stage process. The stages in this process is bar chart with magnifying glass and dollar symbol for financial analysis. This is a completely editable PowerPoint presentation and is available for immediate download. Download now and impress your audience.

Graph Finance PowerPoint Themes And PowerPoint Slides 0511
Microsoft PowerPoint Slide and Theme with financial success concept golden compass with growing bar chart from golden coins

Teamwork Concept Business PowerPoint Themes And PowerPoint Slides 0511
Microsoft PowerPoint Theme and Slide with business team adding individual performance bar chart to annual financial chart

Victory Business PowerPoint Themes And PowerPoint Slides 0811
Microsoft PowerPoint Theme and Slide with business man standing on top of graph bars while the competition is being defeated
Pie Chart Business PowerPoint Themes And PowerPoint Slides 0711
Microsoft PowerPoint Theme and Slide with a flat map of the world over top of a transparent three-segment bar chart

Analyzing The Data Business PowerPoint Presentation Slides C
Microsoft PowerPoint Slides and Backgrounds with a magnifying glass hovering over a three dimensional multi colored bar chart
Analyzing The Data Business PowerPoint Presentation Slides Cc
Microsoft PowerPoint Slides and Backgrounds with a magnifying glass hovering over a three dimensional multi colored bar chart
Analyzing The Data Business PowerPoint Presentation Slides F
Microsoft PowerPoint Slides and Backgrounds with a magnifying glass hovering over a three dimensional multi colored bar chart
Analyzing The Data Business PowerPoint Presentation Slides R
Microsoft PowerPoint Slides and Backgrounds with a magnifying glass hovering over a three dimensional multi colored bar chart

Analyzing The Data Business PowerPoint Presentation Slides S
Microsoft PowerPoint Slides and Backgrounds with a magnifying glass hovering over a three dimensional multi colored bar chart

Business Outcomes Analysis Business Man With Pie Bar And Line Chart Ppt PowerPoint Presentation Professional Graphics Download
Presenting this set of slides with name business outcomes analysis business man with pie bar and line chart ppt powerpoint presentation professional graphics download. This is a three stage process. The stages in this process are business outcomes, business results, business output. This is a completely editable PowerPoint presentation and is available for immediate download. Download now and impress your audience.
Histogram Icon Showing Economic Fluctuations Ppt PowerPoint Presentation Slides Samples Cpb
This is a histogram icon showing economic fluctuations ppt powerpoint presentation slides samples cpb. This is a three stage process. The stages in this process are bar chart icon, bar graph icon, data chart icon.
Histogram With Gear Vector Icon Ppt PowerPoint Presentation Professional Slides Cpb
This is a histogram with gear vector icon ppt powerpoint presentation professional slides cpb. This is a three stage process. The stages in this process are bar chart icon, bar graph icon, data chart icon.
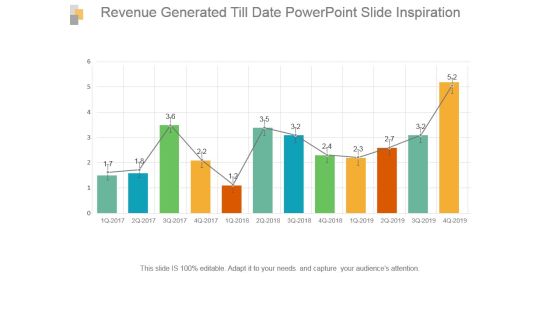
Revenue Generated Till Date Powerpoint Slide Inspiration
This is a revenue generated till date powerpoint slide inspiration. This is a twelve stage process. The stages in this process are bar graph, growth, success, data, analysis.

Clustered Column Ppt PowerPoint Presentation Slide Download
This is a clustered column ppt powerpoint presentation slide download. This is a twelve stage process. The stages in this process are bar graph, marketing, strategy, analysis, business.

Clustered Column Ppt PowerPoint Presentation Slides Visuals
This is a clustered column ppt powerpoint presentation slides visuals. This is a two stage process. The stages in this process are bar graph, marketing, strategy, finance, planning.

Rescue Statistics Business PowerPoint Presentation Slides C
Microsoft PowerPoint Templates and Backgrounds with a multi segment colorful bar chart placed inside of a large red and white lifesaver on a reflective surface
Rescue Statistics Business PowerPoint Presentation Slides Cc
Microsoft PowerPoint Templates and Backgrounds with a multi segment colorful bar chart placed inside of a large red and white lifesaver on a reflective surface
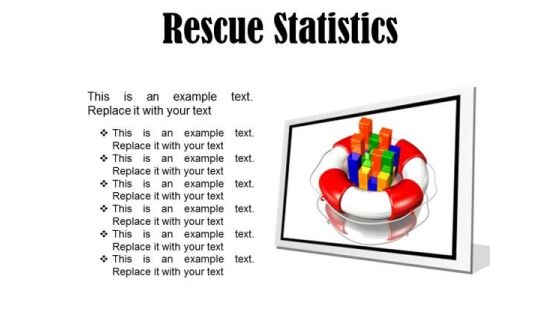
Rescue Statistics Business PowerPoint Presentation Slides F
Microsoft PowerPoint Templates and Backgrounds with a multi segment colorful bar chart placed inside of a large red and white lifesaver on a reflective surface

Rescue Statistics Business PowerPoint Presentation Slides R
Microsoft PowerPoint Templates and Backgrounds with a multi segment colorful bar chart placed inside of a large red and white lifesaver on a reflective surface
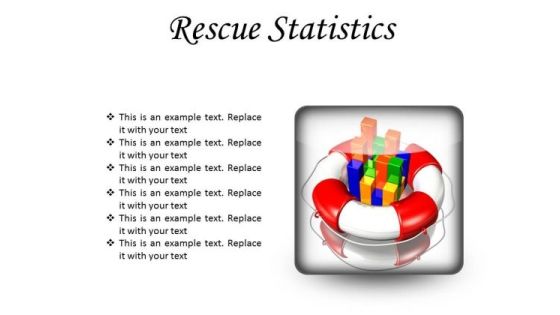
Rescue Statistics Business PowerPoint Presentation Slides S
Microsoft PowerPoint Templates and Backgrounds with a multi segment colorful bar chart placed inside of a large red and white lifesaver on a reflective surface

Stock Photo Smartphone Business Graph PowerPoint Slide
This image slide displays smartphone with bar graph. This image slide has been crafted with graphic of smart phone with bar graph on screen on grey shaded background. Use this image slide to express views on technology and business management. Make wonderful presentations using this image slide.

Business Teamwork Communication PowerPoint Themes And PowerPoint Slides 0611
Microsoft Powerpoint Theme and Slide with cartoon of business executives climbing a bar graph and using teamwork to ascend the obstacle
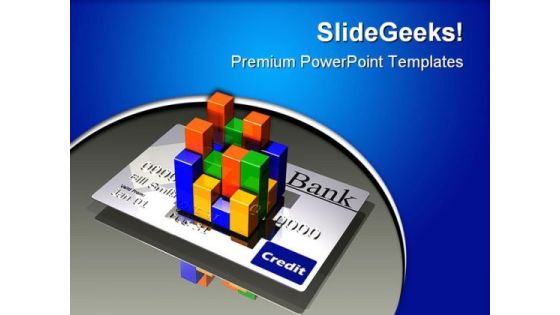
Credit Card Statistics Business PowerPoint Themes And PowerPoint Slides 0811
Microsoft PowerPoint Theme and Slide with f a multi scolored multi segment bar chart placed on top of a silver credit card over a gray reflective surface

Success Industrial PowerPoint Themes And PowerPoint Slides 0511
Microsoft PowerPoint Theme and Slide with 3d illustration of a multi colored bar chart inside the center opening of a large gear

Metallic Globe Global PowerPoint Themes And PowerPoint Slides 0711
Microsoft PowerPoint Theme and Slide with a metallic gray globe sitting on a heavy industrial base of metallic bars and rivets
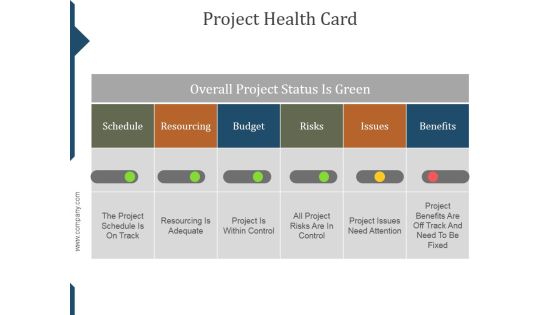
Project Health Card Ppt PowerPoint Presentation Slide Download
This is a project health card ppt powerpoint presentation slide download. This is a four stage process. The stages in this process are column, pie, column, bar.

Stacked Column Template 1 Ppt PowerPoint Presentation Slide
This is a stacked column template 1 ppt powerpoint presentation slide. This is a nine stage process. The stages in this process are bar, graph, business, marketing, strategy.
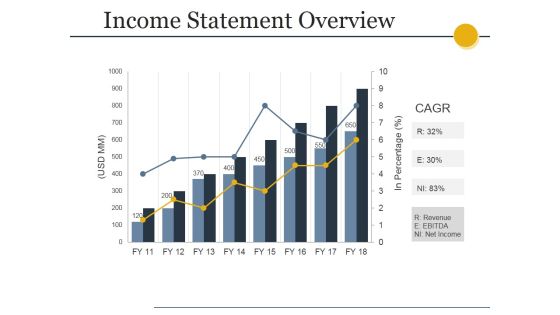
Income Statement Overview Ppt PowerPoint Presentation Professional Slides
This is a income statement overview ppt powerpoint presentation professional slides. This is a eight stage process. The stages in this process are business, marketing, bar, growth, success.

Competitors Analysis 2 Ppt PowerPoint Presentation Slides Gallery
This is a competitors analysis 2 ppt powerpoint presentation slides gallery. This is a four stage process. The stages in this process are revenue, business, marketing, bar, success.

Clustered Column Chart Ppt PowerPoint Presentation Slides Smartart
This is a clustered column chart ppt powerpoint presentation slides smartart. This is a two stage process. The stages in this process are bar, marketing, strategy, planning, finance.

Column Chart Graph Ppt PowerPoint Presentation Slides File Formats
This is a combo chart bar ppt powerpoint presentation slides portfolio. This is a three stage process. The stages in this process are finance, marketing, analysis, investment, million.

Stock Photo Marketing Graph And Folder PowerPoint Slide
Define your ideas in a unique and inspiring manner using this image which contains a graphic of colorful bar graph. This pre-designed and appealing bar graph offers an optimized possibility to illustrate your marketing strategy. Use this Image in presentations relating to business and sales.

About Us Companys Data Information Powerpoint Slides
Download this PowerPoint template to create an attention grabbing introductory slide. It contains slide bar graph with employee image. Use this professional slide design to build a good reputation of your company.
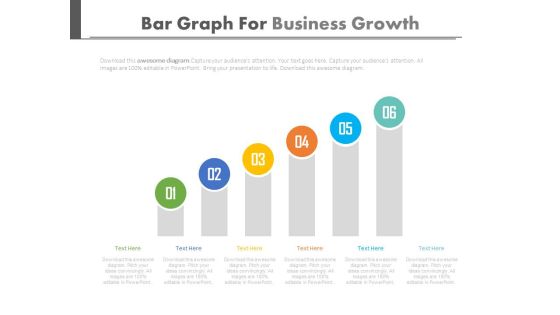
Setting Goals And Developing Strategies Powerpoint Slides
This PowerPoint template is useful for setting goals and developing strategies. This PPT background has a design of six steps bar graph. This PPT slide is suitable for topics like corporate strategic planning.
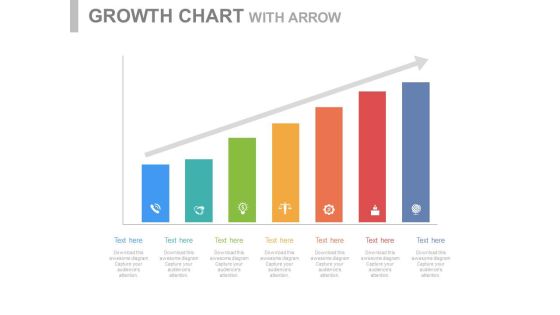
Steps For Developing Strategic Plan Powerpoint Slides
This PowerPoint template is useful for setting goals and developing strategies. This PPT background has a design of seven steps bar graph. This PPT slide is suitable for topics like corporate strategic planning.
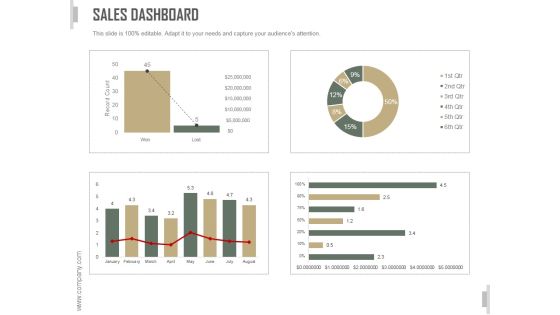
Sales Dashboard Slide Ppt PowerPoint Presentation Template
This is a sales dashboard slide ppt powerpoint presentation template. This is a three stage process. The stages in this process are business, strategy, marketing, analysis, bar graph, growth strategy.
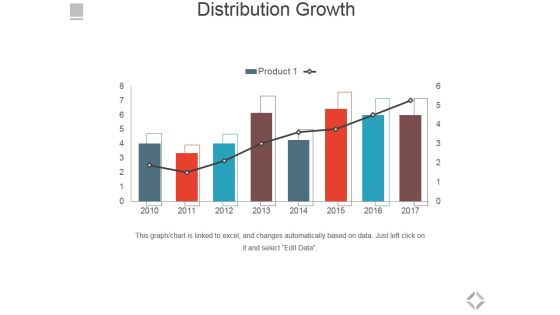
Distribution Growth Ppt PowerPoint Presentation Slides Clipart
This is a distribution growth ppt powerpoint presentation slides clipart. This is a eight stage process. The stages in this process are distribution growth, bar graph, business, marketing, success.
Distribution Growth Ppt PowerPoint Presentation Slides Icons
This is a distribution growth ppt powerpoint presentation slides icons. This is a six stage process. The stages in this process are business, bar graph, finance, marketing, strategy, growth.

Clustered Column Ppt PowerPoint Presentation File Slide
This is a clustered column ppt powerpoint presentation file slide. This is a two stage process. The stages in this process are product, financial year, sales in percentage, bar graph.

Clustered Column Line Ppt PowerPoint Presentation Slide
This is a clustered column line ppt powerpoint presentation slide. This is a three stage process. The stages in this process are bar graph, growth, finance, product, sales in percentage.

Combo Chart Ppt PowerPoint Presentation Summary Slides
This is a combo chart ppt powerpoint presentation summary slides. This is a three stage process. The stages in this process are market size, product, growth rate, bar graph, success.

Clustered Column Ppt PowerPoint Presentation Slides Smartart
This is a clustered column ppt powerpoint presentation slides smartart. This is a two stage process. The stages in this process are product, sales in percentage, financial year, bar graph.

Combo Chart Ppt PowerPoint Presentation Slides Show
This is a combo chart ppt powerpoint presentation slides show. This is a three stage process. The stages in this process are combo chart, market size, product, bar graph, growth.

Arrow Graph Finance PowerPoint Templates And PowerPoint Themes 0612
Arrow Graph Finance PowerPoint Templates And PowerPoint Themes PPT Slides-Microsoft Powerpoint Templates and Background with bars and blue arrow

Lego Growth Graph Business PowerPoint Templates And PowerPoint Themes 0612
Lego Growth Graph Business PowerPoint Templates And PowerPoint Themes PPT Slides-Microsoft Powerpoint Templates and Background with bar graphs
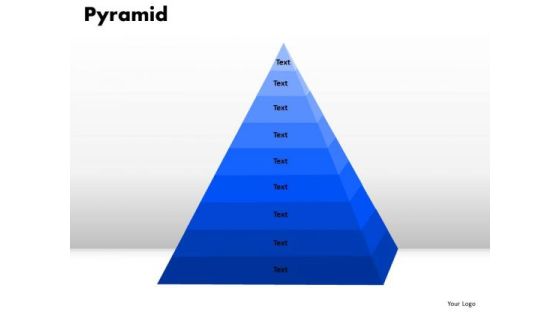
PowerPoint Slides Pyramid Company Ppt Slide Designs
PowerPoint Slides Pyramid Company PPT Slide Designs-Pyramids are truly wonders of the world. Thus a wonderful graphic to impress your audience with your business/professional ideas that are broad based but funnel or narrow down to specific groups, issues or goals. Reach the peak with this graphic-PowerPoint Slides Pyramid Company PPT Slide Designs-This ppt can be used for presentations relating to-3d, Bar, Business, Chart, Class, Conceptual, Corner, FInance, Graph, Graphic, Hierarchy, Investment, Layer, Level, Performance, Planner, Priority, Progress, Pyramid, Render, Status, Strategy, System, Triangle
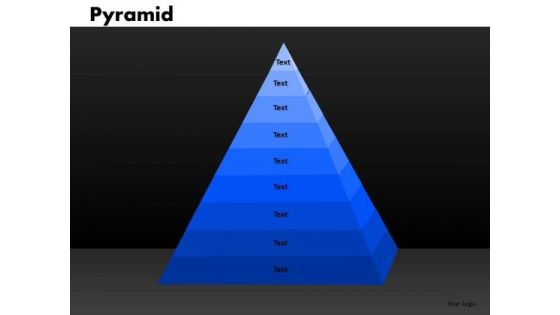
PowerPoint Slide Pyramid Marketing Ppt Slides
PowerPoint Slide Pyramid Marketing PPT Slides-Pyramids are truly wonders of the world. Thus a wonderful graphic to impress your audience with your business/professional ideas that are broad based but funnel or narrow down to specific groups, issues or goals. Reach the peak with this graphic-PowerPoint Slide Pyramid Marketing PPT Slides-This ppt can be used for presentations relating to-3d, Bar, Business, Chart, Class, Conceptual, Corner, FInance, Graph, Graphic, Hierarchy, Investment, Layer, Level, Performance, Planner, Priority, Progress, Pyramid, Render, Status, Strategy, System, Triangle

Cylinder Graph Business PowerPoint Templates And PowerPoint Themes 0512
Microsoft Powerpoint Templates and Background with bar graph-Cylinder Graph Business PowerPoint Templates And PowerPoint Themes 0512-These PowerPoint designs and slide layouts can be used for themes relating to -Bar graph,success, marketing, sales, business, finance
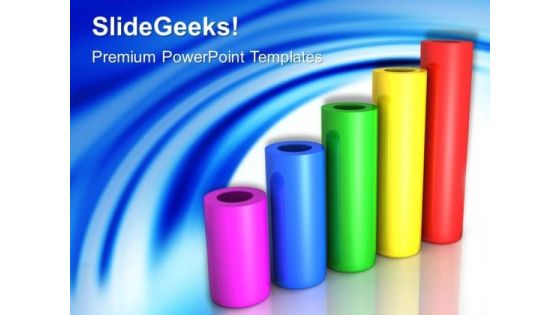
Cylinder Graph Success PowerPoint Templates And PowerPoint Themes 0512
Microsoft Powerpoint Templates and Background with bar graph-Cylinder Graph Success PowerPoint Templates And PowerPoint Themes 0512-These PowerPoint designs and slide layouts can be used for themes relating to -Bar graph,success, marketing, sales, business, finance

Marketing Graph Success PowerPoint Templates And PowerPoint Themes 0512
Microsoft Powerpoint Templates and Background with bar chart growth-Marketing Graph Success PowerPoint Templates And PowerPoint Themes 0512-These PowerPoint designs and slide layouts can be used for themes relating to -Bar chart growth, abstract, business, finance, success, marketing

Profit Graph01 Business PowerPoint Templates And PowerPoint Themes 0512
Microsoft Powerpoint Templates and Background with bar chart growth-Profit Graph01 Business PowerPoint Templates And PowerPoint Themes 0512-These PowerPoint designs and slide layouts can be used for themes relating to -Bar chart growth, shapes, business, finance, success, marketing

Successful Person Business PowerPoint Templates And PowerPoint Themes 0512
Microsoft Powerpoint Templates and Background with businessman and bar graph-Successful Person Business PowerPoint Templates And PowerPoint Themes 0512-These PowerPoint designs and slide layouts can be used for themes relating to -Businessman and bar graph, finance, people, business, shapes, success
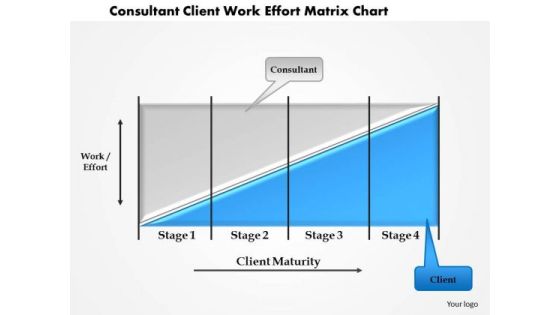
Business Framework Consultant Client Work Effort Matrix Chart PowerPoint Presentation
This business power point template slide has been crafted with graphic of bar graph. This bar graph is called as coase theorem. Use this professional diagram for your result analysis related presentation.
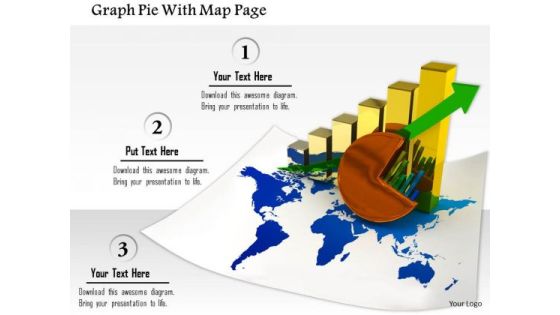
Stock Photo Graph Pie With Map Page PowerPoint Slide
This image slide contains business charts on world map. This image is designed with bar graph and pie chart on world map depicting global economy. Use this image slide to represent financial growth in any business presentation.

Usa Map Chart Americana PowerPoint Presentation Slides C
Microsoft PowerPoint Slides and Backgrounds with of a multicolored bar chart sitting on top of a transparent extruded map of the united states on a medium gray reflective surface
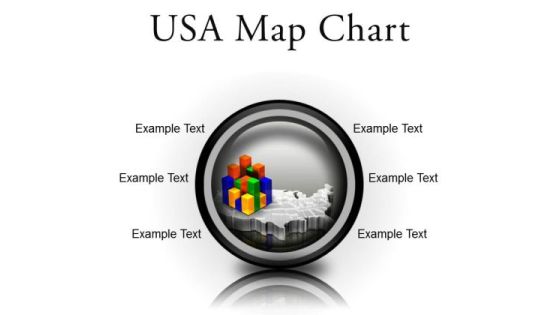
Usa Map Chart Americana PowerPoint Presentation Slides Cc
Microsoft PowerPoint Slides and Backgrounds with of a multicolored bar chart sitting on top of a transparent extruded map of the united states on a medium gray reflective surface
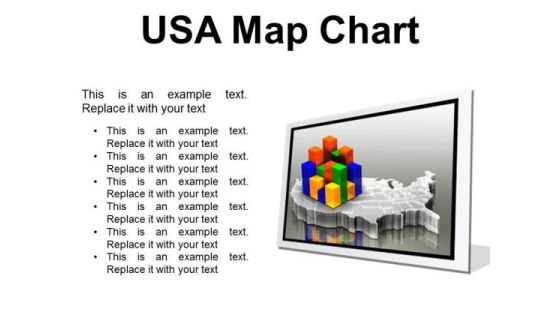
Usa Map Chart Americana PowerPoint Presentation Slides F
Microsoft PowerPoint Slides and Backgrounds with of a multicolored bar chart sitting on top of a transparent extruded map of the united states on a medium gray reflective surface
Usa Map Chart Americana PowerPoint Presentation Slides R
Microsoft PowerPoint Slides and Backgrounds with of a multicolored bar chart sitting on top of a transparent extruded map of the united states on a medium gray reflective surface
Usa Map Chart Americana PowerPoint Presentation Slides S
Microsoft PowerPoint Slides and Backgrounds with of a multicolored bar chart sitting on top of a transparent extruded map of the united states on a medium gray reflective surface
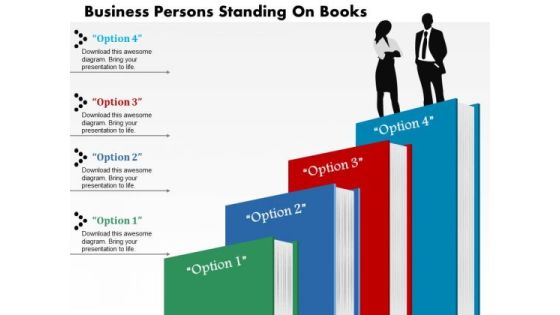
Business Diagram Persons Standing On Books Presentation Slide Template
This power point diagram template has been crafted with graphic of bar graph made with books and 3d man. This diagram template contains the concept of education and success. Use this diagram slide for your business and education presentation.

Stock Photo Business Graph Of Two Thousand Fifteen PowerPoint Slide
This Business Power Point image template has been designed with graphic of bar graph of 2015 year text. This image template contains the concept of new year planning. This image slide can be used for business and finance related presentations.
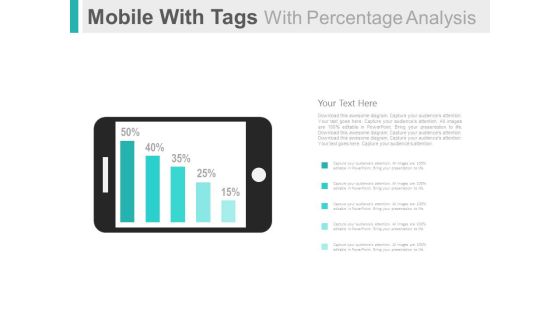
Mobile For Online Survey And Analysis Powerpoint Slides
This PowerPoint template has been designed with graphics of mobile and percentage bar graph. This PPT slide can be used to display online survey and analysis. You can download finance PowerPoint template to prepare awesome presentations.
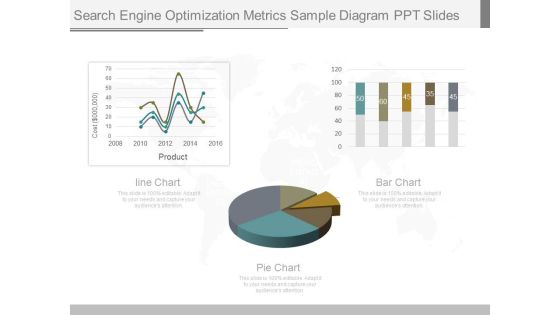
Search Engine Optimization Metrics Sample Diagram Ppt Slides
This is a search engine optimization metrics sample diagram ppt slides. This is a three stage process. The stages in this process are cost, product, line chart, bar chart, pie chart.
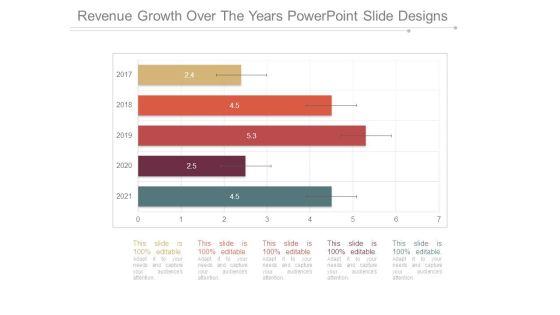
Revenue Growth Over The Years Powerpoint Slide Designs
This is a revenue growth over the years powerpoint slide designs. This is a five stage process. The stages in this process are bar graph, years, business, growth, marketing.
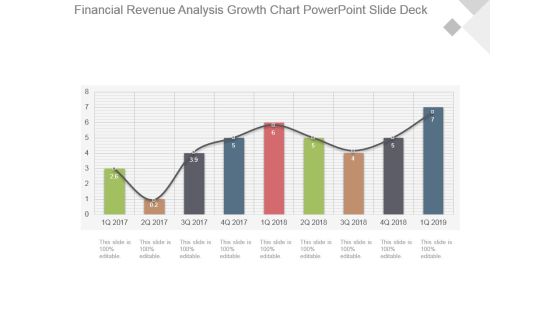
Financial Revenue Analysis Growth Chart Powerpoint Slide Deck
This is a financial revenue analysis growth chart powerpoint slide deck. This is a nine stage process. The stages in this process are growth, success, business, marketing, bar graph.
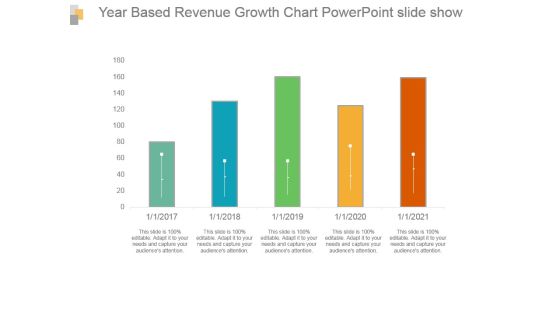
Year Based Revenue Growth Chart Powerpoint Slide Show
This is a year based revenue growth chart powerpoint slide show. This is a five stage process. The stages in this process are bar graph, growth, revenue, year, success.
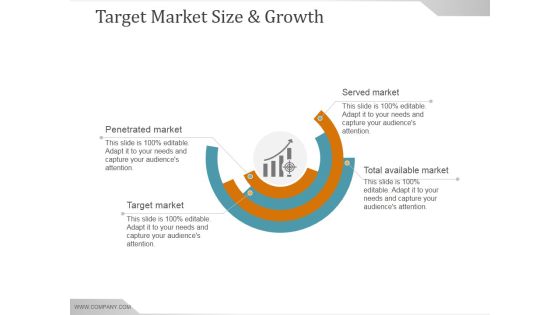
Target Market Size And Growth Ppt PowerPoint Presentation Slide Download
This is a target market size and growth ppt powerpoint presentation slide download. This is a eight stage process. The stages in this process are business, marketing, success, planning, bar graph.

Clustered Column Line Ppt PowerPoint Presentation Summary Slides
This is a clustered column line ppt powerpoint presentation summary slides. This is a four stage process. The stages in this process are bar graph, growth, success, business, marketing.

Profit After Tax Pat Ppt PowerPoint Presentation Inspiration Slide
This is a profit after tax pat ppt powerpoint presentation inspiration slide. This is a five stage process. The stages in this process are bar graph, business, marketing, growth, management.

Data Analytics Ppt PowerPoint Presentation Icon Master Slide
This is a data analytics ppt powerpoint presentation icon master slide. This is a five stage process. The stages in this process are bar graph, growth, success, business, marketing.

Clustered Column Line Chart Ppt PowerPoint Presentation Professional Slides
This is a clustered column line chart ppt powerpoint presentation professional slides. This is a four stage process. The stages in this process are bar, finance, business, marketing, growth.
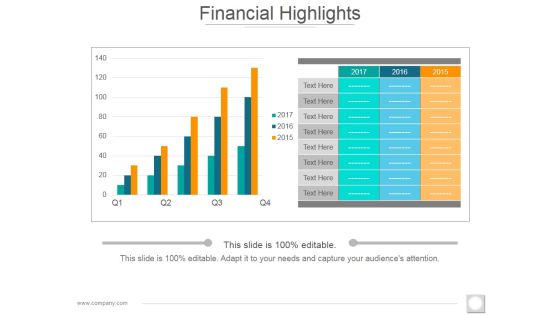
Financial Highlights Template 2 Ppt PowerPoint Presentation Slides Ideas
This is a financial highlights template 2 ppt powerpoint presentation slides ideas. This is a two stage process. The stages in this process are bar graph, growth, success, business, marketing.

Competitor Analysis Graph Ppt PowerPoint Presentation Slides Elements
This is a competitor analysis graph ppt powerpoint presentation slides elements. This is a five stage process. The stages in this process are bar graph, finance, marketing, strategy, business.
Product Launch Budget Plan Ppt PowerPoint Presentation Icon Slide
This is a product launch budget plan ppt powerpoint presentation icon slide. This is a seven stage process. The stages in this process are bar graph, icons, percentage, finance, business.

Column Chart Ppt PowerPoint Presentation Slides Visual Aids
This is a column chart ppt powerpoint presentation slides visual aids. This is a six stage process. The stages in this process are bar graph, growth, success, sales in percentage, financial year.

Combo Chart Ppt PowerPoint Presentation Inspiration Slide Portrait
This is a combo chart ppt powerpoint presentation inspiration slide portrait. This is a three stage process. The stages in this process are product, market size, bar chart, growth, success.
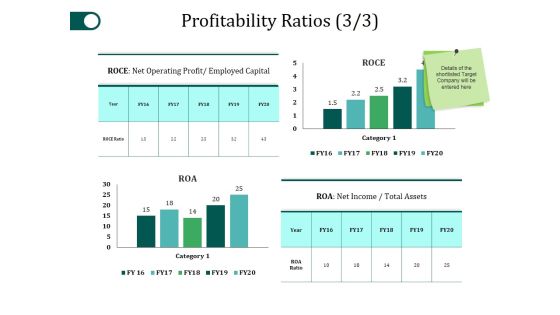
Profitability Ratios Template 3 Ppt PowerPoint Presentation Gallery Slide Portrait
This is a profitability ratios template 3 ppt powerpoint presentation gallery slide portrait. This is a four stage process. The stages in this process are category, roce, net income, business, bar graph.

Column Chart Ppt PowerPoint Presentation Portfolio Slide Download
This is a column chart ppt powerpoint presentation portfolio slide download. This is a two stage process. The stages in this process are product, year, bar graph, success, business.

Market Potential Ppt PowerPoint Presentation Complete Deck With Slides
This is a market potential ppt powerpoint presentation complete deck with slides. This is a one stage process. The stages in this process are market, potential, business, management, bar graph.

Column Chart Ppt PowerPoint Presentation Gallery Slide Portrait
This is a column chart ppt powerpoint presentation gallery slide portrait. This is a two stage process. The stages in this process are sales in percentage, financial year, product, bar graph, growth.
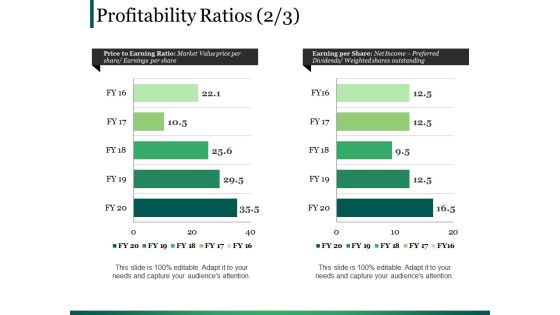
Profitability Ratios Template 3 Ppt PowerPoint Presentation Slides Good
This is a profitability ratios template 3 ppt powerpoint presentation slides good. This is a two stage process. The stages in this process are business, marketing, bar, finance, planning.

Actual Vs Target Sales Ppt PowerPoint Presentation Slides Template
This is a actual vs target sales ppt powerpoint presentation slides template. This is a seven stage process. The stages in this process are bar chart, marketing, strategy, finance, planning.

Stacked Area Clustered Column Ppt PowerPoint Presentation Summary Slides
This is a stacked area clustered column ppt powerpoint presentation summary slides. This is a three stage process. The stages in this process are product, in percentage, financial year, bar graph.
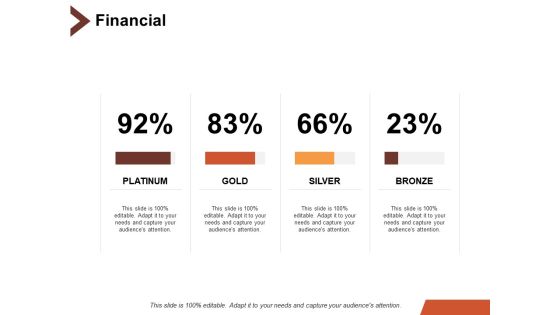
Financial Business Marketing Ppt PowerPoint Presentation Slides Aids
This is a financial business marketing ppt powerpoint presentation slides aids. This is a four stage process. The stages in this process are bar chart, finance, marketing, business, analysis.

Data Collection Histograms Ppt PowerPoint Presentation Icon Slides
This is a data collection histograms ppt powerpoint presentation icon slides. This is a two stage process. The stages in this process are bar chart, finance, marketing, business, analysis.

Presenting Global Issues PowerPoint Templates Ppt Backgrounds For Slides 0613
Raise The Bar With Our science Power Point Templates. They Are Programmed To Take You To The Next Level. Our business Power Point Templates Bring A Lot To The Table. Their Alluring Flavors Will Make Your Audience Salivate.
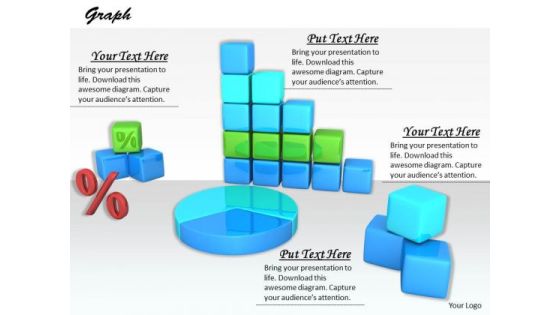
Stock Photo Design For Graphical Representations Of Data PowerPoint Slide
The above image contains a graphic of charts and graphs. Use this professional image in business or sales related presentations. It helps you to explain your plans in all earnest to your colleagues and raise the bar for all.

Business Diagram Colored Column Chart For Result Analysis PowerPoint Slide
This Power Point diagram has been designed with graphic of column chart. It contains diagram of bar char depicting annual business progress report. Use this diagram to build professional presentations for your viewers.
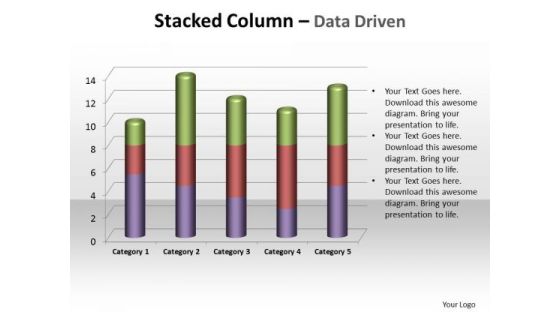
Business Company PowerPoint Templates Business Stacked Column Ppt Slides
Business Company PowerPoint Templates Business stacked column PPT Slides-This PowerPoint slide has a stacked bar chart that looks elegant because of its shape and the unique angle in which it appears. you can easily edit the size, position and text and change the colors. . -Business Company PowerPoint Templates Business stacked column PPT Slides-This ppt can be used for concepts relating to-, Area, Bar, Block, Business, Chart, Color, Colour, Column, Cone, Decline, Fill, Finance, Financial, Gradient, Graph, etc
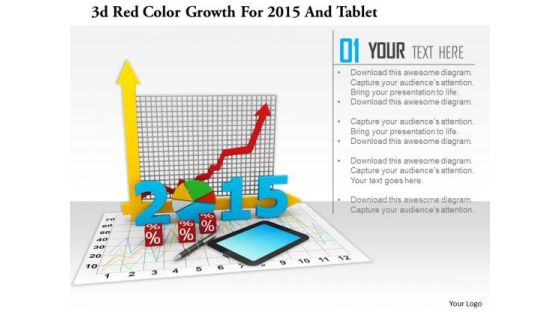
Stock Photo 3d Red Color Growth For 2015 And Tablet PowerPoint Slide
This image slide has graphics of financial charts and reports. This contains bar graph and pie chart to present business reports. Build an innovative presentation using this professional image slide.
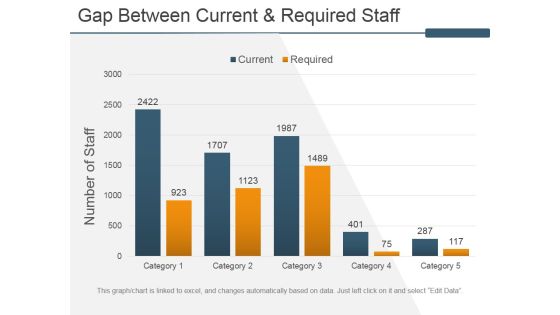
Gap Between Current And Required Staff Ppt PowerPoint Presentation Inspiration Slides
This is a gap between current and required staff ppt powerpoint presentation inspiration slides. This is a five stage process. The stages in this process are number of staff, bar graph, business, marketing, success.

Volume High Low Close Chart Ppt PowerPoint Presentation Visual Aids Slides
This is a volume high low close chart ppt powerpoint presentation visual aids slides. This is a two stage process. The stages in this process are bar graph, marketing, strategy, finance, planning.

Stack Of Poker Chips In Casino PowerPoint Templates Ppt Backgrounds For Slides 0513
Raise The Bar With Our competition Power Point Templates. They Are Programmed To Take You To The Next Level. Our finance Power Point Templates Bring A Lot To The Table. Their Alluring Flavors Will Make Your Audience Salivate.

Show Your Creativity In Business PowerPoint Templates Ppt Backgrounds For Slides 0513
Raise The Bar With Our marketing Power Point Templates. They Are Programmed To Take You To The Next Level. Our spheres Power Point Templates Bring A Lot To The Table. Their Alluring Flavors Will Make Your Audience Salivate.

Select A Suitable Medicine For Disease PowerPoint Templates Ppt Backgrounds For Slides 0513
Raise The Bar With Our medical Power Point Templates. They Are Programmed To Take You To The Next Level. Our health Power Point Templates Bring A Lot To The Table. Their Alluring Flavors Will Make Your Audience Salivate.

Global Communication For Business Growth PowerPoint Templates Ppt Backgrounds For Slides 0613
Raise the bar with our Globe Powerpoint Templates. They are programmed to take you to the next level. Our People Powerpoint Templates bring a lot to the table. Their alluring flavours will make your audience salivate.

Fort With Light House PowerPoint Templates Ppt Backgrounds For Slides 0613
Raise the bar with our Nature Powerpoint Templates. They are programmed to take you to the next level. Our Environment Powerpoint Templates bring a lot to the table. Their alluring flavours will make your audience salivate.
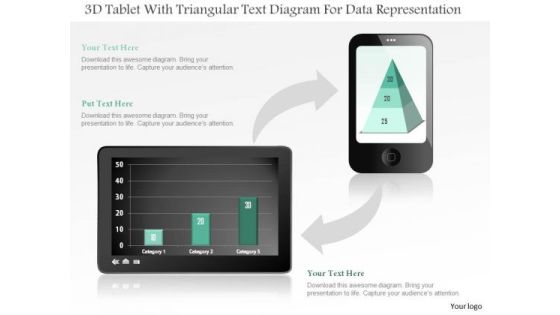
Business Diagram 3d Tablet With Triangular Text Diagram For Data Representation PowerPoint Slide
This business diagram displays bar graph on tablet and pyramid chart on mobile phone. Use this diagram, to make reports for interactive business presentations. Create professional presentations using this diagram.

 Home
Home