Slider Scale

Distribution Growth Bar Graph Powerpoint Slide Background
This is a distribution growth bar graph powerpoint slide background. This is a eight stage process. The stages in this process are growth, bar graph, business, marketing, success.

Bar Graph Ppt PowerPoint Presentation Slides
This is a bar graph ppt powerpoint presentation slides. This is a four stage process. The stages in this process are bar graph, business, management, marketing, success.

Bar Graph Ppt PowerPoint Presentation Slide
This is a bar graph ppt powerpoint presentation slide. This is a six stage process. The stages in this process are bar graph, analysis, marketing, strategy, business, finance.

Clustered Bar Ppt PowerPoint Presentation Slide Download
This is a clustered bar ppt powerpoint presentation slide download. This is a four stage process. The stages in this process are bar, graph, business, marketing, strategy.

Bar Graph Ppt PowerPoint Presentation Slides Model
This is a bar graph ppt powerpoint presentation slides model. This is a eight stage process. The stages in this process are business, marketing, bar graph, management, timeline.

Bar Graph Ppt PowerPoint Presentation Slides Portfolio
This is a bar graph ppt powerpoint presentation slides portfolio. This is a three stage process. The stages in this process are business, marketing, management, bar graph, product.

Bar Chart Ppt PowerPoint Presentation Slides Shapes
This is a bar chart ppt powerpoint presentation slides shapes. This is a seven stage process. The stages in this process are bar graph, finance, marketing, strategy, analysis.

Bar Graph Ppt PowerPoint Presentation Slides Designs
This is a bar graph ppt powerpoint presentation slides designs. This is a five stage process. The stages in this process are bar graph, business, marketing, plan, financial.
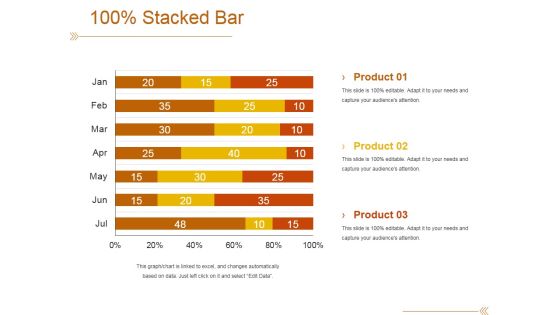
Stacked Bar Ppt PowerPoint Presentation Slides Show
This is a stacked bar ppt powerpoint presentation slides show. This is a three stage process. The stages in this process are product, stacked bar, step, business, marketing.

Bar Chart Ppt PowerPoint Presentation Show Slides
This is a bar chart ppt powerpoint presentation show slides. This is a three stage process. The stages in this process are business, marketing, strategy, bar, finance.

Clustered Bar Ppt PowerPoint Presentation Slides Gallery
This is a clustered bar ppt powerpoint presentation slides gallery. This is a two stage process. The stages in this process are clustered bar, business, finance, marketing, strategy.

Clustered Bar Ppt PowerPoint Presentation Slides Ideas
This is a clustered bar ppt powerpoint presentation slides ideas. This is a two stage process. The stages in this process are bar graph, growth, success, business, marketing.

Clustered Bar Ppt PowerPoint Presentation Slides Deck
This is a clustered bar ppt powerpoint presentation slides deck. This is a two stage process. The stages in this process are product, profit, bar graph.

Stacked Bar Ppt PowerPoint Presentation Slides Templates
This is a stacked bar ppt powerpoint presentation slides templates. This is a two stage process. The stages in this process are stacked bar, product, percentage, finance, business.

Bar Chart Ppt PowerPoint Presentation Portfolio Slides
This is a bar chart ppt powerpoint presentation portfolio slides. This is a one stage process. The stages in this process are product, percentage, marketing, business, bar chart.
Bar Graph Business PowerPoint Presentation Slides C
Microsoft PowerPoint Slides and Backgrounds with style of a vector bar graph
Bar Graph Business PowerPoint Presentation Slides Cc
Microsoft PowerPoint Slides and Backgrounds with style of a vector bar graph
Bar Graph Business PowerPoint Presentation Slides F
Microsoft PowerPoint Slides and Backgrounds with style of a vector bar graph
Bar Graph Business PowerPoint Presentation Slides R
Microsoft PowerPoint Slides and Backgrounds with style of a vector bar graph
Bar Graph Business PowerPoint Presentation Slides S
Microsoft PowerPoint Slides and Backgrounds with style of a vector bar graph

Bar Graph Ppt PowerPoint Presentation File Slides
This is a bar graph ppt powerpoint presentation file slides. This is a three stage process. The stages in this process are product, sales in percentage, bar graph, growth, success.

Bar Chart Ppt PowerPoint Presentation Slides Model
This is a bar chart ppt powerpoint presentation slides model. This is a two stage process. The stages in this process are bar chart, analysis, business, marketing, strategy, finance.
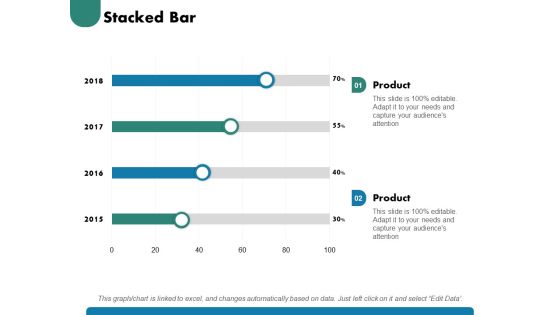
Stacked Bar Ppt PowerPoint Presentation Slides Demonstration
This is a stacked bar ppt powerpoint presentation slides demonstration. This is a two stage process. The stages in this process are stacked bar, finance, marketing, management, investment, analysis.

Employee Photo With Percentage Bars Powerpoint Slides
This dashboard template contains employee photo with percentage bars. This dashboard PowerPoint template conveys employees performance in a visual manner. Download this PPT slide for quick decision-making.

Media Mix Optimization Bar Chart Ppt Slides
This is a media mix optimization bar chart ppt slides. This is a one stage process. The stages in this process are business, media, success.

Portfolio Evaluation Bar Graph Ppt Slides
This is a portfolio evaluation bar graph ppt slides. This is a five stage process. The stages in this process are business, finance, marketing.

Security Analysis Bar Graph Ppt Slides
This is a security analysis bar chart ppt slides. This is a one stage process. The stages in this process are business, finance, marketing.

Target Modelling Bar Chart Ppt Slides
This is a target modelling bar chart ppt slides. This is a six stage process. The stages in this process are arrows, business, success.
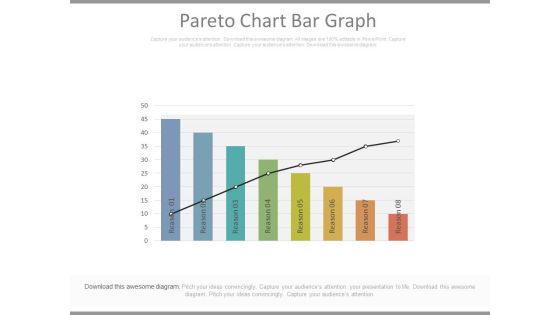
Pareto Chart Bar Graph Ppt Slides
This is a pareto chart bar graph ppt slides. This is a eight stage process. The stages in this process are business, marketing, success.\n
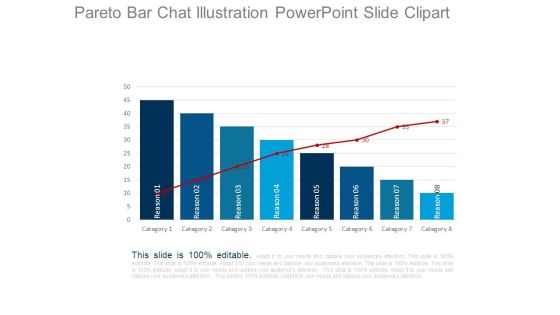
Pareto Bar Chat Illustration Powerpoint Slide Clipart
This is a pareto bar chat illustration powerpoint slide clipart. This is a eight stage process. The stages in this process are category, reason.

Bar Graph Ppt PowerPoint Presentation Slide Download
This is a bar graph ppt powerpoint presentation slide download. This is a five stage process. The stages in this process are arrow, business, bargraph, growth, success.

Bar Graph Ppt PowerPoint Presentation Slides Format
This is a bar graph ppt powerpoint presentation slides format. This is a two stage process. The stages in this process are business, marketing, growth, planning, sales plan.

Bar Graph Ppt PowerPoint Presentation Outline Slides
This is a bar graph ppt powerpoint presentation outline slides. This is a three stage process. The stages in this process are business, marketing, management, analysis, growth.

Bar Graph Ppt Powerpoint Presentation Slides Example
This is a bar graph ppt powerpoint presentation slides example. This is a five stage process. The stages in this process are graph, business, marketing, finance.

Clustered Bar Ppt PowerPoint Presentation Model Slides
This is a clustered bar ppt powerpoint presentation model slides. This is a two stage process. The stages in this process are product, profit, business, finance, percentage.

Clustered Bar Ppt PowerPoint Presentation Icon Slides
This is a clustered bar ppt powerpoint presentation icon slides. This is a two stage process. The stages in this process are profit, business, marketing, finance, chart.

Clustered Bar Ppt PowerPoint Presentation Slides Show
This is a clustered bar ppt powerpoint presentation slides show. This is a three stage process. The stages in this process are finance, analysis, business, strategy, marketing.

Stacked Bar Ppt PowerPoint Presentation Pictures Slides
This is a stacked bar ppt powerpoint presentation pictures slides. This is a two stage process. The stages in this process are business, marketing, graph, finance, strategy.

Bar Graph Ppt PowerPoint Presentation Inspiration Slides
This is a bar graph ppt powerpoint presentation inspiration slides. This is a six stage process. The stages in this process are sales in percentage, financial year, product.

Bar Graph Ppt PowerPoint Presentation Slides Slideshow
This is a bar graph ppt powerpoint presentation slides slideshow. This is a three stage process. The stages in this process are business, finance, marketing, strategy, planning.

Bar Graph Ppt PowerPoint Presentation Show Slides
This is a bar graph ppt powerpoint presentation show slides. This is a two stage process. The stages in this process are finance, marketing, management, investment, analysis.

Bar Graph Ppt PowerPoint Presentation Portfolio Slide
Presenting this set of slides with name bar graph ppt powerpoint presentation portfolio slide. The topics discussed in these slide is bar graph. This is a completely editable PowerPoint presentation and is available for immediate download. Download now and impress your audience.

Bar Graph With Five Icons Powerpoint Slides
This PowerPoint slide contains diagram bar graph with icons. This PPT slide helps to exhibit concepts of financial deal and planning. Use this business slide to make impressive presentations.

Bar Graph For Statistical Analysis Powerpoint Slides
This PowerPoint template has been designed with bar chart and percentage values. You may download this PPT slide to depict statistical analysis. Add this slide to your presentation and impress your superiors.

Bar Chart For Strategic Planning Powerpoint Slides
This PowerPoint template has been designed with bar graph with two teams. This diagram is useful to exhibit strategic planning. This diagram slide can be used to make impressive presentations.

Pareto Analysis Bar Graph Powerpoint Slide Deck
This is a pareto analysis bar graph powerpoint slide deck. This is a ten stage process. The stages in this process are restaurant complaints, total complaints, complaints pricing and service, pricing and service, analysis bring down complaints, category.

Bar Graph Ppt PowerPoint Presentation Slides Deck
This is a bar graph ppt powerpoint presentation slides deck. This is a three stage process. The stages in this process are financial in years, product, sales in percentage.

Bar Chart Ppt PowerPoint Presentation File Slide
This is a bar chart ppt powerpoint presentation file slide. This is a one stage process. The stages in this process are sales in percentage financial years, business, marketing, strategy, graph.

Bar Chart Ppt PowerPoint Presentation Slide Download
This is a bar chart ppt powerpoint presentation slide download. This is a three stage process. The stages in this process are chart, in years, unit count, business, marketing.

Bar Graph Displaying Profit Growth Powerpoint Slides
This PowerPoint template has been designed with six point?s bar graph with icons. This PPT slide can be used to prepare presentations for marketing reports and also for financial data analysis. You can download finance PowerPoint template to prepare awesome presentations.
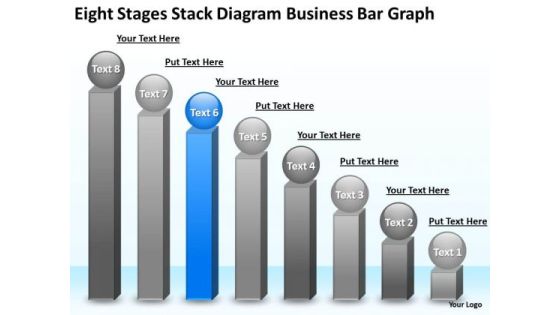
Business PowerPoint Presentations Bar Graph Plan Slides
We present our business powerpoint presentations bar graph plan Slides.Present our Business PowerPoint Templates because It will Raise the bar of your Thoughts. They are programmed to take you to the next level. Download our Spheres PowerPoint Templates because You can Channelise the thoughts of your team with our PowerPoint Templates and Slides. Urge them to focus on the goals you have set. Download our Competition PowerPoint Templates because Our PowerPoint Templates and Slides will let you Leave a lasting impression to your audiences. They possess an inherent longstanding recall factor. Present our Shapes PowerPoint Templates because It will get your audience in sync. Use our Success PowerPoint Templates because Our PowerPoint Templates and Slides will let you Leave a lasting impression to your audiences. They possess an inherent longstanding recall factor.Use these PowerPoint slides for presentations relating to bar, graph, statistics, economy, render, success, representation, diagram, graphic, achievment, obstruction, chevron, accounting, finances, energy eco, steps, figure, tall, barrier, strategy, ladder, up, planning, high, climb, stripes, growth, maintenance, profit, successful, repair, return, gradient, sustainability, financial, construction, upwards, increasing. The prominent colors used in the PowerPoint template are Blue, Gray, White.
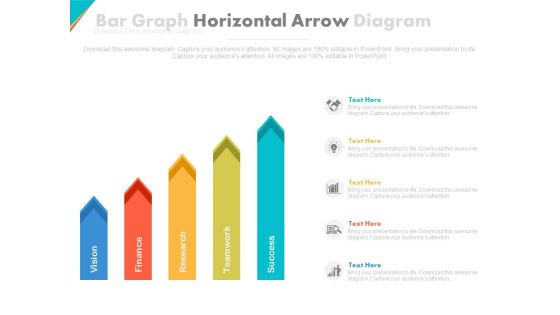
Five Horizontal Arrows Bar Graph Powerpoint Slides
This PowerPoint template contains five horizontal arrows bra graph. You may download this PPT slide design to display steps of strategic planning. You can easily customize this template to make it more unique as per your need.

Bar Graph Ppt PowerPoint Presentation Model
This is a bar graph ppt powerpoint presentation model. This is a five stage process. The stages in this process are business, marketing, bar slides, management, finance.

Business Framework Bar Chart In PowerPoint Presentation
This power point diagram slide has been designed with graphic of bar chart. In this diagram slide we have used green and blue colored vertical bar graph. Display result analysis with this bar graph diagram and use it in your result verification and analysis related presentations.

Bar Graph For Business Growth Powerpoint Templates
This PowerPoint slide contains graphics bar chart. This slide helps to exhibit business growth analysis. Sparkling thoughts are swirling around in your head. Filter them through with this diagram slide.
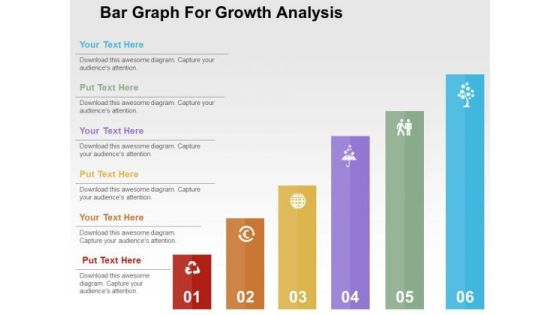
Bar Graph For Growth Analysis PowerPoint Template
This slide contains graphics bar chart. This slide helps to exhibit business growth analysis. Sparkling thoughts are swirling around in your head. Filter them through with this diagram slide.

Bars Displaying Percentage Growth PowerPoint Templates
Our above PPT slide contains bar graph displaying percentage growth. This diagram of bar graph helps to depict statistical information. Use this diagram to impart more clarity to data and to create more sound impact on viewers.
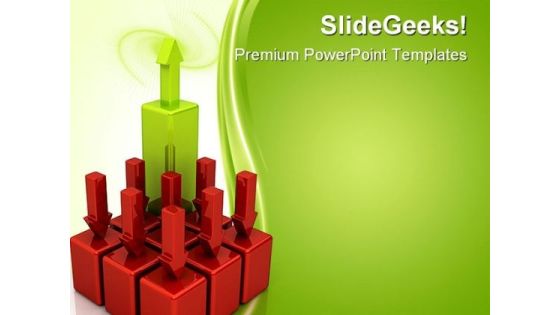
Bars Rising Business PowerPoint Themes And PowerPoint Slides 0411
Microsoft PowerPoint Theme and Slide with many falling red bars and one green rising bar

Bar Graph On Tablet PowerPoint Templates
Create dynamic presentations with our professional template containing diagram of bar graph on computer tablet. You may use this slide to portray concepts like business, growth, success etc. Present your views using our innovative slide.
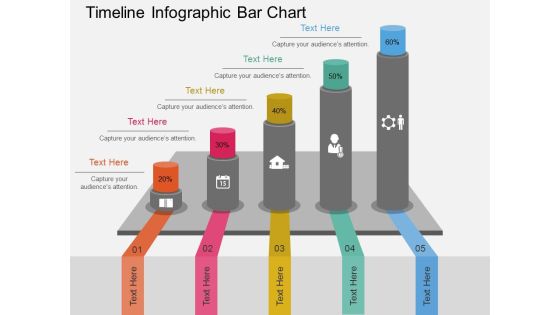
Timeline Infographic Bar Chart Powerpoint Template
This business diagram has been designed with timeline infographic bar chart. You may use this slide to display success and growth concepts. Make your mark with this unique slide and create an impression that will endure.

 Home
Home