Sections

Combo Chart Ppt PowerPoint Presentation Summary Slides
This is a combo chart ppt powerpoint presentation summary slides. This is a three stage process. The stages in this process are market size, product, growth rate, bar graph, success.
Stacked Area Clustered Column Ppt PowerPoint Presentation Icon Aids
This is a stacked area clustered column ppt powerpoint presentation icon aids. This is a three stage process. The stages in this process are business, marketing, finance, bar, graph.

Clustered Column Ppt PowerPoint Presentation Slides Smartart
This is a clustered column ppt powerpoint presentation slides smartart. This is a two stage process. The stages in this process are product, sales in percentage, financial year, bar graph.
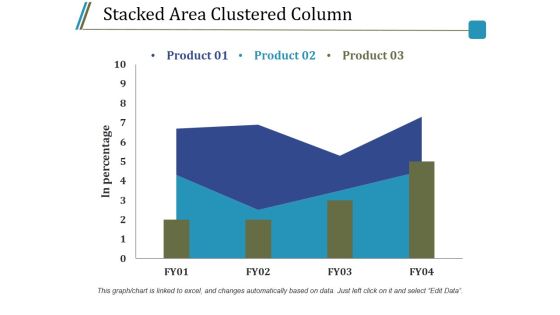
Stacked Area Clustered Column Ppt PowerPoint Presentation Model Guidelines
This is a stacked area clustered column ppt powerpoint presentation model guidelines. This is a three stage process. The stages in this process are product, in percentage, bar graph, growth, success.
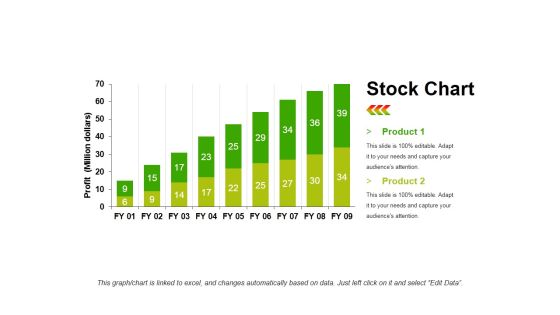
Stock Chart Template 1 Ppt PowerPoint Presentation Infographic Template Objects
This is a stock chart template 1 ppt powerpoint presentation infographic template objects. This is a two stage process. The stages in this process are product, profit, bar graph, growth, success.

Stacked Area Clustered Column Ppt PowerPoint Presentation File Background Designs
This is a stacked area clustered column ppt powerpoint presentation file background designs. This is a three stage process. The stages in this process are product, in percentage, growth, success, bar graph.

Clustered Column Line Ppt PowerPoint Presentation Icon Ideas
This is a clustered column line ppt powerpoint presentation icon ideas. This is a three stage process. The stages in this process are product, in percentage, bar graph, success, growth.

Clustered Column Template 1 Ppt PowerPoint Presentation Outline File Formats
This is a clustered column template 1 ppt powerpoint presentation outline file formats. This is a two stage process. The stages in this process are product, bar graph, success, growth, finance.

Clustered Column Template 2 Ppt PowerPoint Presentation Summary Smartart
This is a clustered column template 2 ppt powerpoint presentation summary smartart. This is a two stage process. The stages in this process are product, bar graph, in percentage, clustered column, growth.

Stacked Area Clustered Column Ppt PowerPoint Presentation Summary Professional
This is a stacked area clustered column ppt powerpoint presentation summary professional. This is a three stage process. The stages in this process are product, bar graph, growth, success, in percentage.
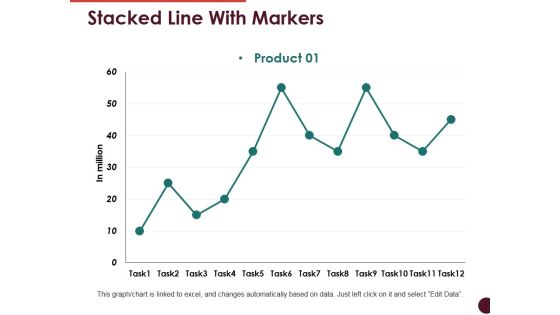
Stacked Line With Markers Ppt PowerPoint Presentation Show Templates
This is a stacked line with markers ppt powerpoint presentation show templates. This is a one stage process. The stages in this process are product, bar graph, growth, success, business.

Column Chart Ppt PowerPoint Presentation Model Graphics Download
This is a column chart ppt powerpoint presentation model graphics download. This is a two stage process. The stages in this process are product, financial year, sales in percentage, bar graph, success.
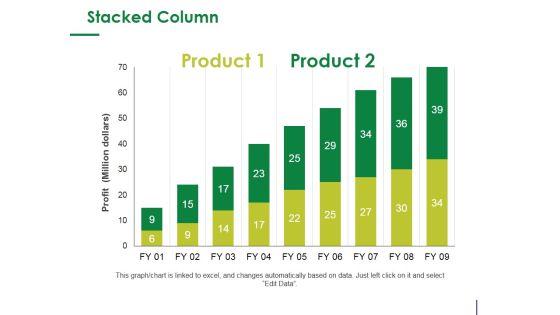
Stacked Column Ppt PowerPoint Presentation Infographic Template Design Ideas
This is a stacked column ppt powerpoint presentation infographic template design ideas. This is a two stage process. The stages in this process are product, profit, bar graph, growth, success.

Competitor Revenue And Profit Template 1 Ppt PowerPoint Presentation Infographic Template Designs Download
This is a competitor revenue and profit template 1 ppt powerpoint presentation infographic template designs download. This is a five stage process. The stages in this process are revenue, profit, competitor, bar graph, growth.

Column Chart Ppt PowerPoint Presentation Model Clipart Images
This is a column chart ppt powerpoint presentation model clipart images. This is a two stage process. The stages in this process are product, bar graph, growth, success, business.

Combo Chart Ppt PowerPoint Presentation Inspiration Background
This is a combo chart ppt powerpoint presentation inspiration background. This is a three stage process. The stages in this process are product, bar graph, market size, growth, growth rate.

Budgeting Planned Actual Comparison Ppt PowerPoint Presentation Portfolio Background
This is a budgeting planned actual comparison ppt powerpoint presentation portfolio background. This is a three stage process. The stages in this process are planned cost, actual cost, value difference, deviation, bar graph.

Column Chart Ppt PowerPoint Presentation Infographics Deck
This is a column chart ppt powerpoint presentation infographics deck. This is a two stage process. The stages in this process are product, expenditure in, years, bar graph, growth.

Product Launch Budget Plan Ppt PowerPoint Presentation File Formats
This is a product launch budget plan ppt powerpoint presentation file formats. This is a seven stage process. The stages in this process are business, marketing, strategy, planning, bar graph.

Clustered Column Line Ppt PowerPoint Presentation Icon Good
This is a clustered column line ppt powerpoint presentation icon good. This is a three stage process. The stages in this process are product, financial year, bar graph, business, growth.

Combo Chart Ppt PowerPoint Presentation Slides Show
This is a combo chart ppt powerpoint presentation slides show. This is a three stage process. The stages in this process are combo chart, market size, product, bar graph, growth.

Budgeting Template 3 Ppt PowerPoint Presentation Visual Aids Model
This is a budgeting template 3 ppt powerpoint presentation visual aids model. This is a five stage process. The stages in this process are bar graph, business, marketing, finance, planning.

Combo Chart Ppt PowerPoint Presentation File Visual Aids
This is a combo chart ppt powerpoint presentation file visual aids. This is a two stage process. The stages in this process are bar graph, business, marketing, finance, planning.
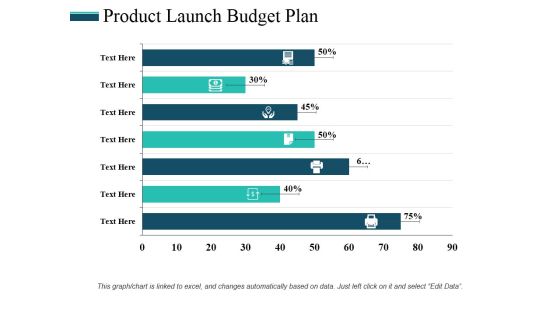
Product Launch Budget Plan Ppt PowerPoint Presentation Professional Rules
This is a product launch budget plan ppt powerpoint presentation professional rules. This is a seven stage process. The stages in this process are bar graph, finance, business, marketing, planning.
Product Launch Budget Plan Ppt PowerPoint Presentation Icon Slide
This is a product launch budget plan ppt powerpoint presentation icon slide. This is a seven stage process. The stages in this process are bar graph, icons, percentage, finance, business.
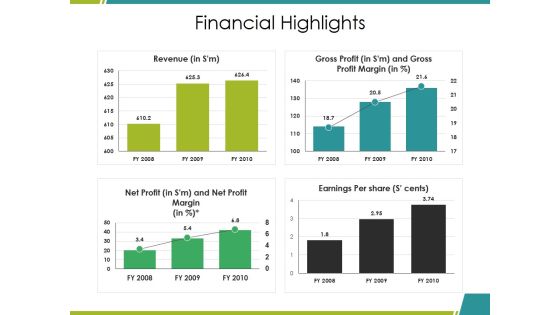
Financial Highlights Ppt PowerPoint Presentation Ideas Graphics Download
This is a financial highlights ppt powerpoint presentation ideas graphics download. This is a four stage process. The stages in this process are revenue, gross profit, net profit, earnings per share, bar graph.

Quarter Track Record Ppt PowerPoint Presentation File Clipart Images
This is a quarter track record ppt powerpoint presentation file clipart images. This is a two stage process. The stages in this process are bar graph, growth, success, business, marketing.

Column Chart Ppt PowerPoint Presentation Model Background Images
This is a column chart ppt powerpoint presentation model background images. This is a six stage process. The stages in this process are bar graph, marketing, finance, strategy, planning.
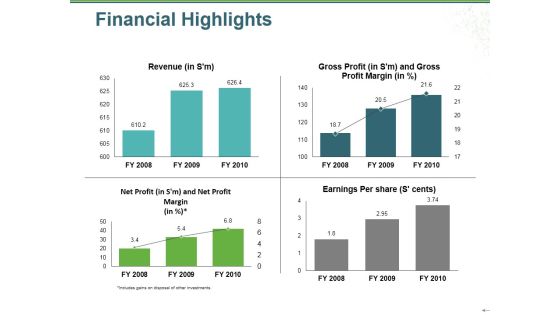
Financial Highlights Ppt PowerPoint Presentation Gallery Graphics Example
This is a financial highlights ppt powerpoint presentation gallery graphics example. This is a four stage process. The stages in this process are revenue, gross profit, net profit, earnings per share, bar graph.
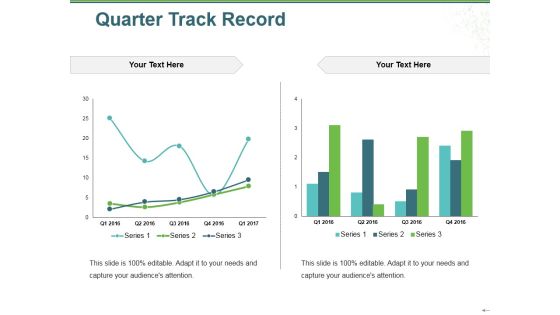
Quarter Track Record Ppt PowerPoint Presentation Gallery Images
This is a quarter track record ppt powerpoint presentation gallery images. This is a two stage process. The stages in this process are series, bar graph, growth, success, business.

Column Chart Ppt PowerPoint Presentation Layouts Tips
This is a column chart ppt powerpoint presentation layouts tips. This is a six stage process. The stages in this process are sales in percentage, financial year, bar graph, growth, success.

Column Chart Ppt PowerPoint Presentation Slides Visual Aids
This is a column chart ppt powerpoint presentation slides visual aids. This is a six stage process. The stages in this process are bar graph, growth, success, sales in percentage, financial year.

Combo Chart Ppt PowerPoint Presentation Inspiration Slide Portrait
This is a combo chart ppt powerpoint presentation inspiration slide portrait. This is a three stage process. The stages in this process are product, market size, bar chart, growth, success.
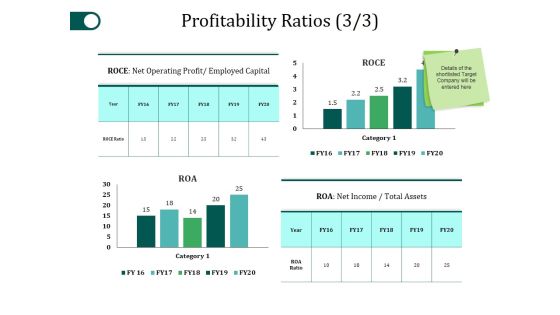
Profitability Ratios Template 3 Ppt PowerPoint Presentation Gallery Slide Portrait
This is a profitability ratios template 3 ppt powerpoint presentation gallery slide portrait. This is a four stage process. The stages in this process are category, roce, net income, business, bar graph.

Column Chart Ppt PowerPoint Presentation Portfolio Slide Download
This is a column chart ppt powerpoint presentation portfolio slide download. This is a two stage process. The stages in this process are product, year, bar graph, success, business.

Combo Chart Ppt PowerPoint Presentation Show Influencers
This is a combo chart ppt powerpoint presentation show influencers. This is a three stage process. The stages in this process are product, bar graph, growth, growth rate, market size.
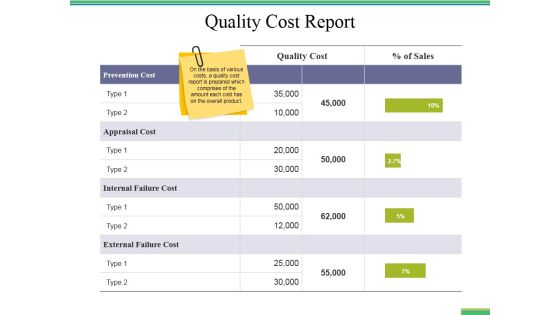
Quality Cost Report Ppt PowerPoint Presentation Styles Infographic Template
This is a quality cost report ppt powerpoint presentation styles infographic template. This is a five stage process. The stages in this process are business, finance, marketing, strategy, bar graph, analysis.

Competitors Average Price Product Ppt PowerPoint Presentation Inspiration Templates
This is a competitors average price product ppt powerpoint presentation inspiration templates. This is a five stage process. The stages in this process are business, finance, analysis, growth, investment, bar graph.

Column Chart Ppt PowerPoint Presentation Infographics Design Inspiration
This is a column chart ppt powerpoint presentation infographics design inspiration. This is a two stage process. The stages in this process are slide bar, marketing, strategy, finance, planning.

Competitor Revenue And Profit Ppt PowerPoint Presentation Outline Elements
This is a competitor revenue and profit ppt powerpoint presentation outline elements. This is a five stage process. The stages in this process are bar graph, marketing, strategy, finance, planning.

Competitors Average Price Product Ppt PowerPoint Presentation File Show
This is a competitors average price product ppt powerpoint presentation file show. This is a two stage process. The stages in this process are bar graph, marketing, strategy, finance, planning.

Social Media Analysis Ppt PowerPoint Presentation Model Portfolio
This is a social media analysis ppt powerpoint presentation model portfolio. This is a four stage process. The stages in this process are bar graph, marketing, strategy, finance, planning.

Competitor Revenue And Profit Ppt PowerPoint Presentation Layouts Vector
This is a competitor revenue and profit ppt powerpoint presentation layouts vector. This is a five stage process. The stages in this process are competitor, profit, revenue, bar graph, success.

Competitors Average Price Product Ppt PowerPoint Presentation Layouts Infographic Template
This is a competitors average price product ppt powerpoint presentation layouts infographic template. This is a five stage process. The stages in this process are company, bar graph, success, growth, business.

Stacked Column Ppt PowerPoint Presentation Layouts Example
This is a stacked column ppt powerpoint presentation layouts example. This is a two stage process. The stages in this process are product, stacked column, bar graph, growth, success.

Column Chart Ppt PowerPoint Presentation Layouts Graphics Example
This is a column chart ppt powerpoint presentation layouts graphics example. This is a two stage process. The stages in this process are product, year, bar graph, business, finance.

Competitor Revenue And Profit Ppt PowerPoint Presentation Model Templates
This is a competitor revenue and profit ppt powerpoint presentation model templates. This is a five stage process. The stages in this process are revenue, profit, competitor, bar graph, business.

Competitors Average Price Product Ppt PowerPoint Presentation File Pictures
This is a competitors average price product ppt powerpoint presentation file pictures. This is a five stage process. The stages in this process are bar graph, business, marketing, finance, company.
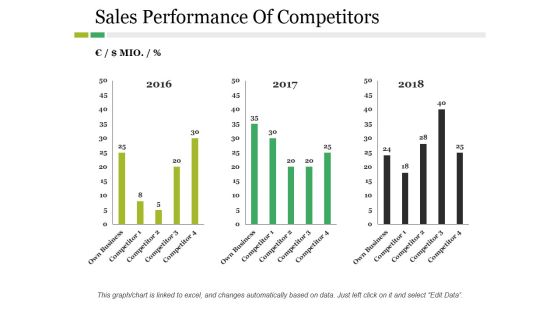
Sales Performance Of Competitors Ppt PowerPoint Presentation Inspiration Example
This is a sales performance of competitors ppt powerpoint presentation inspiration example. This is a three stage process. The stages in this process are business, marketing, year, bar graph, finance.

Competitor Revenue And Profit Template 1 Ppt PowerPoint Presentation Layouts Display
This is a competitor revenue and profit template 1 ppt powerpoint presentation layouts display. This is a five stage process. The stages in this process are business, bar graph, finance, marketing, analysis.

Competitors Average Price Product Ppt PowerPoint Presentation Ideas Layouts
This is a competitors average price product ppt powerpoint presentation ideas layouts. This is a five stage process. The stages in this process are business, bar graph, finance, marketing, analysis.

Competitors Average Price Product Ppt PowerPoint Presentation Styles Ideas
This is a competitors average price product ppt powerpoint presentation styles ideas. This is a five stage process. The stages in this process are business, bar graph, finance, marketing, strategy, analysis.

Combo Chart Ppt PowerPoint Presentation Pictures Graphic Images
This is a combo chart ppt powerpoint presentation pictures graphic images. This is a three stage process. The stages in this process are bar graph, growth, market size, growth rate, success.

Clustered Column Ppt PowerPoint Presentation Visual Aids Show
This is a clustered column ppt powerpoint presentation visual aids show. This is a two stage process. The stages in this process are product, profit, business, bar graph, finance.

Clustered Column Line Ppt PowerPoint Presentation Pictures Example
This is a clustered column line ppt powerpoint presentation pictures example. This is a three stage process. The stages in this process are product, in percentage, bar graph, growth, success.

Clustered Column Ppt PowerPoint Presentation Gallery Structure
This is a clustered column ppt powerpoint presentation gallery structure. This is a two stage process. The stages in this process are product, sales in percentage, financial year, bar graph, finance.
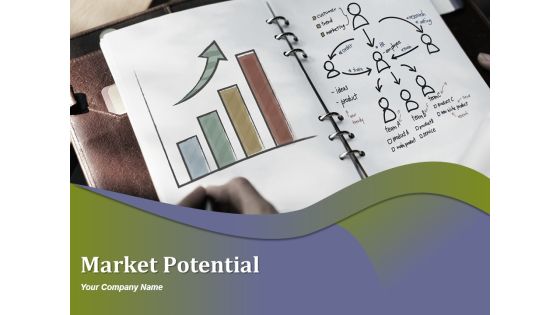
Market Potential Ppt PowerPoint Presentation Complete Deck With Slides
This is a market potential ppt powerpoint presentation complete deck with slides. This is a one stage process. The stages in this process are market, potential, business, management, bar graph.

Clustered Column Line Ppt PowerPoint Presentation Infographic Template Pictures
This is a clustered column line ppt powerpoint presentation infographic template pictures. This is a three stage process. The stages in this process are product, in percentage, bar graph, growth, success.
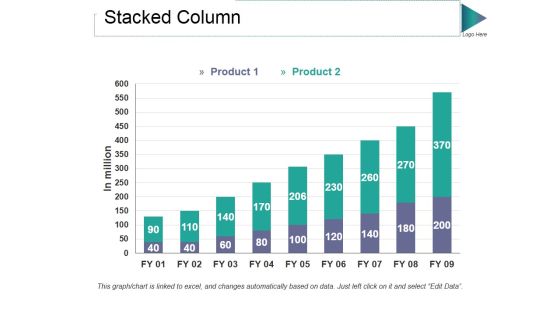
Stacked Column Ppt PowerPoint Presentation Styles Graphic Tips
This is a stacked column ppt powerpoint presentation styles graphic tips. This is a two stage process. The stages in this process are product, in million, bar graph, growth, success.

Column Chart Ppt PowerPoint Presentation Gallery Slide Portrait
This is a column chart ppt powerpoint presentation gallery slide portrait. This is a two stage process. The stages in this process are sales in percentage, financial year, product, bar graph, growth.

Combo Chart Ppt PowerPoint Presentation Show Deck
This is a combo chart ppt powerpoint presentation show deck. This is a three stage process. The stages in this process are growth rate, market size, product, bar graph, growth.

Column Chart Ppt PowerPoint Presentation File Summary
This is a column chart ppt powerpoint presentation file summary. This is a two stage process. The stages in this process are product, dollars, in years, bar graph, growth.

Competitors Average Price Product Ppt PowerPoint Presentation Icon Layout
This is a competitors average price product ppt powerpoint presentation icon layout. This is a five stage process. The stages in this process are company, bar graph, finance, business, marketing.

Sales Performance Of Competitors Ppt PowerPoint Presentation Layouts Elements
This is a sales performance of competitors ppt powerpoint presentation layouts elements. This is a three stage process. The stages in this process are years, bar graph, finance, business, marketing.

High Low Close Chart Ppt PowerPoint Presentation Portfolio Topics
This is a high low close chart ppt powerpoint presentation portfolio topics. This is a three stage process. The stages in this process are product, market size, in years, success, bar graph.

Column Chart Ppt PowerPoint Presentation Pictures Graphic Images
This is a column chart ppt powerpoint presentation pictures graphic images. This is a two stage process. The stages in this process are product, years, growth, success, bar graph.

Clustered Column Line Ppt PowerPoint Presentation Pictures Model
This is a clustered column line ppt powerpoint presentation pictures model. This is a three stage process. The stages in this process are bar graph, finance, marketing, strategy, business.

Profitability Ratios Template 1 Ppt PowerPoint Presentation Portfolio Display
This is a profitability ratios template 1 ppt powerpoint presentation portfolio display. This is a two stage process. The stages in this process are business, marketing, bar, finance, planning.

Profitability Ratios Template 2 Ppt PowerPoint Presentation Summary Graphics
This is a profitability ratios template 2 ppt powerpoint presentation summary graphics. This is a two stage process. The stages in this process are business, marketing, bar, finance, planning.
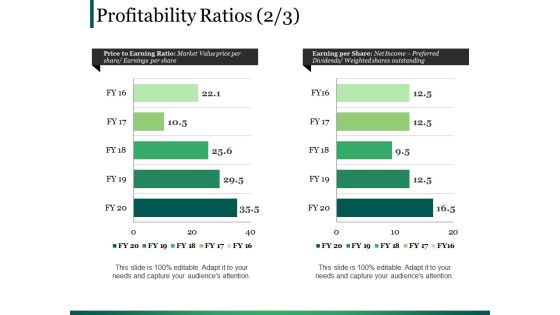
Profitability Ratios Template 3 Ppt PowerPoint Presentation Slides Good
This is a profitability ratios template 3 ppt powerpoint presentation slides good. This is a two stage process. The stages in this process are business, marketing, bar, finance, planning.

Profitability Ratios Template 4 Ppt PowerPoint Presentation Infographic Template Clipart Images
This is a profitability ratios template 4 ppt powerpoint presentation infographic template clipart images. This is a two stage process. The stages in this process are business, marketing, bar, finance, planning.

Clustered Column Ppt PowerPoint Presentation Pictures Graphics Template
This is a clustered column ppt powerpoint presentation pictures graphics template. This is a two stage process. The stages in this process are product, growth, success, business, bar graph.

Clustered Column Line Ppt PowerPoint Presentation Topics
This is a clustered column line ppt powerpoint presentation topics. This is a three stage process. The stages in this process are product, in percentage, growth, bar graph, business.

Column Chart Ppt PowerPoint Presentation Infographics Guidelines
This is a column chart ppt powerpoint presentation infographics guidelines. This is a two stage process. The stages in this process are product, expenditure in, years, business, bar graph.
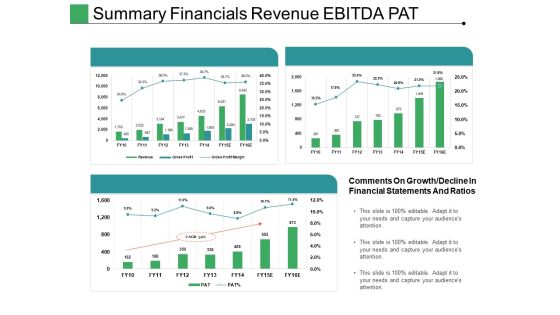
Summary Financials Revenue Ebitda Pat Ppt PowerPoint Presentation Ideas Tips
This is a summary financials revenue ebitda pat ppt powerpoint presentation ideas tips. This is a three stage process. The stages in this process are comments on growth, bar graph, growth, success, business.

Column Chart Ppt PowerPoint Presentation Layouts Vector
This is a column chart ppt powerpoint presentation layouts vector. This is a two stage process. The stages in this process are product, column chart, bar graph, percentage, finance.

Combo Chart Ppt PowerPoint Presentation Pictures Summary
This is a combo chart ppt powerpoint presentation pictures summary. This is a three stage process. The stages in this process are product, market size, growth rate, bar graph, success.
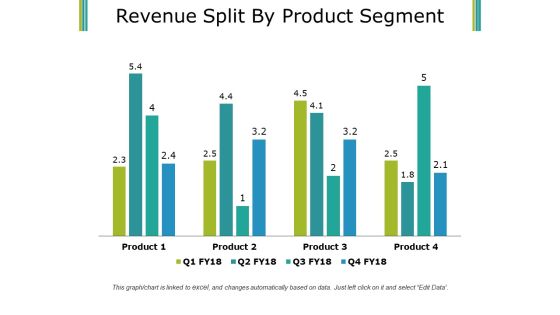
Revenue Split By Product Segment Template 1 Ppt PowerPoint Presentation Infographics Smartart
This is a revenue split by product segment template 1 ppt powerpoint presentation infographics smartart. This is a four stage process. The stages in this process are business, finance, marketing, bar graph, product.

Clustered Column Line Ppt PowerPoint Presentation Inspiration Visual Aids
This is a clustered column line ppt powerpoint presentation inspiration visual aids. This is a four stage process. The stages in this process are business, marketing, strategy, planning, bar chart.

Stacked Area Clustered Column Ppt PowerPoint Presentation Gallery Gridlines
This is a stacked area clustered column ppt powerpoint presentation gallery gridlines. This is a three stage process. The stages in this process are bar graph, product, in percentage.

Volume High Low Close Chart Ppt PowerPoint Presentation Visual Aids Slides
This is a volume high low close chart ppt powerpoint presentation visual aids slides. This is a two stage process. The stages in this process are bar graph, marketing, strategy, finance, planning.
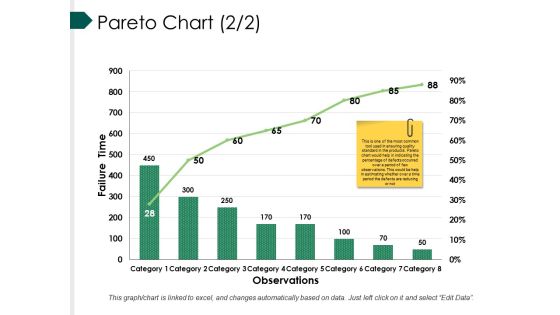
Pareto Chart Template Ppt PowerPoint Presentation Summary Graphic Images
This is a pareto chart template ppt powerpoint presentation summary graphic images. This is a eight stage process. The stages in this process are bar, marketing, strategy, finance, teamwork.

Actual Vs Target Sales Ppt PowerPoint Presentation Slides Template
This is a actual vs target sales ppt powerpoint presentation slides template. This is a seven stage process. The stages in this process are bar chart, marketing, strategy, finance, planning.

Combo Chart Ppt PowerPoint Presentation Layouts Background Image
This is a combo chart ppt powerpoint presentation layouts background image. This is a three stage process. The stages in this process are bar chart, marketing, strategy, finance, planning.

Clustered Column Ppt PowerPoint Presentation Icon Objects
This is a clustered column ppt powerpoint presentation icon objects. This is a two stage process. The stages in this process are clustered column, product, growth, finance, bar graph.

Stacked Area Clustered Column Ppt PowerPoint Presentation Summary Slides
This is a stacked area clustered column ppt powerpoint presentation summary slides. This is a three stage process. The stages in this process are product, in percentage, financial year, bar graph.
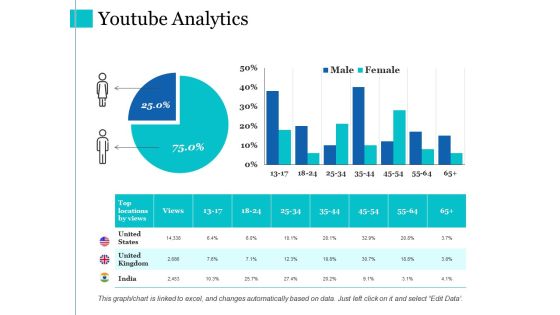
Youtube Analytics Ppt PowerPoint Presentation Layouts Graphic Images
This is a youtube analytics ppt powerpoint presentation layouts graphic images. This is a three stage process. The stages in this process are youtube analytics, finance, percentage, bar graph.
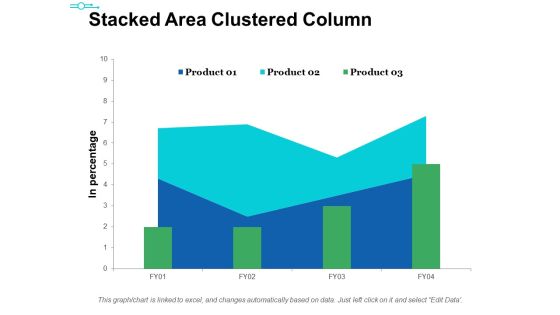
Stacked Area Clustered Column Ppt PowerPoint Presentation Ideas Themes
This is a stacked area clustered column ppt powerpoint presentation ideas themes. This is a three stage process. The stages in this process are product, in percentage, bar graph, area chart, growth.

Clustered Column Line Ppt PowerPoint Presentation Professional
This is a clustered column line ppt powerpoint presentation professional. This is a three stage process. The stages in this process are clustered column line, product, bar graph, marketing, finance.
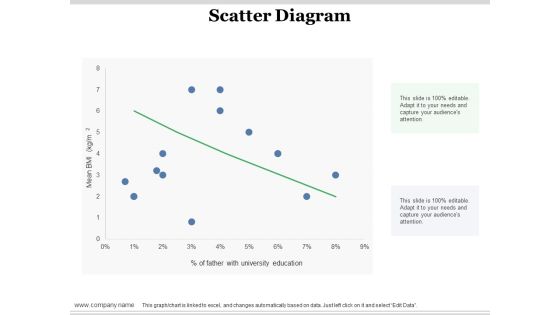
Scatter Diagram Ppt PowerPoint Presentation Infographic Template Design Ideas
This is a scatter diagram ppt powerpoint presentation infographic template design ideas. This is a one stage process. The stages in this process are scatter diagram, finance, in percentage, business, bar graph.

Column Chart Ppt PowerPoint Presentation Icon Show
This is a column chart ppt powerpoint presentation icon show. This is a two stage process. The stages in this process are column chart, product, years, bar graph, growth.
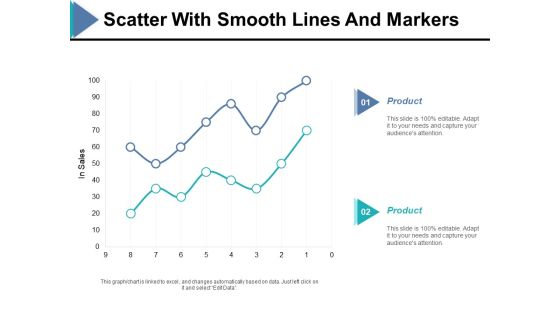
Scatter With Smooth Lines And Markers Ppt PowerPoint Presentation Ideas Example
This is a scatter with smooth lines and markers ppt powerpoint presentation ideas example. This is a two stage process. The stages in this process are in sales, finance, bar graph, product, business.

Key Market Drivers And Forecast Ppt PowerPoint Presentation Summary Templates
This is a key market drivers and forecast ppt powerpoint presentation summary templates. This is a two stage process. The stages in this process are key market drivers, forecast, growth, bar graph, business.

Market Drivers Hardware And Software Ppt PowerPoint Presentation Inspiration Graphics Design
This is a market drivers hardware and software ppt powerpoint presentation inspiration graphics design. This is a two stage process. The stages in this process are key market drivers, forecast, growth, bar graph, business.
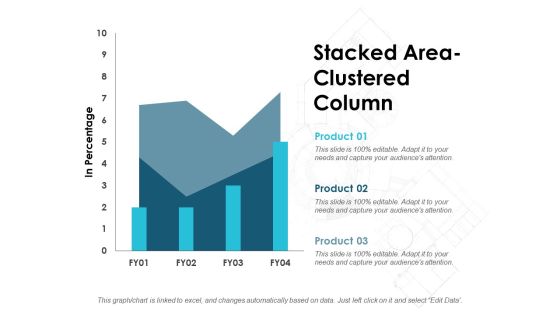
Stacked Area Clustered Column Ppt PowerPoint Presentation Summary Portfolio
This is a stacked area clustered column ppt powerpoint presentation summary portfolio. This is a three stage process. The stages in this process are stacked bar, finance, marketing, management, analysis.
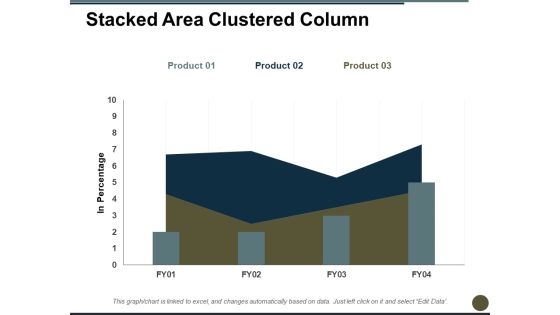
Stacked Area Clustered Column Ppt PowerPoint Presentation Professional Graphics
This is a stacked area clustered column ppt powerpoint presentation professional graphics. This is a three stage process. The stages in this process are in percentage, bar chart, product, growth, year.

Area Chart Finance Ppt Powerpoint Presentation Infographic Template Clipart Images
This is a area chart finance ppt powerpoint presentation infographic template clipart images. This is a two stage process. The stages in this process are area bar, finance, marketing, management, analysis.

Barriers To Digital Transformation Ppt PowerPoint Presentation Professional Influencers
This is a barriers to digital transformation ppt powerpoint presentation professional influencers. This is a six stage process. The stages in this process are bar chart, finance, marketing, business, analysis.

Combo Chart Finance Ppt PowerPoint Presentation Outline Example
This is a combo chart finance ppt powerpoint presentation outline example. This is a three stage process. The stages in this process are bar chart, finance, marketing, business, analysis.
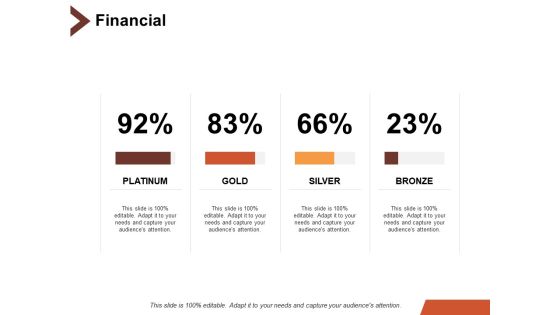
Financial Business Marketing Ppt PowerPoint Presentation Slides Aids
This is a financial business marketing ppt powerpoint presentation slides aids. This is a four stage process. The stages in this process are bar chart, finance, marketing, business, analysis.

Analysis Techniques Pareto Analysis Ppt PowerPoint Presentation Professional Icons
This is a analysis techniques pareto analysis ppt powerpoint presentation professional icons. This is a two stage process. The stages in this process are bar chart, finance, marketing, business, analysis.

Clustered Column Finance Ppt PowerPoint Presentation Pictures Inspiration
This is a clustered column finance ppt powerpoint presentation pictures inspiration. This is a two stage process. The stages in this process are bar chart, finance, marketing, business, analysis.

Data Collection Histograms Ppt PowerPoint Presentation Icon Slides
This is a data collection histograms ppt powerpoint presentation icon slides. This is a two stage process. The stages in this process are bar chart, finance, marketing, business, analysis.

Stacked Column Chart Ppt PowerPoint Presentation Professional Aids
This is a stacked column chart ppt powerpoint presentation professional aids. This is a three stage process. The stages in this process are bar chart, finance, marketing, business, analysis.
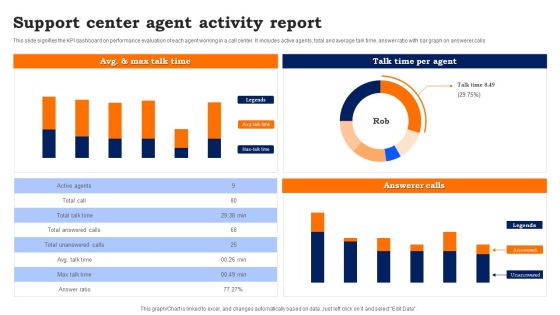
Support Center Agent Activity Report Guidelines PDF
This slide signifies the KPI dashboard on performance evaluation of each agent working in a call center. It includes active agents, total and average talk time, answer ratio with bar graph on answerer calls.
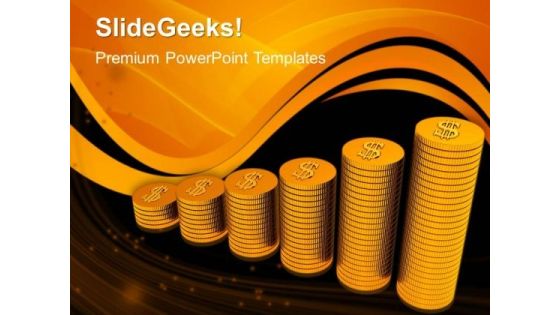
Coins Investment PowerPoint Templates And PowerPoint Themes 1012
Coins Investment PowerPoint Templates And PowerPoint Themes 1012-Use this PowerPoint Template to signify the concept of Bar graph. It consists of the coins forming the Bar graph. This image has been conceived to enable you to emphatically communicate your ideas in your Business PPT presentation. Original thinking is the need of the hour. We provide the means to project your views.-Coins Investment PowerPoint Templates And PowerPoint Themes 1012-This PowerPoint template can be used for presentations relating to-Gold coins, business, money, finance, success, signs

Ppt Application Of 4 Steps Working With Slide Numbers Involved Procedur PowerPoint Templates
PPT application of 4 steps working with slide numbers involved procedur PowerPoint Templates-This chart visualize the process steps, reoccurrences and components or of your company structure or product features. These premium graphics are especially suitable for chronologies, sequences. This Diagram will fit for Business processes like Marketing, Management etc. You can show various processes with these linear designed Circular pieces. -PPT application of 4 steps working with slide numbers involved procedur PowerPoint Templates-Add, Aqua, Arrows, Badges, Bar, Blend, Blue, Bright, Bubbles, Buttons, Caution, Circle, Drop, Elements, Glossy, Glowing, Graphic, Heart, Help, Icons, Idea, Illustration, Navigation, Oblong, Plus, Round, Service, Shadow, Shiny, Sign, Speech, Squares

Impact Of Shifting From Traditional To Technology Based Blockchain And Distributed Ledger Technology Model Rules PDF
Mentioned slide showcases working of blockchain technology in the banking sector, which can be used to store large amount of data in the form of blocks. The process begins with requesting a transaction, storing in P2P, validation and verification of data, creating new blocks, adding blocks to existing chain etc. Pitch your topic with ease and precision using this Impact Of Shifting From Traditional To Technology Based Blockchain And Distributed Ledger Technology Model Rules PDF. This layout presents information on Traditional Model, Blockchain Based Model, Propensity For Fraud. It is also available for immediate download and adjustment. So, changes can be made in the color, design, graphics or any other component to create a unique layout.

Architecture And Working Of Blockchain Technology Sample PDF
This slide outlines the structure and working of blockchain technology. The purpose of this slide is to showcase the connection of blocks in a blockchain network, the collection of transactions and working. The components of a block include the header, the hash value of the previous block header, and the root of the hash tree. Make sure to capture your audiences attention in your business displays with our gratis customizable Architecture And Working Of Blockchain Technology Sample PDF. These are great for business strategies, office conferences, capital raising or task suggestions. If you desire to acquire more customers for your tech business and ensure they stay satisfied, create your own sales presentation with these plain slides.

Business Diagrams Templates 3d Man And Puzzle With Success PowerPoint
We present our business diagrams templates 3d man and puzzle with success PowerPoint.Use our Advertising PowerPoint Templates because You canTake a leap off the starting blocks with our PowerPoint Templates and Slides. They will put you ahead of the competition in quick time. Present our Business PowerPoint Templates because It will Raise the bar of your Thoughts. They are programmed to take you to the next level. Present our Puzzles or Jigsaws PowerPoint Templates because You canTake a leap off the starting blocks with our PowerPoint Templates and Slides. They will put you ahead of the competition in quick time. Download and present our Success PowerPoint Templates because Our PowerPoint Templates and Slides will let your words and thoughts hit bullseye everytime. Download and present our Shapes PowerPoint Templates because They will Put your wonderful verbal artistry on display. Our PowerPoint Templates and Slides will provide you the necessary glam and glitter.Use these PowerPoint slides for presentations relating to 3d, Achievement, Activity, Adversity, Bridge, Built, Business, Cartoon, Challenge, Character, Computer, Concept, Confusion, Connection, Conquering, Construction, Creativity, Decisions, Figure, Games, Goal, Graphic, Icon, Idea, Imagination, Intelligence, Interlocking, Jigsaw, Leisure, Men, Organization, People, Person, Piece, Planning, Problems, Puppet, Puzzle, Red, Skill, Solution, Stick, Strategy, Structure, Struggle, Success. The prominent colors used in the PowerPoint template are Green, White, Gray. We assure you our business diagrams templates 3d man and puzzle with success PowerPoint will help them to explain complicated concepts. Use our Challenge PowerPoint templates and PPT Slides help you meet deadlines which are an element of today's workplace. Just browse and pick the slides that appeal to your intuitive senses. We assure you our business diagrams templates 3d man and puzzle with success PowerPoint are aesthetically designed to attract attention. We guarantee that they will grab all the eyeballs you need. Professionals tell us our Activity PowerPoint templates and PPT Slides have awesome images to get your point across. The feedback we get is that our business diagrams templates 3d man and puzzle with success PowerPoint are designed to make your presentations professional. You can be sure our Activity PowerPoint templates and PPT Slides will make the presenter look like a pro even if they are not computer savvy.

PowerPoint Templates Process Model Diagram Circular Flow
We present our powerpoint templates process model diagram Circular Flow.Present our Pyramids PowerPoint Templates because this template helps you to put your finger on the pulse of your business and sense the need to re-align a bit. Use our Business PowerPoint Templates because it illustrates the city with a lasting tryst with resilience. You epitomise the qualities that give your city its fame. Present our Shapes PowerPoint Templates because this diagram helps you to develop your marketing strategy and communicate your enthusiasm and motivation to raise the bar. Use our Leadership PowerPoint Templates because this diagram helps you to discuss each step slowly but surely move up the pyramid narrowing down to the best and most success oriented project. Use our Symbol PowerPoint Templates because using our templates for your colleagues will impart knowledge to feed.Use these PowerPoint slides for presentations relating to 3d, Abstract, Answer, Blocks, Blue, Box, Business, Challenge, Collect, Color, Concept, Connect, Construction, Contrast, Creative, Difference, Different, Digital, Education, En, Equipment, Example, Geometry, Group, Icon, Isolated, Object, Organization, Organized, Part, Perspective, Pieces, Plastic, Puzzle, Pyramid, Red, Shape, Sign, Skill, Solution, Stages, Success, Three, Togetherness, Toy, Triangle, Unity. The prominent colors used in the PowerPoint template are Red, Green, Blue. We assure you our powerpoint templates process model diagram Circular Flow are Handsome. Customers tell us our Collect PowerPoint templates and PPT Slides are Fashionable. The feedback we get is that our powerpoint templates process model diagram Circular Flow are Upbeat. We assure you our Challenge PowerPoint templates and PPT Slides are Dynamic. People tell us our powerpoint templates process model diagram Circular Flow are designed to make your presentations professional. We assure you our Challenge PowerPoint templates and PPT Slides are Ultra.

Build Word With Lego PowerPoint Templates And PowerPoint Themes 1012
Build Word With Lego PowerPoint Templates And PowerPoint Themes 1012-Emphatically define your message with our above template which contains a graphic of word Build made up of Lego blocks. This image represents the concept of construction. This image has been conceived to enable you to emphatically communicate your ideas in your Business solutions and implementing ideas PPT presentations. The structure of our templates allows you to effectively highlight the key issues concerning the growth of your business.-Build Word With Lego PowerPoint Templates And PowerPoint Themes 1012-This PowerPoint template can be used for presentations relating to-Lego blocks, business, shapes, success, education, children

Blockchain Technology Framework IT Roadmap Of Blockchain Technology Download PDF
This slide represents the core components of the blockchain architecture, such as node, transaction, block, chain, miners, and consensus. Presenting blockchain technology framework it core components of blockchain architecture demonstration pdf to provide visual cues and insights. Share and navigate important information on six stages that need your due attention. This template can be used to pitch topics like chain, transaction, miners, block, consensus. In addtion, this PPT design contains high resolution images, graphics, etc, that are easily editable and available for immediate download.

Digital Transformation Trends On Supply Chain Management Mockup PDF
This slide signifies the trends of digital transformation in supply chain management. It includes artificial intelligence, block chain, big data analytics, Governance and security. Presenting digital transformation trends on supply chain management mockup pdf to provide visual cues and insights. Share and navigate important information on four stages that need your due attention. This template can be used to pitch topics like block chain, governance and security, big data analytics. In addtion, this PPT design contains high resolution images, graphics, etc, that are easily editable and available for immediate download.

Reverse Proxy Server IT Why To Use Reverse Proxy Server Ppt Gallery Good PDF
This slide depicts why to use reverse proxy servers, including control over cyber loafing, bandwidth saving, privacy benefits, security, and access to blocked resources. Presenting reverse proxy server it why to use reverse proxy server ppt gallery good pdf to provide visual cues and insights. Share and navigate important information on five stages that need your due attention. This template can be used to pitch topics like employees, privacy benefits, advanced security, access to blocked, resources and websites. In addtion, this PPT design contains high resolution images, graphics, etc, that are easily editable and available for immediate download.

Cryptocurrency Ledger How Does Blockchain Technology Works Summary PDF
This slide shows the working of blockchain technology and the limit of the information that can be stored in blocks, the length of hash codes, along the purpose of miners and nodes. This is a Cryptocurrency Ledger How Does Blockchain Technology Works Summary PDF template with various stages. Focus and dispense information on three stages using this creative set, that comes with editable features. It contains large content boxes to add your information on topics like Miners, Nodes, Blocks. You can also showcase facts, figures, and other relevant content using this PPT layout. Grab it now.

Integrated IOT Blockchain Platform Security Through Technology Background PDF
This slide covers steps for processing crypto currency transactions using block chain P2P technology. The purpose of this slide is to provide information on securing financial transactions. It includes steps from requesting transaction, transferring it on P2P network, validating transactions, creation of new data block, etc. Persuade your audience using this Integrated IOT Blockchain Platform Security Through Technology Background PDF. This PPT design covers six stages, thus making it a great tool to use. It also caters to a variety of topics including Transaction Requested Party, Requested Transaction, Crypto Currency. Download this PPT design now to present a convincing pitch that not only emphasizes the topic but also showcases your presentation skills.

Developmental Digital Banking Transformational Drivers Slides PDF
This slide covers trends of digital banking sector. The purpose of these trends is secure data and support banks security norms. These drivers are block chain, upgraded ATM, artificial intelligence and cloud computing. Presenting Developmental Digital Banking Transformational Drivers Slides PDF to dispense important information. This template comprises four stages. It also presents valuable insights into the topics including Artificial Intelligence, Block Chain, Cloud Computing. This is a completely customizable PowerPoint theme that can be put to use immediately. So, download it and address the topic impactfully.

Mitigation Plan For Challenges In Agile Change Management Strategy Information PDF
The following slide exhibits mitigation plan for building healthy organizational culture with much more independent employees. It presents information related to team resistance, cultural block, etc. Pitch your topic with ease and precision using this Mitigation Plan For Challenges In Agile Change Management Strategy Information PDF. This layout presents information on Team Resistance, Cultural Block, Challenges. It is also available for immediate download and adjustment. So, changes can be made in the color, design, graphics or any other component to create a unique layout.
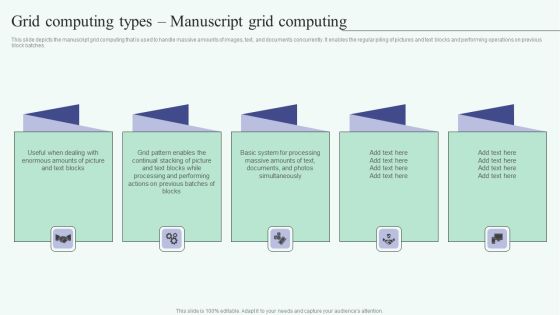
Grid Computing For High Performance Solutions Grid Computing Types Manuscript Grid Computing Themes PDF
This slide depicts the manuscript grid computing that is used to handle massive amounts of images, text, and documents concurrently. It enables the regular piling of pictures and text blocks and performing operations on previous block batches. Make sure to capture your audiences attention in your business displays with our gratis customizable Grid Computing For High Performance Solutions Grid Computing Types Manuscript Grid Computing Themes PDF. These are great for business strategies, office conferences, capital raising or task suggestions. If you desire to acquire more customers for your tech business and ensure they stay satisfied, create your own sales presentation with these plain slides.
 Home
Home