Sections
Incident And Issue Management Procedure Gantt Chart With Project Progress Bar Ppt Icon Influencers PDF
This slide provides the glimpse about the project progress bar graph in gantt chart form which covers the general release, open and closed beta and development. Deliver and pitch your topic in the best possible manner with this Incident And Issue Management Procedure Gantt Chart With Project Progress Bar Ppt Icon Influencers pdf. Use them to share invaluable insights on gantt chart with project progress bar and impress your audience. This template can be altered and modified as per your expectations. So, grab it now.
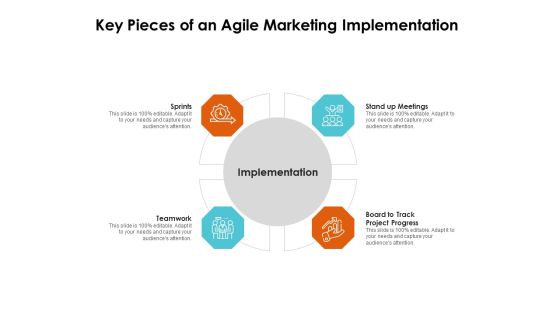
Scrum Practices For Marketing Teams Key Pieces Of An Agile Marketing Implementation Ppt PowerPoint Presentation Infographic Template Brochure PDF
Presenting this set of slides with name scrum practices for marketing teams key pieces of an agile marketing implementation ppt powerpoint presentation infographic template brochure pdf. This is a four stage process. The stages in this process are stand up meetings, board to track project progress, teamwork, sprints, implementation. This is a completely editable PowerPoint presentation and is available for immediate download. Download now and impress your audience.

Bar Graph On Target01 Finance PowerPoint Templates And PowerPoint Themes 0512
Microsoft Powerpoint Templates and Background with achieving business targets-Bar Graph On Target01 Finance PowerPoint Templates And PowerPoint Themes 0512-These PowerPoint designs and slide layouts can be used for themes relating to -Achieving Business Targets, marketing, success, sales, finance, business

Bar Graph With Dollar Finance PowerPoint Templates And PowerPoint Themes 0512
Microsoft Powerpoint Templates and Background with business graph success-Bar Graph With Dollar Finance PowerPoint Templates And PowerPoint Themes 0512-These PowerPoint designs and slide layouts can be used for themes relating to -Business graph, success, global, marketing, finance, sales

Bar Graph With Person01 Success PowerPoint Templates And PowerPoint Themes 0512
Microsoft Powerpoint Templates and Background with success-Bar Graph With Person01 Success PowerPoint Templates And PowerPoint Themes 0512-These PowerPoint designs and slide layouts can be used for themes relating to -Success, business, shapes, marketing, sales, finance, shapes

Successful Person And Bar Graph Business PowerPoint Templates And PowerPoint Themes 0512
Microsoft Powerpoint Templates and Background with success-Successful Person And Bar Graph Business PowerPoint Templates And PowerPoint Themes 0512-These PowerPoint designs and slide layouts can be used for themes relating to -Success, business, shapes, marketing, sales, finance

Bar Graph On Target01 Business PowerPoint Templates And PowerPoint Themes 0512
Microsoft Powerpoint Templates and Background with achieving business targets-These templates can be used for presentations relating to-Achieving Business Targets, marketing, success, sales, finance, business-Bar Graph On Target01 Business PowerPoint Templates And PowerPoint Themes 0512

Colored Bar Graph With Person Business PowerPoint Templates And PowerPoint Themes 0512
Microsoft Powerpoint Templates and Background with success-These templates can be used for presentations relating to-Success, business, shapes, marketing, sales, finance, shapes-Colored Bar Graph With Person Business PowerPoint Templates And PowerPoint Themes 0512
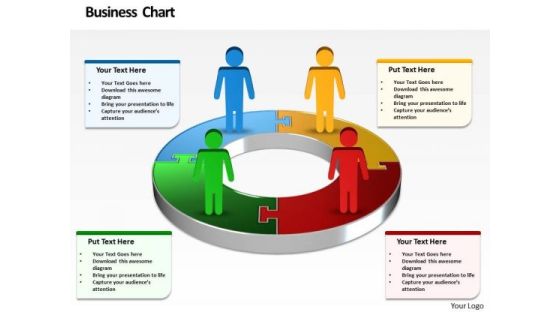
Ppt Business Men Standing On Excel Bar Chart Templates PowerPoint 2010
PPT business men standing on excel bar chart templates powerpoint 2010-The above template contains a graphic of 3d pie chart forming the network of business persons.This image has been conceived to enable you to emphatically communicate your ideas in

Business Strategy Plan Template 3d Man Sitting On Bar Graph Basic Concepts
Delight Them With Our Business Strategy Plan Template 3d Man Sitting On Bar Graph Basic Concepts Powerpoint Templates. Your Audience Will Be Ecstatic. Our Computer Powerpoint Templates Are Created Cost Effective. They Understand The Need For Economy.
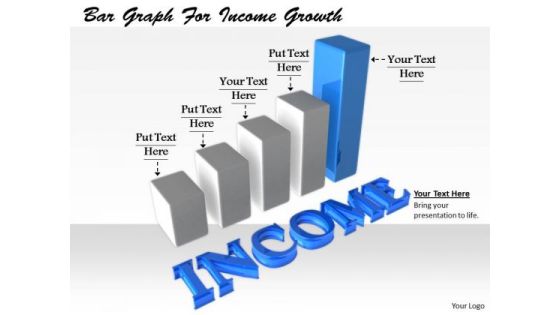
Stock Photo Business Management Strategy Bar Graph For Income Growth Stock Images
Experiment With Your Thoughts As You Desire. Our stock photo business management strategy bar graph for income growth stock images Will Be All For It. Stand On Your Own Feet With Our finance. You Will Discover Personal Power.

Stock Photo Business Concepts Make New And Sales Bar Graph Images Graphics
Document The Process On Our Stock Photo Business Concepts Make New And Sales Bar Graph Images Graphics Powerpoint Templates. Make A Record Of Every Detail. Satiate Desires With Our sales Powerpoint Templates. Give Them All They Want And More.
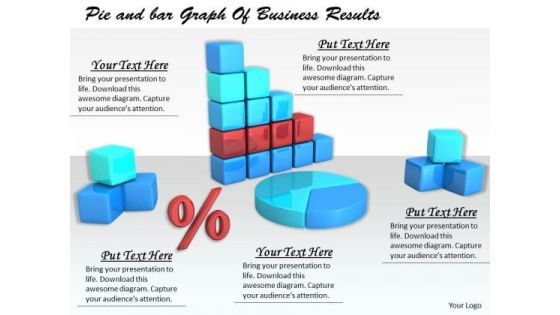
Stock Photo Business Strategy Examples Pie And Bar Graph Of Results Images
Plan For All Contingencies With Our Stock Photo Business Strategy Examples Pie And Bar Graph Of Results Images Powerpoint Templates. Douse The Fire Before It Catches. Generate Camaraderie With Our sales Powerpoint Templates. Good Wishes Will Come Raining Down.
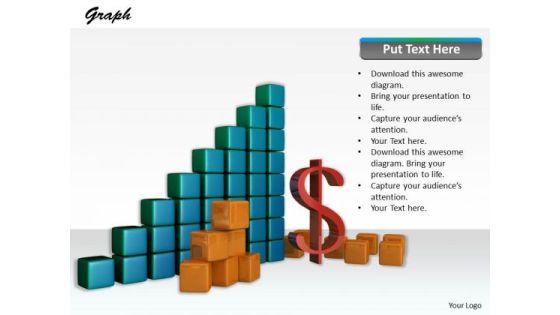
Stock Photo Modern Marketing Concepts See The Financial Bar Graph Business Images
Be The Dramatist With Our Stock Photo Modern Marketing Concepts See The Financial Bar Graph Business Images Powerpoint Templates. Script Out The Play Of Words. Put Our sales Powerpoint Templates Into The Draw. Your Thoughts Will Win The Lottery.

Ppt Slide Bar Graph For Time Dependent Process Chart Consulting Firms
Land The Idea With Our PPT Slide bar graph for time dependent process chart consulting firms Powerpoint Templates. Help It Grow With Your Thoughts. Cover The Compass With Our Business Plan Powerpoint Templates. Your Ideas Will Be Acceptable To All.
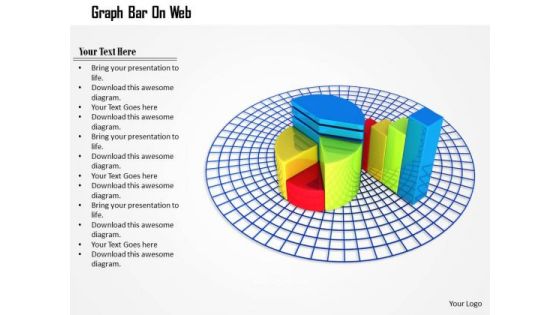
Stock Photo Pie Chart And Bar Graph On Web PowerPoint Slide
This image is designed with pie chart and bar graph on web. Use this diagram to explain your strategy to co-ordinate activities. Deliver amazing presentations to mesmerize your audience.
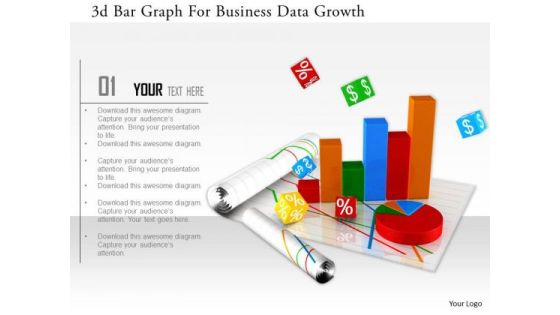
Stock Photo 3d Bar Graph For Business Data Growth Image Graphics For PowerPoint Slide
This image slide has graphics of financial charts and reports. This contains bar graph and pie chart to present business reports. Build an innovative presentations using this professional image slide.

Business Diagram Bar Graph For Result Display On Mobile Presentation Template
This Power Point template has been designed with graphic of bar graph on mobile phone. This business diagram can be used to make business reports. Download this Power Point slide to build quality presentation for your viewers.

Stock Photo Business Growth Bar Graph And Arrow And Tablet PowerPoint Slide
This PowerPoint template has been designed with graphic of bar graph and arrow with tablet. This unique image slide depicts the concept of business growth and success. Use this image slide to build exclusive presentation for your viewers.

Business Diagram Colored Pie Graph Style Bar Graph For Result Representation Presentation Template
Concept of business result analysis has been displayed in this power point template. This PPT contains the colored pie graph with bar graph. Use this PPT for your business and marketing result analysis related presentations.
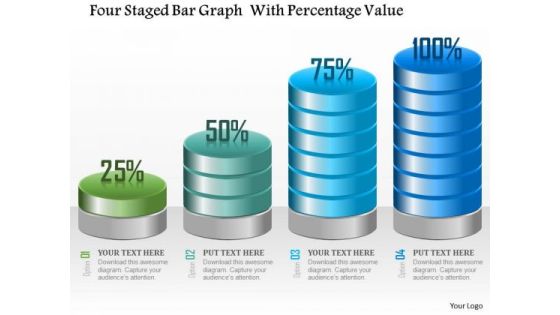
Business Diagram Four Staged Bar Graph With Percentage Value Presentation Template
Four staged bar graph with percentage value has been used to craft this power point template. This PPT contains the concept of making financial timeline and result analysis. This PPT can be used for business and finance related presentations.

Stock Photo Bar Graph With Cubes For Financial Data PowerPoint Slide
Graphic of bar graph and cubes are used to decorate this image template. This PPT contains the concept of financial data analysis. Use this PPT for finance and business related presentations.

Stock Photo Computer And Bar Graph For Result Analysis PowerPoint Slide
This Power point template has been crafted with graphic of computer and bar graph. This PPT contains the concept of technology and result analysis. Use this PPT for your business and technology related presentations.
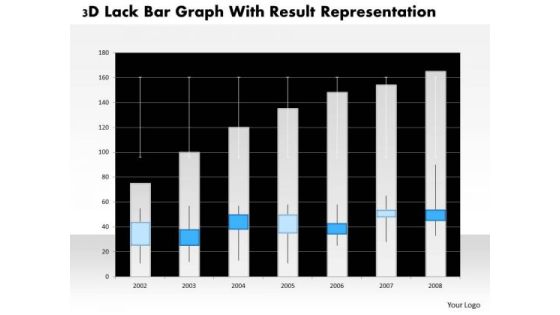
Business Diagram 3d Lack Bar Graph With Result Representation PowerPoint Slide
This business diagram has graphic of 3d lack bar graph. This diagram is a data visualization tool that gives you a simple way to present statistical information. This slide helps your audience examine and interpret the data you present.

Business Diagram Globe Bar Graph And Bulb For International Business Diagram Presentation Template
Graphic of globe and bar graph with bulb has been used to craft this power point template diagram. This PPT diagram contains the concept of international business growth analysis. Use this PPT for global business and sales related presentations.

Business Diagram Globe With Bar Graph For Business Strategy Plan Presentation Template
This power point template diagram has been crafted with graphic of globe and bar graph. This PPT diagram contains the concept of business strategy and business plans for global market. Use this PPT for business and marketing related presentations.

Business Diagram Linear Bar Graph With Apps Made With Pencils Presentation Template
This power point template has been crafted with graphic of linear bar graph and apps made with pencils. This PPT diagram can be used for business growth analysis and result analysis. Use this PPT for business and marketing related presentations.

Business Diagram Bar Graph Style Timeline Diagram For Business Presentation Template
This business slide has been designed with bar graph style timeline diagram. Download this diagram to depict business annual plans and growth on your presentations. Make your presentations outshine using this diagram slide.
Dollar Mobile Bar Graph And Monitor Icons In Circles Powerpoint Templates
Our above slide has been designed with dollar, mobile, bar graph and monitor icons. This infographic slide is best to describe text information. You can provide a fantastic explanation of the topic with this slide.

5 Level Bar Graph For Analysis With Icons Ppt PowerPoint Presentation Shapes
This is a 5 level bar graph for analysis with icons ppt powerpoint presentation shapes. This is a five stage process. The stages in this process are business, strategy, marketing, icons, growth, management.

Bar Chart With Annual Performance Analysis Over Years Ppt PowerPoint Presentation Design Ideas
This is a bar chart with annual performance analysis over years ppt powerpoint presentation design ideas. This is a five stage process. The stages in this process are business, strategy, marketing, analysis, line graph.
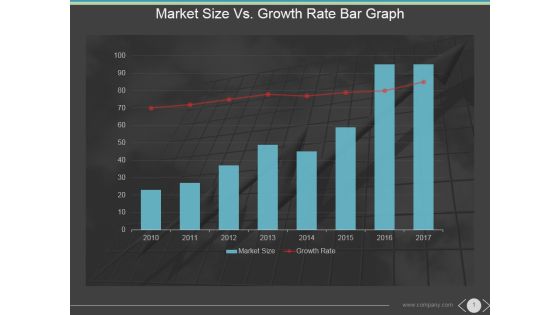
Market Size Vs Growth Rate Bar Graph Ppt PowerPoint Presentation Themes
This is a market size vs growth rate bar graph ppt powerpoint presentation themes. This is a eight stage process. The stages in this process are market size, growth rate, years, future, graph.

Bar Graph To Show Company Sales Budget Ppt PowerPoint Presentation Sample
This is a bar graph to show company sales budget ppt powerpoint presentation sample. This is a four stage process. The stages in this process are business, finance, growth, success, marketing, arrow.

Bar Graph With Arrow For Career Planning Ppt PowerPoint Presentation Gallery
This is a bar graph with arrow for career planning ppt powerpoint presentation gallery. This is a six stage process. The stages in this process are business, finance, marketing, strategy, planning, success, arrow.

Red Board With Arrow Bar For Target Market Ppt PowerPoint Presentation Clipart
This is a red board with arrow bar for target market ppt powerpoint presentation clipart. This is a three stage process. The stages in this process are our goals, arrows, marketing, strategy, business, success.
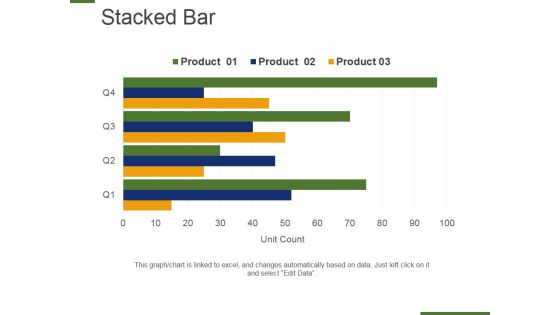
Stacked Bar Template 2 Ppt PowerPoint Presentation Visual Aids Background Images
This is a stacked bar template 2 ppt powerpoint presentation visual aids background images. This is a two stage process. The stages in this planning, management, strategy, marketing, business.

Magnifier With Tools And Bar Graph Ppt PowerPoint Presentation Portfolio Templates
This is a magnifier with tools and bar graph ppt powerpoint presentation portfolio templates. This is a four stage process. The stages in this process are magnifier, search, marketing, strategy, business.
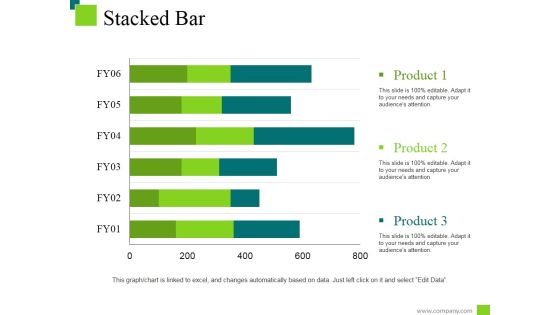
Stacked Bar Template 2 Ppt PowerPoint Presentation Infographic Template File Formats
This is a stacked bar template 2 ppt powerpoint presentation infographic template file formats. This is a three stage process. The stages in this process are product, business, marketing, management.

Bar Chart For Business Performance Evaluation Ppt PowerPoint Presentation Infographics Professional
This is a bar chart for business performance evaluation ppt powerpoint presentation infographics professional. This is a five stage process. The stages in this process are metrics icon, kpis icon, statistics icon.
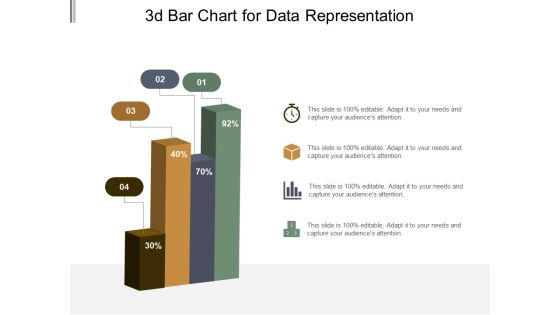
3D Bar Chart For Data Representation Ppt PowerPoint Presentation Model Graphic Tips
This is a 3d bar chart for data representation ppt powerpoint presentation model graphic tips. This is a four stage process. The stages in this process are art, colouring, paint brush.

3D Bar Chart For Percentage Values Comparison Ppt PowerPoint Presentation Professional Visual Aids
This is a 3d bar chart for percentage values comparison ppt powerpoint presentation professional visual aids. This is a five stage process. The stages in this process are art, colouring, paint brush.

3D Bar Chart For Technical Analysis Ppt PowerPoint Presentation Summary Visuals
This is a 3d bar chart for technical analysis ppt powerpoint presentation summary visuals. This is a five stage process. The stages in this process are art, colouring, paint brush.

3D Bar Chart To Display Data Ppt PowerPoint Presentation Icon Design Inspiration
This is a 3d bar chart to display data ppt powerpoint presentation icon design inspiration. This is a four stage process. The stages in this process are art, colouring, paint brush.

100 Percent Stacked Bar Strategy Approaches Ppt PowerPoint Presentation Gallery Visual Aids
This is a 100 percent stacked bar strategy approaches ppt powerpoint presentation gallery visual aids. This is a three stage process. The stages in this process are business, management, strategy, analysis, marketing.

Clustered Bar Chart Yearly Operating Plan Ppt PowerPoint Presentation Styles Icon
This is a clustered bar chart yearly operating plan ppt powerpoint presentation styles icon. This is a four stage process. The stages in this process are business, management, strategy, analysis, marketing.

Bar Charts For Business Performance Analysis Ppt PowerPoint Presentation Show Slideshow
This is a bar charts for business performance analysis ppt powerpoint presentation show slideshow. This is a two stage process. The stages in this process are compare, comparison of two, competitive analysis.

Demonstration Icon Man Showing Bar Chart Ppt Powerpoint Presentation Styles Ideas
This is a demonstration icon man showing bar chart ppt powerpoint presentation styles ideas. This is a three stage process. The stages in this process are illustration, show, demo.

Cost Reduction Analysis Bar Chart Ppt Powerpoint Presentation File Graphics Design
This is a cost reduction analysis bar chart ppt powerpoint presentation file graphics design. This is a five stage process. The stages in this process are data analysis, data science, information science.
Stock Market Trend Dollar Sign On Bar Graph Ppt Powerpoint Presentation Show Deck
This is a stock market trend dollar sign on bar graph ppt powerpoint presentation show deck. This is a four stage process. The stages in this process are stock market, financial market, bull market.

Staked Bar Planning Business Ppt PowerPoint Presentation Infographic Template Infographic Template
This is a staked bar planning business ppt powerpoint presentation infographic template infographic template. This is a three stage process. The stages in this process are finance, marketing, analysis, business, investment.
Growth Arrow On Bar Graph Icon Ppt Powerpoint Presentation Infographic Template Clipart
This is a growth arrow on bar graph icon ppt powerpoint presentation infographic template clipart. This is a three stage process. The stages in this process are financial statements icon, accounting ratio icon, balance sheet icon.
Bar Graph Icon Showing Operating Rhythm Ppt Powerpoint Presentation Ideas Templates
This is a bar graph icon showing operating rhythm ppt powerpoint presentation ideas templates. This is a three stage process. The stages in this process are six sigma, operating rhythm, business rhythm.

Bar Chart With Growth Arrow For Business Expansion Ppt Powerpoint Presentation File Vector
This is a bar chart with growth arrow for business expansion ppt powerpoint presentation file vector. This is a two stage process. The stages in this process are expanding, business development, business expansion.

Bar Chart With Magnifying Glass For Financial Analysis Ppt Powerpoint Presentation Infographics Designs Download
This is a bar chart with magnifying glass for financial analysis ppt powerpoint presentation infographics designs download. This is a three stage process. The stages in this process are business metrics, business kpi, business dashboard.

Business Outcomes Vector Icons Showing Pie And Bar Graph Ppt Powerpoint Presentation File Graphic Images
This is a business outcomes vector icons showing pie and bar graph ppt powerpoint presentation file graphic images. This is a three stage process. The stages in this process are business outcomes, business results, business output.

Bar Graph To Present Financial Information Ppt PowerPoint Presentation Show Tips
This is a bar graph to present financial information ppt powerpoint presentation show tips. This is a four stage process. The stages in this process are stock market, financial markets, bull market.

Bar Graph Icon For Data Analysis Ppt PowerPoint Presentation Pictures Ideas
This is a bar graph icon for data analysis ppt powerpoint presentation pictures ideas. This is a four stage process. The stages in this process are financial analysis, quantitative, statistical modelling.

Quantitative Bar Chart For Data Analysis Ppt PowerPoint Presentation Model Graphic Tips
This is a quantitative bar chart for data analysis ppt powerpoint presentation model graphic tips. This is a two stage process. The stages in this process are financial analysis, quantitative, statistical modelling.

Financial Analysis Vector Bar Graph With Magnifying Glass Ppt PowerPoint Presentation Gallery Design Ideas
This is a financial analysis vector bar graph with magnifying glass ppt powerpoint presentation gallery design ideas. This is a four stage process. The stages in this process are marketing analytics, marketing performance, marketing discovery.

Worldwide Market Trends Mobile With Bar Graph And Globe Ppt PowerPoint Presentation Styles Demonstration
This is a worldwide market trends mobile with bar graph and globe ppt powerpoint presentation styles demonstration. This is a four stage process. The stages in this process are marketing analytics, marketing performance, marketing discovery.
 Home
Home