Sections
Business Diagram Human Icon Bar Graph For Business Presentation Template
Graphic of human icons and bar graph has been used to decorate this power point template. This PPT contains the concept of business communication and result analysis. Use this PPT for business and marketing related presentations.

Business Diagram Peoples On Bars Of Progress Presentation Template
This power point template has been crafted with graphic of peoples and bar graph. This PPT contains the concept of progress and growth. Use this PPT for your business and marketing related presentations.

Business Diagram Business People Over Bar Chart PowerPoint Template
This Power Point template has been designed with graphic of business people and bar chart. This PPT contains the concept of result analysis and business data display. Use this PPT slide for your business and marketing related presentations.

Stock Photo Bar Graph With Growth Arrow PowerPoint Slide
This creative image displays design of Bar Graph with Growth Arrow. This image has been designed to depict business on an Upward Trend. Create an impact with this quality image and make professional presentations.
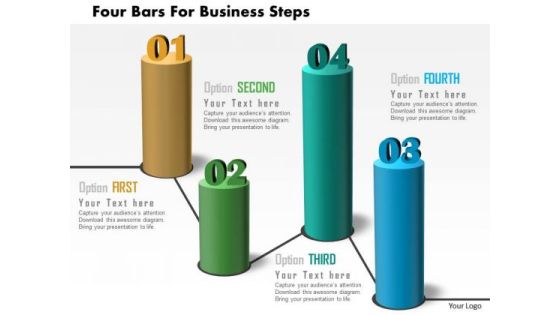
Business Diagram Four Bars For Business Steps Presentation Template
Four bars diagram has been used to design this power point template. This business diagram contains the concept of business milestones. This diagram is designed to attract the attention of your audience.

Business Diagram Bar Graph For Growth And Progress Presentation Template
This business slide has been designed with graphics of bar chart. You may download this diagram to display concepts like growth, progress and success in business. Download this diagram slide to make impressive presentations.

Bank Bar Graph Business Deal Result Analysis Ppt Slides Graphics
This power point icon slide has been designed with four different icons. Icons of bank, bar graph and business deal have been displayed in this slide. Use these icons in your presentations to add professional impact.
Bar Graph Dollar Calculator Laptop Ppt Slides Graphics
This PPT slide has been designed with icons of bar graph, dollar, calculator and laptop. Use these technical icons for technology related concepts. Use these professional icons to build quality presentation for technology related topics.

Laptop Globe Bar Graph Dollar Coins Ppt Slides Graphics
Icons of laptop, globe and bar graph with dollar coins have been used to design this icon PPT slide. Download these icons to display concepts of technology and financial growth. Use this slide to build an exclusive presentation.

Time Management Target Goal Bar Graph Ppt Slides Graphics
This power point template has been crafted with icons of time management, target, goal and bar graph. This icon slide can be used for business analysis and time planning. Build an innovative presentation with all these professional icons.
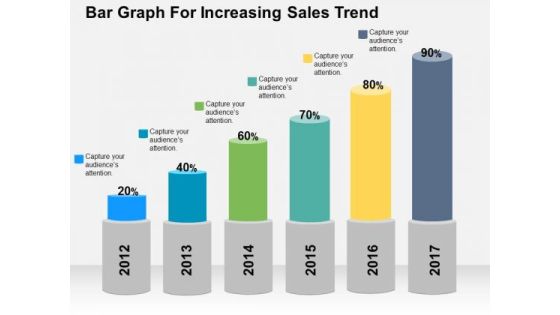
Bar Graph For Increasing Sales Trend PowerPoint Template
Deliver amazing presentations with our above template showing bar graph with percentage values. You may download this slide to depict increase in sales trends. Capture the attention of your audience using this diagram.
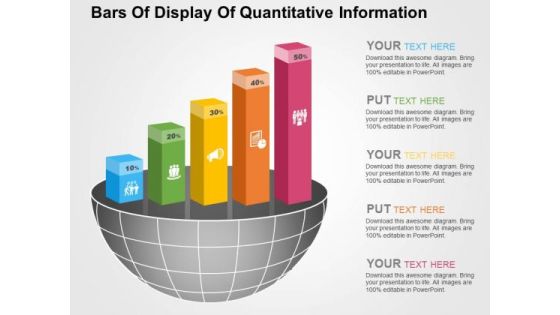
Bars Of Display Of Quantitative Information PowerPoint Templates
Visually support your presentation with our above template illustrating quantitative information. It contains graphics of bars. Etch your views in the brains of your audience with this diagram slide.

Growth Arrow On Bar Graph Infographics Powerpoint Template
This PowerPoint template has been designed with growth arrow on bar graph. You may download this diagram slide to display growth and progress concepts. Illustrate your plans to your listeners with this impressive template.

Man On Bar Graph With Ladders For Success Powerpoint Template
This business slide has been designed with graphics of man on bar graph with ladder. You may download this diagram to display concepts like strategy, management and success. Download this diagram slide to make impressive presentations.

Banner Bar Graph For Success Concept Powerpoint Template
Concepts of success and progress have been displayed in this power point template diagram. This PPT diagram contains the graphic of business man on bar graph. Use this PPT diagram for business and success related presentations.
Four Pencils Bar Graph And Icons Powerpoint Template
Develop competitive advantage with our above template which contains a diagram of five pencils bar graph. This diagram provides an effective way of displaying business information. You can edit text, color, shade and style as per you need.

Dollar Coins Money Growth Bar Graph Powerpoint Template
Use this PowerPoint template, in your corporate presentations. It contains bar graph of dollar coins. This business slide may be used to exhibit money growth. Make wonderful presentations using this diagram.

Bar Graph For Business Growth Steps Powerpoint Slides
This PowerPoint template contains design of bar graph with icons. You may download this slide to display strategy steps for business growth. You can easily customize this template to make it more unique as per your need.
Globe With Bars And Business Icons Powerpoint Templates
Bar graph with globe for statistical analysis has been displayed in this business slide. This business diagram helps to exhibit global statistical analysis and research. Use this diagram to build an exclusive presentation.

Colorful Bars With Icons For Business Agenda Powerpoint Template
Develop competitive advantage with our above template which contains infographic of colorful bars. This diagram provides an effective way of displaying business agenda. You can edit text, color, shade and style as per you need.

Bar Graph For Marketing Research Data Powerpoint Slides
This PowerPoint template has been designed with diagram of bar graph. This PPT slide can be used to prepare presentations for profit growth report and also for financial data analysis. You can download finance PowerPoint template to prepare awesome presentations.

Bar Graph For Marketing Research Process Powerpoint Slides
This PowerPoint template has been designed with diagram of bar graph. This PPT slide can be used to prepare presentations for profit growth report and also for financial data analysis. You can download finance PowerPoint template to prepare awesome presentations.

Bar Graph With Plant For Growth Powerpoint Template
This PowerPoint template has been designed with diagram of bar graph with plant. This infographic template may be used to display growth and progress. Accelerate the impact of your ideas using this template.
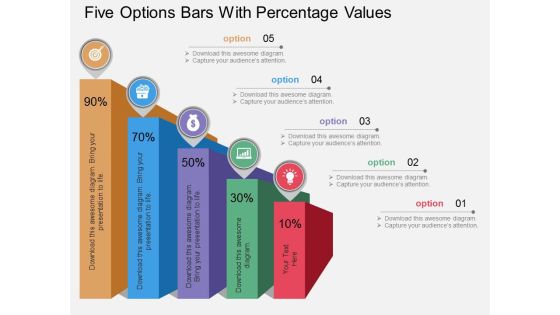
Five Options Bars With Percentage Values Powerpoint Template
Our professionally designed business diagram is as an effective tool for communicating ideas and planning. It contains five options bars with percentage values. Convey your views with this diagram slide. It will amplify the strength of your logic.
Profit Growth Bars With Icons And Mouse Powerpoint Template
Our above slide contains graphics of profit growth bars with icons. This PowerPoint template helps to display outline of business plan. Use this diagram to impart more clarity to data and to create more sound impact on viewers.

Bar Graph With Line Chart For Analysis Powerpoint Slides
This PowerPoint template contains design of bar graph with line chart. You may download this slide to display strategy steps for business growth. You can easily customize this template to make it more unique as per your need.

Bar Graph With Yearly Statistical Analysis Powerpoint Slides
This PowerPoint template contains diagram of bar graph with yearly percentage ratios. You may download this slide to display statistical analysis. You can easily customize this template to make it more unique as per your need.
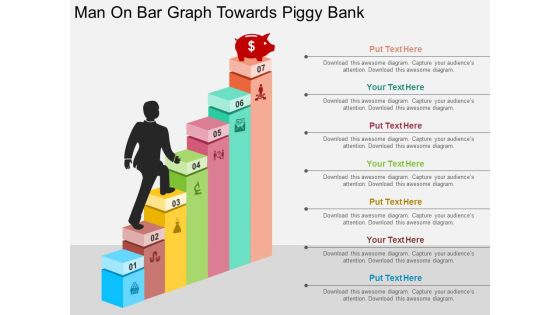
Man On Bar Graph Towards Piggy Bank Powerpoint Templates
Our above business slide contains graphics of man on bar graph towards piggy bank. This slide may be used to exhibit finance planning and saving. Capture the attention of your audience with this slide.

Bar Graph For Year Based Analysis Powerpoint Slides
This PowerPoint template has been designed with year based bar graph. This diagram may be used to display yearly statistical analysis. Use this PPT slide design to make impressive presentations.
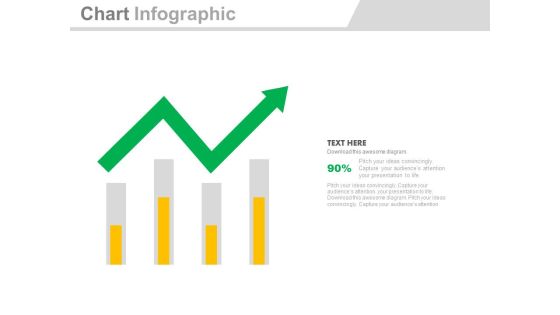
Four Bars With Green Growth Arrow Powerpoint Slides
Four bars with green arrow have been displayed in this business slide. This business diagram helps to exhibit process of business planning. Use this diagram to build an exclusive presentation.

Five Bars For Marketing Research And Analysis Powerpoint Template
This business slide contains diagram of five colorful bars. This diagram provides schematic representation of marketing research and analysis. Visual effect this slide helps in maintaining the flow of the discussion and provides more clarity to the subject.

Bar Graph Infographics With Success Arrow Powerpoint Slides
This PowerPoint template has been designed with bar graph with success arrow. You may use this PPT slide to display goal achievement and planning. Impress your audiences by using this PPT slide.

Bar Graph For Profit Growth Analysis Powerpoint Slides
This PowerPoint template has been designed with bar graph with percentage values. This diagram is useful to exhibit profit growth analysis. This diagram slide can be used to make impressive presentations.

Bar Graph For Yearly Statistical Analysis Powerpoint Slides
This PowerPoint template has been designed with bar graph. This PowerPoint diagram is useful to exhibit yearly statistical analysis. This diagram slide can be used to make impressive presentations.

Five Steps Bar Graph For Financial Management Powerpoint Slides
This PowerPoint template has been designed with five steps bar graph and icons. This diagram is useful to exhibit financial management. This diagram slide can be used to make impressive presentations.
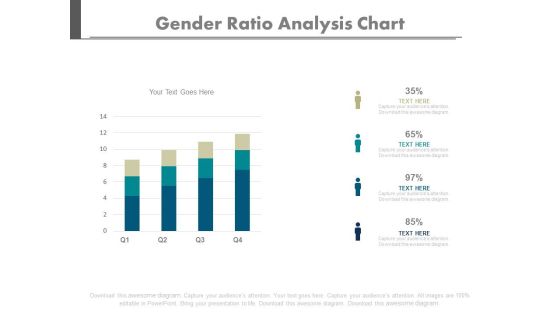
Four Bars Gender Population Ratio Chart Powerpoint Slides
Create dynamic presentations with our creative template of bar graph. This diagram may be used to present gender population. Download this template to leave permanent impression on your audience.
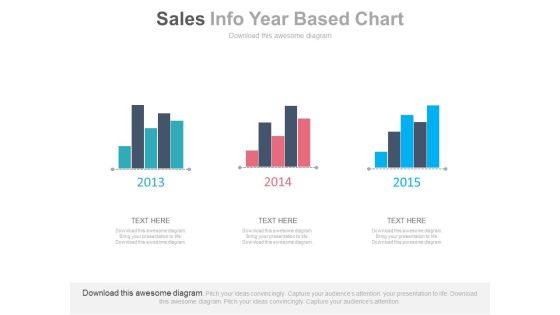
Three Years Sales Data Bar Graph Powerpoint Slides
This PowerPoint template has been designed with bar charts. This business slide may be used to display three years sales data for comparison. Present your views and ideas with this impressive design.
Map Diagram With Bar Graph And Icons Powerpoint Slides
This PowerPoint template displays graphics of map diagram with bar graph and icons. This Map template can be used in business presentations to depict economic analysis. This slide can also be used by school students for educational projects.
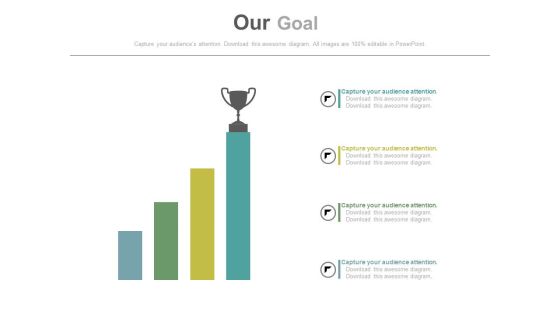
Growth Bar Graph With Trophy On Top Powerpoint Slides
This PowerPoint template has been designed with growth bar graph and trophy onto of it. Download this PPT slide to define and achieve goals with more success. This diagram may be used for goal planning related topics.

Bar Graph For Data Distribution And Analysis Powerpoint Slides
This PowerPoint template has been designed with bar graph. This PowerPoint diagram is useful for data distribution and analysis This diagram slide can be used to make impressive presentations.

Bar Graph With Increasing Percentage Flow Powerpoint Slides
This PowerPoint slide has been designed with bar graph and increasing percentage values. This diagram slide may be used to display profit growth. Prove the viability of your ideas with this professional slide.

Board With Bar Graph For Financial Analysis Powerpoint Slides
You can download this PowerPoint template to display statistical data and analysis. This PPT slide contains display board with bar graph. Draw an innovative business idea using this professional diagram.
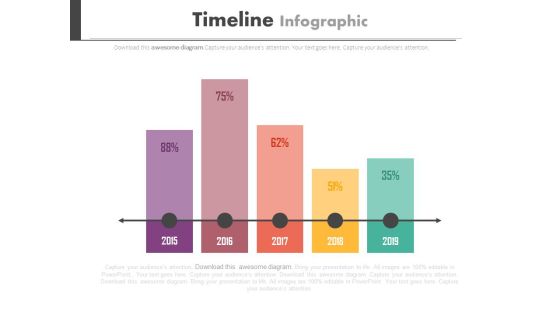
Timeline Bar Graph For Yearly Planning Powerpoint Slides
This PowerPoint template has been designed with timeline bar graph. You may download this timeline diagram slide to display long term planning for business. Chart the course you intend to take with this slide.

Bar Graph On Blackboard For Growth Analysis Powerpoint Template
Visually support your presentation with our above template containing bar graph on blackboard. This PowerPoint template helps to display growth analysis. Etch your views in the brains of your audience with this diagram slide.

Six Options Bars For Financial Ratio Analysis Powerpoint Template
Develop competitive advantage with our above template which contains six option bars for financial ratio analysis. This diagram provides an effective way of displaying business information. You can edit text, color, shade and style as per you need.

Bar Graph With Financial Ratio And Icons Powerpoint Template
Visually support your presentation with our above template containing bar graph with icons. This diagram slide helps to exhibit financial ratio analysis. Etch your views in the brains of your audience with this diagram slide.

Projects And Assignments Bar Graph Ppt Sample Download
This is a projects and assignments bar graph ppt sample download. This is a five stage process. The stages in this process are business, process, marketing, strategy, graph chart, management.
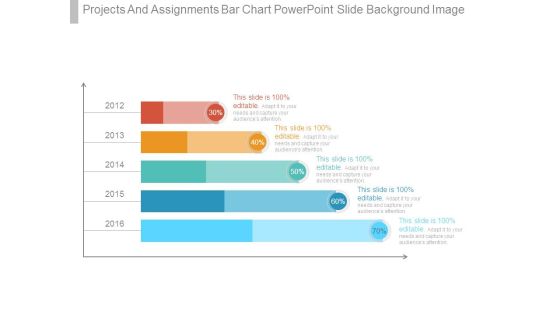
Projects And Assignments Bar Chart Powerpoint Slide Background Image
This is a projects and assignments bar chart powerpoint slide background image. This is a five stage process. The stages in this process are finance, presentation, business, strategy, marketing.

Bars For Digital Marketing Tools Ppt Examples Slides
This is a bars for digital marketing tools ppt examples slides. This is a seven stage process. The stages in this process are advertising, social, email, website, direct mail, seo ppc, events.
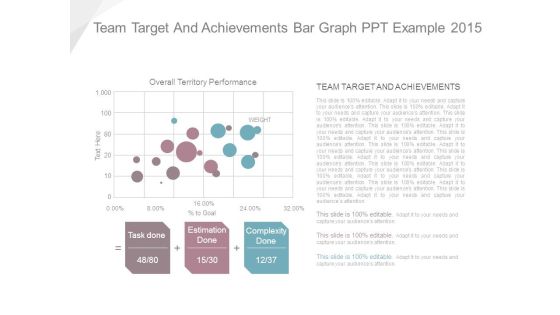
Team Target And Achievements Bar Graph Ppt Example 2015
This is a team target and achievements bar graph ppt example 2015. This is a three stage process. The stages in this process are task done, estimation done, complexity done, overall territory performance, team target and achievements.

Bar Graph For Changes In Competitive Environment Example Of Ppt
This is a bar graph for changes in competitive environment example of ppt. This is a four stage process. The stages in this process are engagement, brand, monthly, weekly.

Changes In Competitive Environment Bar Chart Sample Of Ppt Presentation
This is a changes in competitive environment bar chart sample of ppt presentation. This is a four stage process. The stages in this process are engagement, brand, monthly, weekly.

Hiring Plan Bar Chart Powerpoint Slide Background Image
This is a hiring plan bar chart powerpoint slide background image. This is a five stage process. The stages in this process are engineering, sales, marketing, product, support, finance.

Hiring Plan Bar Graph With Categories Powerpoint Slide Graphics
This is a hiring plan bar graph with categories powerpoint slide graphics. This is a five stage process. The stages in this process are finance, support, product, marketing, sales, engineering.
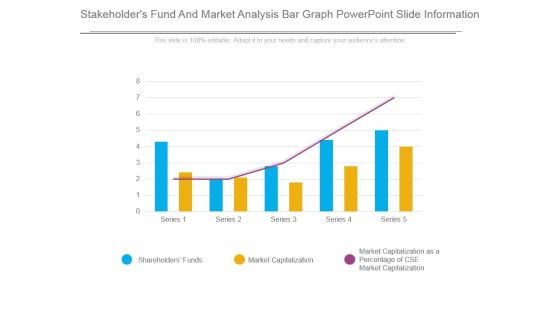
Stakeholders Fund And Market Analysis Bar Graph Powerpoint Slide Information
This is a stakeholders fund and market analysis bar graph powerpoint slide information. This is a five stage process. The stages in this process are shareholders funds, market capitalization, market capitalization as a percentage of cse market capitalization.
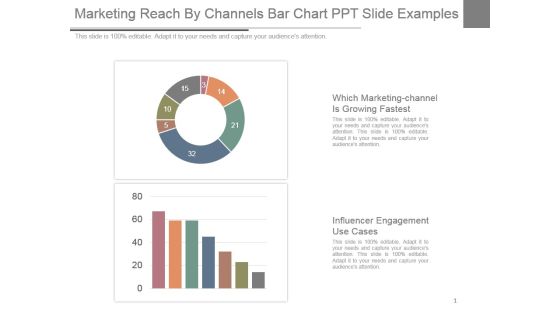
Marketing Reach By Channels Bar Chart Ppt Slide Examples
This is a marketing reach by channels bar chart ppt slide examples. This is a two stage process. The stages in this process are which marketing-channel is growing fastest, influencer engagement use cases.
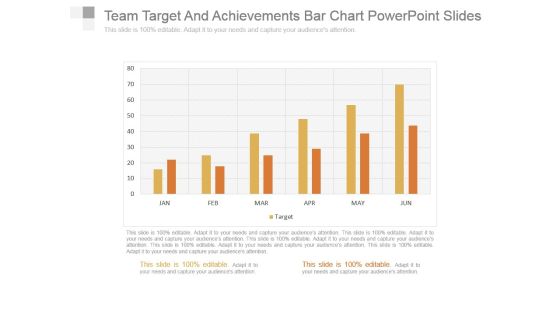
Team Target And Achievements Bar Chart Powerpoint Slides
This is a team target and achievements bar chart powerpoint slides. This is a six stage process. The stages in this process are business, success, graph chart, strategy, marketing.
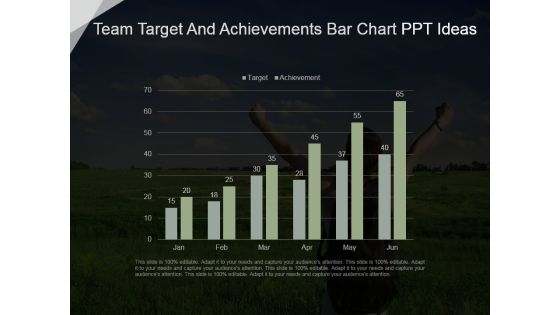
Team Target And Achievements Bar Chart Ppt Ideas
This is a team target and achievements bar chart ppt ideas. This is a six stage process. The stages in this process are business, marketing, graph chart, success, strategy.

Inflation Rate Analysis Bar Graph Powerpoint Slide Backgrounds
This is a inflation rate analysis bar graph powerpoint slide backgrounds. This is a twelve stage process. The stages in this process are jan, feb, mar, apr, may, jun, jul, aug, sep, oct, nov, dec.
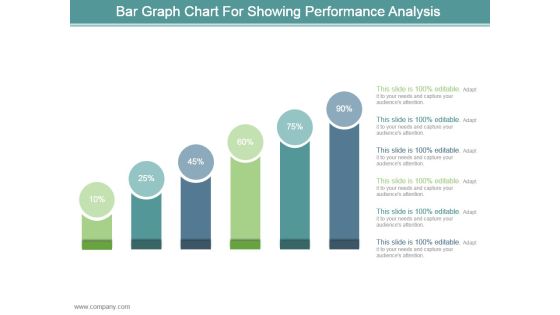
Bar Graph Chart For Showing Performance Analysis Ppt Design
This is a bar graph chart for showing performance analysis ppt design. This is a six stage process. The stages in this process are business, marketing, process, success, presentation.
 Home
Home