Sections

Bar Graph Ppt PowerPoint Presentation Model Clipart
This is a bar graph ppt powerpoint presentation model clipart. This is a six stage process. The stages in this process are sales in percentage, product, bar graph, business, marketing.

Bar Graph Ppt PowerPoint Presentation Pictures Tips
This is a bar graph ppt powerpoint presentation pictures tips. This is a five stage process. The stages in this process are bar graph, finance, marketing, strategy, analysis, business.

Bar Graph Ppt PowerPoint Presentation Outline Layout
This is a bar graph ppt powerpoint presentation outline layout. This is a four stage process. The stages in this process are sales in percentage, product, bar graph, business, marketing.

Bar Graph Ppt PowerPoint Presentation Styles Model
This is a bar graph ppt powerpoint presentation styles model. This is a four stage process. The stages in this process are bar graph, finance, marketing, analysis, investment, business.

Bar Graph Ppt PowerPoint Presentation Professional Guide
This is a bar graph ppt powerpoint presentation professional guide. This is a eight stage process. The stages in this process are axis title, bar graph, business, marketing, management.

Bar Chart Ppt PowerPoint Presentation Layouts Pictures
This is a bar chart ppt powerpoint presentation layouts pictures. This is a three stage process. The stages in this process are bar graph, product, sales in percentage, business, marketing.

Bar Chart Ppt PowerPoint Presentation Outline Infographics
This is a bar chart ppt powerpoint presentation outline infographics. This is a two stage process. The stages in this process are bar chart, finance, marketing, strategy, analysis, business.

Bar Chart Ppt PowerPoint Presentation Icon Layout
This is a bar chart ppt powerpoint presentation icon layout. This is a one stage process. The stages in this process are sales in percentage, financial years, bar chart, finance, marketing.

Bar Chart Ppt PowerPoint Presentation Icon Information
This is a bar chart ppt powerpoint presentation icon information. This is a one stage process. The stages in this process are product, sales in percentage, financial years, bar graph, growth.

Clustered Bar Ppt PowerPoint Presentation Pictures Example
This is a clustered bar ppt powerpoint presentation pictures example. This is a three stage process. The stages in this process are product, unit count, clustered bar, business, marketing.

Bar Graph Ppt PowerPoint Presentation File Slides
This is a bar graph ppt powerpoint presentation file slides. This is a three stage process. The stages in this process are product, sales in percentage, bar graph, growth, success.

Bar Diagram Ppt PowerPoint Presentation Gallery Structure
This is a bar diagram ppt powerpoint presentation gallery structure. This is a three stage process. The stages in this process are financial in years, sales in percentage, bar graph, growth, success.

clustered bar ppt powerpoint presentation model display
This is a clustered bar ppt powerpoint presentation model display. This is a two stage process. The stages in this process are clustered bar, finance, marketing, strategy, analysis, business.

Bar Chart Ppt PowerPoint Presentation Icon Inspiration
This is a bar chart ppt powerpoint presentation icon inspiration. This is a three stage process. The stages in this process are bar chart, finance, marketing, strategy, analysis, business.

Bar Chart Ppt PowerPoint Presentation Styles Smartart
This is a bar chart ppt powerpoint presentation styles smartart. This is a two stage process. The stages in this process are bar chart, growth, finance, marketing, strategy, analysis.
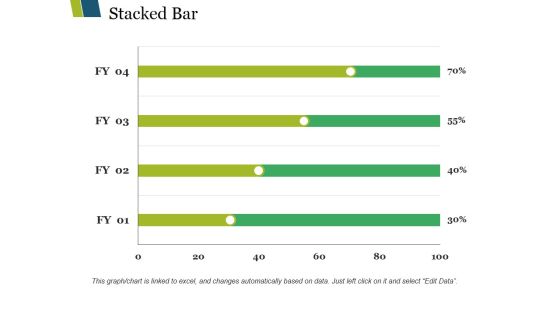
Stacked Bar Ppt PowerPoint Presentation Layouts Show
This is a stacked bar ppt powerpoint presentation layouts show. This is a four stage process. The stages in this process are stacked bar, finance, analysis, marketing, strategy, business.

Bar Chart Ppt PowerPoint Presentation Inspiration Demonstration
This is a bar chart ppt powerpoint presentation inspiration demonstration. This is a two stage process. The stages in this process are bar chart, financial years, sales in percentage, product, finance.

Bar Chart Ppt PowerPoint Presentation Outline Backgrounds
This is a bar chart ppt powerpoint presentation outline backgrounds. This is a one stage process. The stages in this process are sales in percentage, financial years, product, bar graph, finance.

Bar Chart Ppt PowerPoint Presentation Model Picture
This is a bar chart ppt powerpoint presentation model picture. This is a two stage process. The stages in this process are product, sales in percentage, financial years, bar chart.

Bar Chart Ppt PowerPoint Presentation Icon Diagrams
This is a bar chart ppt powerpoint presentation icon diagrams. This is a two stage process. The stages in this process are bar chart, finance, analysis, business, marketing, strategy.

Clustered Bar Ppt PowerPoint Presentation File Display
This is a clustered bar ppt powerpoint presentation file display. This is a three stage process. The stages in this process are product, clustered bar, unit count, business, marketing.

Bar Graph Ppt PowerPoint Presentation Summary Format
This is a bar graph ppt powerpoint presentation summary format. This is a three stage process. The stages in this process are bar graph, business, marketing, years, percentage, finance.

Bar Graph Ppt PowerPoint Presentation Layouts Influencers
This is a bar graph ppt powerpoint presentation layouts influencers. This is a two stage process. The stages in this process are business, marketing, in bar graph, sales in percentage, finance.

Clustered Bar Ppt PowerPoint Presentation Icon Professional
This is a clustered bar ppt powerpoint presentation icon professional. This is a two stage process. The stages in this process are business, marketing, profit, clustered bar, finance, strategy.

Bar Chart Ppt PowerPoint Presentation Slides Model
This is a bar chart ppt powerpoint presentation slides model. This is a two stage process. The stages in this process are bar chart, analysis, business, marketing, strategy, finance.

Stacked Bar Ppt PowerPoint Presentation Infographics Elements
This is a stacked bar ppt powerpoint presentation infographics elements. This is a four stages process. The stages in this process are stacked bar, finance, planning, management, strategy, business.
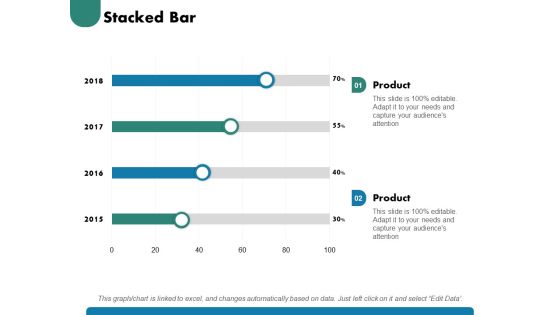
Stacked Bar Ppt PowerPoint Presentation Slides Demonstration
This is a stacked bar ppt powerpoint presentation slides demonstration. This is a two stage process. The stages in this process are stacked bar, finance, marketing, management, investment, analysis.

Clustered Bar Ppt PowerPoint Presentation Professional Vector
This is a clustered bar ppt powerpoint presentation professional vector. This is a two stage process. The stages in this process are clustered bar, finance, marketing, management, investment, analysis.

Stacked Bar Ppt PowerPoint Presentation Model Graphics
This is a stacked bar ppt powerpoint presentation model graphics. This is a two stage process. The stages in this process are stacked bar, product, chart and graph, finance, business.

Bar Graph Ppt PowerPoint Presentation Summary Brochure
This is a bar graph ppt powerpoint presentation summary brochure. This is a four stage process. The stages in this process are business, market strategy, management, bar graph, product
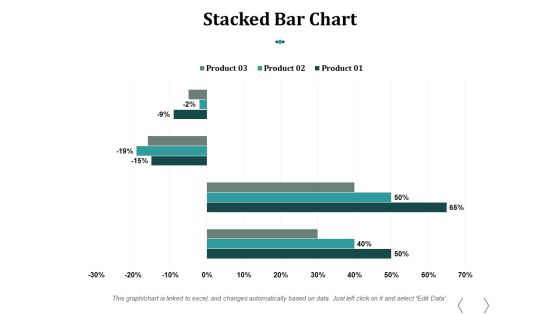
Stacked Bar Chart Ppt PowerPoint Presentation Influencers
This is a stacked bar chart ppt powerpoint presentation influencers. This is a three stage process. The stages in this process are stacked bar chart, product, percentage, finance, business.

Bar Graph Ppt PowerPoint Presentation Styles Skills
This is a bar graph ppt powerpoint presentation styles skills. This is a two stage process. The stages in this process are bar graph, product, in year, in percentage, business.

Business Framework Bar Chart In PowerPoint Presentation
This power point diagram slide has been designed with graphic of bar chart. In this diagram slide we have used green and blue colored vertical bar graph. Display result analysis with this bar graph diagram and use it in your result verification and analysis related presentations.
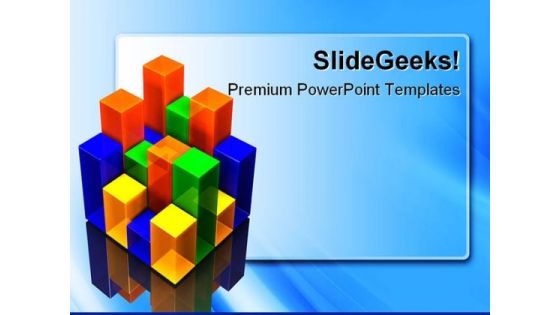
Bar Chart Business PowerPoint Template 0810
3D illustration of a colorful multi-segment bar chart over top of a light blue textured background with plenty of open space for your text

Employee Photo With Percentage Bars Powerpoint Slides
This dashboard template contains employee photo with percentage bars. This dashboard PowerPoint template conveys employees performance in a visual manner. Download this PPT slide for quick decision-making.

Media Mix Optimization Bar Chart Ppt Slides
This is a media mix optimization bar chart ppt slides. This is a one stage process. The stages in this process are business, media, success.

Portfolio Evaluation Bar Graph Ppt Slides
This is a portfolio evaluation bar graph ppt slides. This is a five stage process. The stages in this process are business, finance, marketing.

Security Analysis Bar Graph Ppt Slides
This is a security analysis bar chart ppt slides. This is a one stage process. The stages in this process are business, finance, marketing.

Target Modelling Bar Chart Ppt Slides
This is a target modelling bar chart ppt slides. This is a six stage process. The stages in this process are arrows, business, success.
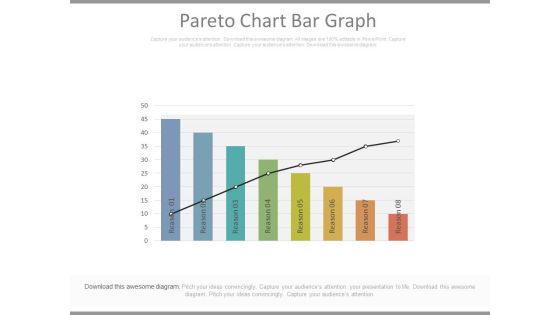
Pareto Chart Bar Graph Ppt Slides
This is a pareto chart bar graph ppt slides. This is a eight stage process. The stages in this process are business, marketing, success.\n

Business Plan With Bar Graph Powerpoint Guide
This is a business plan with bar graph powerpoint guide. This is a four stage process. The stages in this process are sales, years, net profit, gross profit.

Product Development Analysis Bar Graph Powerpoint Themes
This is a product development analysis bar graph powerpoint themes. This is a five stage process. The stages in this process are business, growth, strategy, management, pretention.
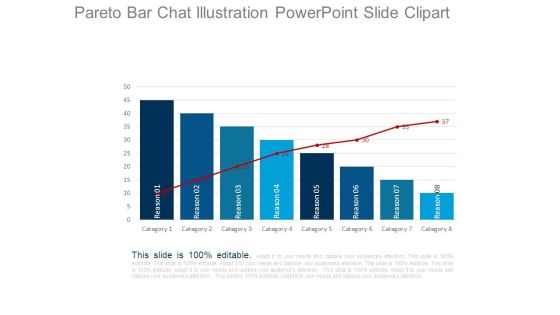
Pareto Bar Chat Illustration Powerpoint Slide Clipart
This is a pareto bar chat illustration powerpoint slide clipart. This is a eight stage process. The stages in this process are category, reason.
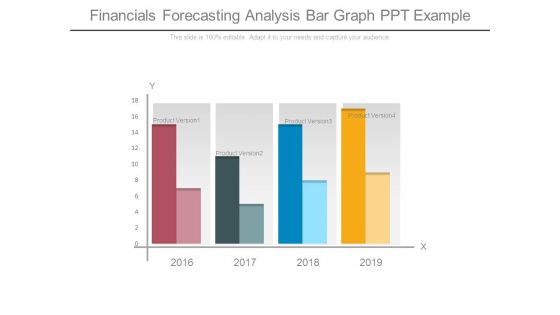
Financials Forecasting Analysis Bar Graph Ppt Example
This is a financials forecasting analysis bar graph ppt example. This is a four stage process. The stages in this process are product version.
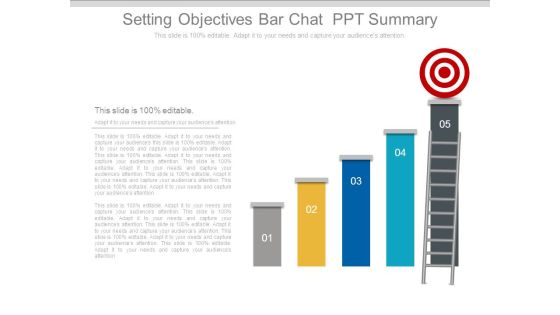
Setting Objectives Bar Chat Ppt Summary
This is a setting objectives bar chat ppt summary. This is a five stage process. The stages in this process are business, success, target, stair, growth, strategy, management.
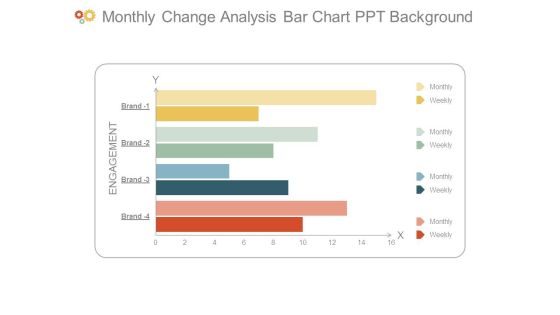
Monthly Change Analysis Bar Chart Ppt Background
This is a monthly change analysis bar chart ppt background. This is a four stage process. The stages in this process are engagement, monthly, weekly, brand.
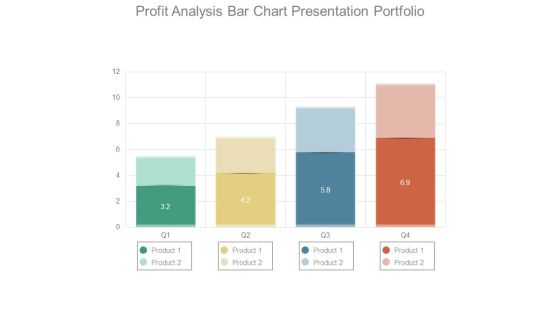
Profit Analysis Bar Chart Presentation Portfolio
This is a profit analysis bar chart presentation portfolio. This is a four stage process. The stages in this process are product.

Band Engagement Analysis Bar Graph Powerpoint Ideas
This is a band engagement analysis bar graph powerpoint ideas. This is a four stage process. The stages in this process are engagement, brand, monthly, weekly.
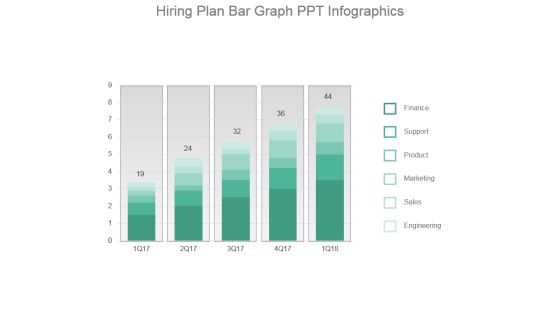
Hiring Plan Bar Graph Ppt Infographics
This is a hiring plan bar graph ppt infographics. This is a five stage process. The stages in this process are finance, support, product, marketing, sales, engineering.

Bar Chart For Data Analytics Ppt Examples
This is a bar chart for data analytics ppt examples. This is a five stage process. The stages in this process are category.

Data Analytics Bar Chart Ppt Sample Presentations
This is a data analytics bar chart ppt sample presentations. This is a five stage process. The stages in this process are category.

Performance Analysis Bar Graph Powerpoint Shapes
This is a performance analysis bar graph powerpoint shapes. This is a four stage process. The stages in this process are growth, finance, strategy, management, marketing.

Bar Graph Ppt PowerPoint Presentation Slide Download
This is a bar graph ppt powerpoint presentation slide download. This is a five stage process. The stages in this process are arrow, business, bargraph, growth, success.

Bar Graph Ppt PowerPoint Presentation Files
This is a bar graph ppt powerpoint presentation files. This is a five stage process. The stages in this process are business, graph, growth, success, management.

Bar Graph Ppt PowerPoint Presentation Topics
This is a bar graph ppt powerpoint presentation topics. This is a five stage process. The stages in this process are business, strategy, icons, management.

Bar Graph Ppt PowerPoint Presentation Backgrounds
This is a bar graph ppt powerpoint presentation backgrounds. This is a four stage process. The stages in this process are business, marketing, finance, growth, management.

Bar Graph Ppt PowerPoint Presentation Example
This is a bar graph ppt powerpoint presentation example. This is a five stage process. The stages in this process are graph, growth, icons, strategy, success.

Bar Graph Ppt PowerPoint Presentation Shapes
This is a bar graph ppt powerpoint presentation shapes. This is a five stage process. The stages in this process are arrows, marketing, strategy, business, success.

Bar Graph Ppt PowerPoint Presentation Templates
This is a bar graph ppt powerpoint presentation templates. This is a four stage process. The stages in this process are arrows, business, marketing, strategy, growth, graphic.

Bar Graph Ppt PowerPoint Presentation Clipart
This is a bar graph ppt powerpoint presentation clipart. This is a four stage process. The stages in this process are silhouettes, business, success, growth, stair.
 Home
Home