AI PPT Maker
Templates
PPT Bundles
Design Services
Business PPTs
Business Plan
Management
Strategy
Introduction PPT
Roadmap
Self Introduction
Timelines
Process
Marketing
Agenda
Technology
Medical
Startup Business Plan
Cyber Security
Dashboards
SWOT
Proposals
Education
Pitch Deck
Digital Marketing
KPIs
Project Management
Product Management
Artificial Intelligence
Target Market
Communication
Supply Chain
Google Slides
Research Services
 One Pagers
All Categories
-
Home
- Customer Favorites
- Scoring Chart
Scoring Chart

Best Practices For Increasing Lead Conversion Rates Bar Chart Ppt Model Example Introduction PDF
Presenting this set of slides with name best practices for increasing lead conversion rates bar chart ppt model example introduction pdf. The topics discussed in these slide is bar chart. This is a completely editable PowerPoint presentation and is available for immediate download. Download now and impress your audience.
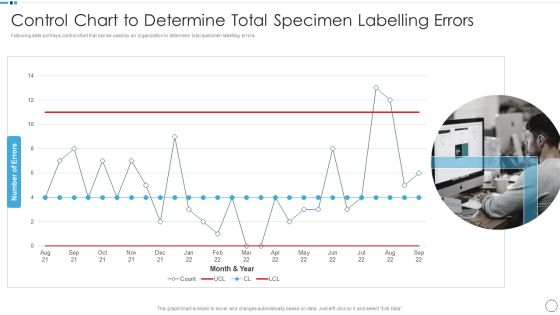
QA Plan Set 1 Control Chart To Determine Total Specimen Labelling Errors Sample PDF
Deliver an awe inspiring pitch with this creative QA Plan Set 1 Control Chart To Determine Total Specimen Labelling Errors Sample PDF bundle. Topics like Control Chart To Determine, Specimen Labelling Errors can be discussed with this completely editable template. It is available for immediate download depending on the needs and requirements of the user.
Project Initiation And Planning Flow Chart Vector Icon Ppt PowerPoint Presentation Outline Diagrams PDF
Persuade your audience using this project initiation and planning flow chart vector icon ppt powerpoint presentation outline diagrams pdf. This PPT design covers three stages, thus making it a great tool to use. It also caters to a variety of topics including project initiation and planning flow chart vector icon. Download this PPT design now to present a convincing pitch that not only emphasizes the topic but also showcases your presentation skills.

Stock Control System Volume Open High Low Close Chart Ppt Model Slides PDF
Deliver an awe inspiring pitch with this creative stock control system volume open high low close chart ppt model slides pdf bundle. Topics like volume open high low close chart can be discussed with this completely editable template. It is available for immediate download depending on the needs and requirements of the user.
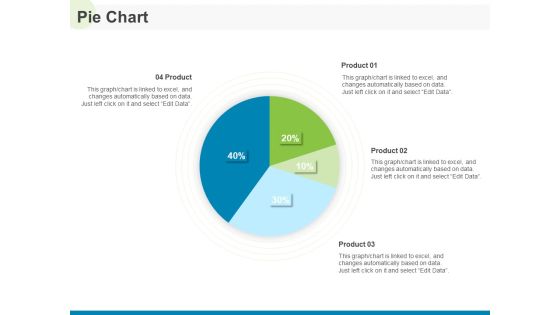
Implementing Human Resources HR Best Practices Strategy Pie Chart Ppt Inspiration Graphics Tutorials PDF
Presenting this set of slides with name implementing human resources hr best practices strategy pie chart ppt inspiration graphics tutorials pdf. The topics discussed in these slide is pie chart. This is a completely editable PowerPoint presentation and is available for immediate download. Download now and impress your audience.

Best Practices For Increasing Lead Conversion Rates Line Chart Ppt Professional Show PDF
Presenting this set of slides with name best practices for increasing lead conversion rates line chart ppt professional show pdf. The topics discussed in these slide is line chart. This is a completely editable PowerPoint presentation and is available for immediate download. Download now and impress your audience.

Best Practices For Increasing Lead Conversion Rates Pie Chart Ppt Pictures Slideshow PDF
Presenting this set of slides with name best practices for increasing lead conversion rates pie chart ppt pictures slideshow pdf. The topics discussed in these slide is pie chart. This is a completely editable PowerPoint presentation and is available for immediate download. Download now and impress your audience.
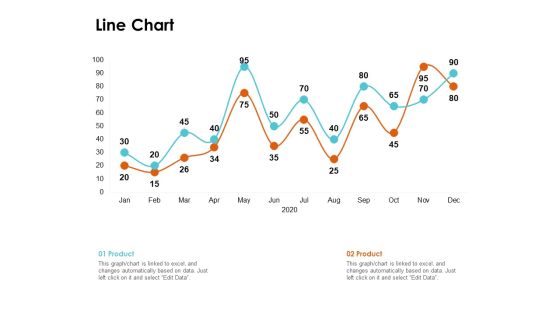
Scrum Practices For Marketing Teams Line Chart Ppt PowerPoint Presentation Layouts Introduction PDF
Presenting this set of slides with name scrum practices for marketing teams line chart ppt powerpoint presentation layouts introduction pdf. The topics discussed in these slide is line chart. This is a completely editable PowerPoint presentation and is available for immediate download. Download now and impress your audience.

Velocity Chart With Lower And Upper Control Limit Ppt PowerPoint Presentation Gallery Infographics PDF
Pitch your topic with ease and precision using this velocity chart with lower and upper control limit ppt powerpoint presentation gallery infographics pdf. This layout presents information on velocity chart with lower and upper control limit. It is also available for immediate download and adjustment. So, changes can be made in the color, design, graphics or any other component to create a unique layout.

Best Practices For Increasing Lead Conversion Rates Organization Chart Ppt Gallery Graphic Images PDF
Presenting this set of slides with name best practices for increasing lead conversion rates organization chart ppt gallery graphic images pdf. This is a three stage process. The stages in this process are organization chart. This is a completely editable PowerPoint presentation and is available for immediate download. Download now and impress your audience.

Execute Operational Procedure Dashboard With Raci Chart And Action Timeline Metric Designs PDF
Deliver and pitch your topic in the best possible manner with this execute operational procedure dashboard with raci chart and action timeline metric designs pdf. Use them to share invaluable insights on execute operational procedure dashboard with raci chart and action timeline and impress your audience. This template can be altered and modified as per your expectations. So, grab it now.

Execute Operational Procedure Dashboard With Raci Chart And Action Timeline Quality Structure PDF
Deliver an awe inspiring pitch with this creative execute operational procedure dashboard with raci chart and action timeline quality structure pdf bundle. Topics like execute operational procedure dashboard with raci chart and action timeline 1 or 2 can be discussed with this completely editable template. It is available for immediate download depending on the needs and requirements of the user.

3d Gears Chart 6 Stages Process Flow Ppt Business Plans For Sale PowerPoint Slides
Analyse ailments on our 3d gears chart 6 stages process flow ppt business plans for sale PowerPoint Slides. Bring out the thinking doctor in you.

Eight Diverging Components A Circular Process Business Pie Chart PowerPoint Slides
We present our eight diverging components a circular process business Pie Chart PowerPoint Slides.Present our Business PowerPoint Templates because everybody knows The world over it is a priority for many. Along with it there are so many oppurtunities waiting to be utilised. Download and present our Circle Charts PowerPoint Templates because our ready backdrops leave a lasting impression. Present our Arrows PowerPoint Templates because you can Show them how to churn out fresh ideas. Use our Shapes PowerPoint Templates because watching them will strengthen your companys sinews. Use our Flow charts PowerPoint Templates because you can get advantage to prioritise your ideas.Use these PowerPoint slides for presentations relating to Arrows, blank, business, central, centralized, chart, circle, circular, circulation concept, conceptual, converging, design, diagram, empty, executive, icon, idea illustration, management, map, mapping, moa, model, numbers, organization outwards, pointing, procedure, process, radial, radiating, relationship, resource sequence, sequential, seven, square, strategy, template. The prominent colors used in the PowerPoint template are Blue, Gray, White. Presenters tell us our eight diverging components a circular process business Pie Chart PowerPoint Slides are Efficacious. Presenters tell us our centralized PowerPoint templates and PPT Slides are Handsome. PowerPoint presentation experts tell us our eight diverging components a circular process business Pie Chart PowerPoint Slides are Awesome. We assure you our business PowerPoint templates and PPT Slides are Delightful. Customers tell us our eight diverging components a circular process business Pie Chart PowerPoint Slides are Functional. People tell us our central PowerPoint templates and PPT Slides are Delightful.
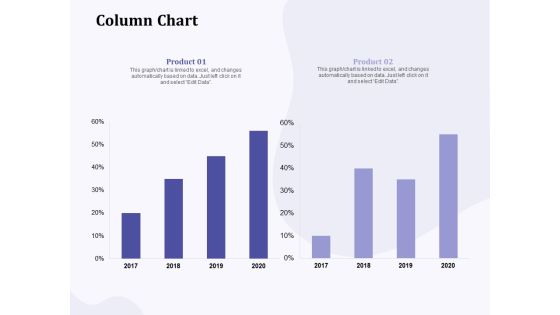
New Commodity Building Procedure Column Chart Ppt Styles Slide Portrait PDF
Presenting this set of slides with name new commodity building procedure column chart ppt styles slide portrait pdf. The topics discussed in these slide is column chart. This is a completely editable PowerPoint presentation and is available for immediate download. Download now and impress your audience.
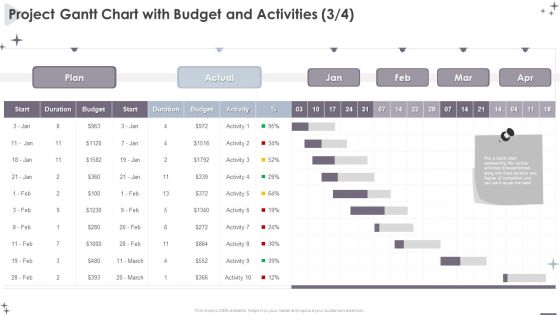
Project Administration Bundle Project Gantt Chart With Budget And Activities Infographics PDF
Your complex projects can be managed and organized simultaneously using this detailed Project Administration Bundle Project Gantt Chart With Budget And Activities Infographics PDF template. Track the milestones, tasks, phases, activities, and subtasks to get an updated visual of your project. Share your planning horizon and release plan with this well crafted presentation template. This exemplary template can be used to plot various dependencies to distinguish the tasks in the pipeline and their impact on the schedules and deadlines of the project. Apart from this, you can also share this visual presentation with your team members and stakeholders. It a resourceful tool that can be incorporated into your business structure. Therefore, download and edit it conveniently to add the data and statistics as per your requirement.
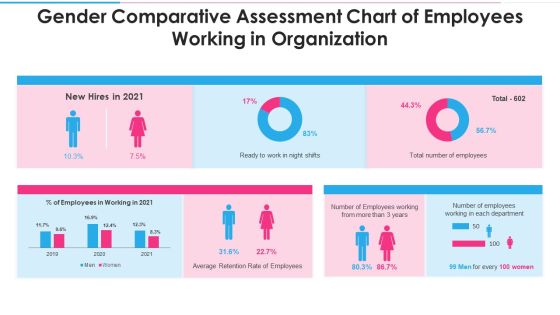
Gender Comparative Assessment Chart Of Employees Working In Organization Structure PDF
Showcasing this set of slides titled gender comparative assessment chart of employees working in organization structure pdf. The topics addressed in these templates are gender comparative assessment chart of employees working in organization. All the content presented in this PPT design is completely editable. Download it and make adjustments in color, background, font etc. as per your unique business setting.

Developing Work Force Management Plan Model Organization Chart Ppt Inspiration Portfolio PDF
Presenting developing work force management plan model organization chart ppt inspiration portfolio pdf to provide visual cues and insights. Share and navigate important information on four stages that need your due attention. This template can be used to pitch topics like organization chart. In addition, this PPT design contains high-resolution images, graphics, etc, that are easily editable and available for immediate download.
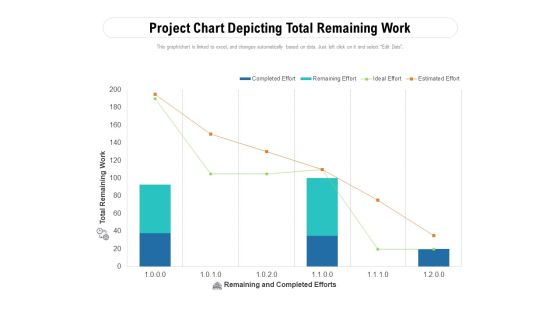
Project Chart Depicting Total Remaining Work Ppt PowerPoint Presentation File Slides PDF
Pitch your topic with ease and precision using this project chart depicting total remaining work ppt powerpoint presentation file slides pdf. This layout presents information on project chart depicting total remaining work. It is also available for immediate download and adjustment. So, changes can be made in the color, design, graphics or any other component to create a unique layout.
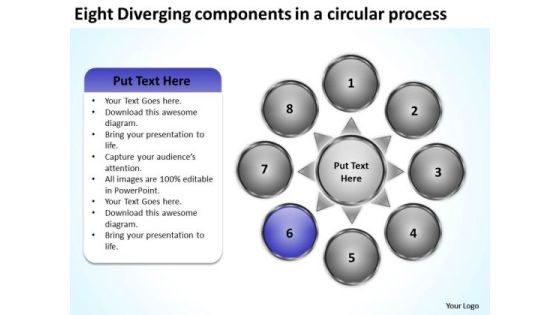
Eight Diverging Components A Circular Process Circular Pie Chart PowerPoint Slides
We present our eight diverging components a circular process Circular Pie Chart PowerPoint Slides.Use our Business PowerPoint Templates because you can Flutter your wings and enchant the world. Impress them with the innate attractiveness of your thoughts and words. Use our Circle Charts PowerPoint Templates because you are the star of your enlightened team. Download and present our Arrows PowerPoint Templates because the key criteria for necessary infrastructure are at your finger tips. Radiate this knowledge to the group and see their eyes light up. Use our Shapes PowerPoint Templates because the structure of our templates allows you to effectively highlight the key issues concerning the growth of your business. Use our Flow charts PowerPoint Templates because this template contains the material to highlight the key issues of your presentation.Use these PowerPoint slides for presentations relating to Arrows, blank, business, central, centralized, chart, circle, circular, circulation concept, conceptual, converging, design, diagram, empty, executive, icon, idea illustration, management, map, mapping, moa, model, numbers, organization outwards, pointing, procedure, process, radial, radiating, relationship, resource sequence, sequential, seven, square, strategy, template. The prominent colors used in the PowerPoint template are Blue, Gray, White. Presenters tell us our eight diverging components a circular process Circular Pie Chart PowerPoint Slides are Breathtaking. Presenters tell us our business PowerPoint templates and PPT Slides have awesome images to get your point across. PowerPoint presentation experts tell us our eight diverging components a circular process Circular Pie Chart PowerPoint Slides are Adorable. We assure you our chart PowerPoint templates and PPT Slides are Excellent. Customers tell us our eight diverging components a circular process Circular Pie Chart PowerPoint Slides are Fabulous. People tell us our chart PowerPoint templates and PPT Slides are effectively colour coded to prioritise your plans They automatically highlight the sequence of events you desire.

Distinct View Of An Issue Circularly Described Flow Chart PowerPoint Templates
We present our distinct view of an issue circularly described Flow Chart PowerPoint templates.Present our Circle Charts PowerPoint Templates because firing the arrows to emblazon the desired path will let you achieve anticipated results. Present our Arrows PowerPoint Templates because you have to coordinate and motivate your team. Download our Ring Charts PowerPoint Templates because this template helps you to illustrate your method, piece by piece, and interlock the whole process in the minds of your audience. Present our Business PowerPoint Templates because you are ready to flap your wings and launch off. All poised are you to touch the sky with glory. Present our Flow Charts PowerPoint Templates because Our PowerPoint Templates and Slides are topically designed to provide an attractive backdrop to any subject.Use these PowerPoint slides for presentations relating to 3d, arrow, blue, chart, circle, circular, circulation, collection, concept, connection, continuity, cursor, cycle, cyclic, diagram, direction, dynamic, flow, flowchart, graph, graphic, green, group, icon, loop, motion, movement, process, progress, recycle, recycling, red, refresh, reload, renew, repetition, return, reuse, rgb, ring, rotation, round, set, sign, spin, symbol, three, turn, update, vector. The prominent colors used in the PowerPoint template are Red, Yellow, Green. Presenters tell us our distinct view of an issue circularly described Flow Chart PowerPoint templates are Attractive. You can be sure our concept PowerPoint templates and PPT Slides are incredible easy to use. Professionals tell us our distinct view of an issue circularly described Flow Chart PowerPoint templates effectively help you save your valuable time. People tell us our circulation PowerPoint templates and PPT Slides will make the presenter look like a pro even if they are not computer savvy. People tell us our distinct view of an issue circularly described Flow Chart PowerPoint templates are Fancy. Professionals tell us our concept PowerPoint templates and PPT Slides are the best it can get when it comes to presenting.

Ppt 3d Men Standing On New Business PowerPoint Presentation Pie Chart Templates
PPT 3d men standing on new business powerpoint presentation pie chart Templates-This 3D Business PowerPoint Diagram consists of men standing on circle representing their percentage of work and growth individually. This Diagram will fit for Business Presentations.-PPT 3d men standing on new business powerpoint presentation pie chart Templates-Adult, Art, Background, Business, Career, Chart, Communication, Concept, Conference, Corporate, Creative, Design, Economy, Executive, Finance, Group, Growth, Idea, Illustration, Leadership, Meeting, New, Occupation, Office, People, Person, Progress, Silhouette, Space, Speaking, Standing, Success

Diverging 11 Steps Around Globe Process Flow Circular Layout Chart PowerPoint Templates
We present our diverging 11 steps around globe process flow Circular Layout Chart PowerPoint templates.Download our Globe PowerPoint Templates because as a result we often end up with errors. Download and present our Business PowerPoint Templates because you are ready to flap your wings and launch off. All poised are you to touch the sky with glory. Download and present our Circle Charts PowerPoint Templates because It can Bubble and burst with your ideas. Use our Process and flows PowerPoint Templates because you will surely see all making the grade. Present our Flow charts PowerPoint Templates because you can present your opinions in this field using our impressive templates.Use these PowerPoint slides for presentations relating to Arrows, business, chart, circle, company,concept, continuity, continuous, cycle,dependency, diagram, direction,dynamic,endless, graph,iteration, iterative, method, path, phase,presentation, process, production,progress, progression, report, rotation,sequence. The prominent colors used in the PowerPoint template are Yellow, Blue, Gray. People tell us our diverging 11 steps around globe process flow Circular Layout Chart PowerPoint templates are Awesome. Professionals tell us our cycle PowerPoint templates and PPT Slides are Splendid. We assure you our diverging 11 steps around globe process flow Circular Layout Chart PowerPoint templates are Tasteful. PowerPoint presentation experts tell us our company PowerPoint templates and PPT Slides are Breathtaking. We assure you our diverging 11 steps around globe process flow Circular Layout Chart PowerPoint templates will make the presenter successul in his career/life. People tell us our concept PowerPoint templates and PPT Slides are Tasteful.

Graphical Illustration Of 5 Stages Flow Chart Circular Process PowerPoint Slides
We present our graphical illustration of 5 stages flow chart Circular Process PowerPoint Slides.Use our Circle Charts PowerPoint Templates because your business and plans for its growth consist of processes that are highly co-related. Use our Arrows PowerPoint Templates because you have analysed the illness and know the need. Use our Business PowerPoint Templates because your thoughts are pointed and sharp as arrows. Use our Shapes PowerPoint Templates because this slide can help to bullet point your views. Download our Flow Charts PowerPoint Templates because this diagram provides multiple options for taking in and making sense of information.Use these PowerPoint slides for presentations relating to agreeable, agreeableness, art, blue, business, chart, circle, clip, clipart, conscientiousness, diagram, extraversion, factor, five, flow, graph, graphic, green, illustration, infographic, model, neuroticism, openness, personality, pointed, process, psychological, psychology, red, segment, segmented, shape, stages, star, trait, transparency. The prominent colors used in the PowerPoint template are Orange, Yellow, Green. Customers tell us our graphical illustration of 5 stages flow chart Circular Process PowerPoint Slides are Precious. PowerPoint presentation experts tell us our art PowerPoint templates and PPT Slides are Upbeat. People tell us our graphical illustration of 5 stages flow chart Circular Process PowerPoint Slides are Precious. People tell us our business PowerPoint templates and PPT Slides are Elegant. Customers tell us our graphical illustration of 5 stages flow chart Circular Process PowerPoint Slides are Clever. People tell us our art PowerPoint templates and PPT Slides are Multicolored.
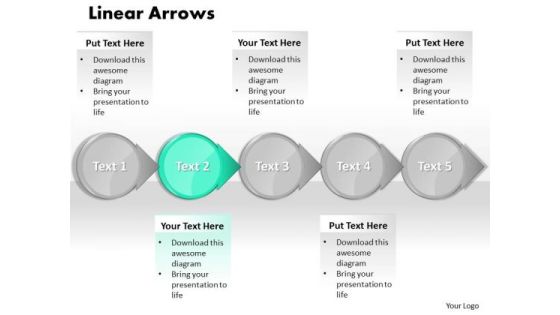
Ppt Cyan Circular Arrow Business PowerPoint Slide Text Download Process Chart Templates
PPT cyan circular arrow business powerpoint slide text download process chart Templates-This mechanical and industrial Diagram for PowerPoint features a 3D representation of interconnected Curved Arrows. Includes several predesigned layouts. Use this successive PowerPoint diagram to represent a series of interconnected ideas.-PPT cyan circular arrow business powerpoint slide text download process chart Templates-abstract, algorithm, arrow, arrow chart, block, block diagram, business, chart, connection, design, development, diagram, direction, element, flow, flowchart, graph, linear, management, organization, plan, process, program, section, segment, set, sign, solution, strategy, symbol, vector

Approach Avoidance Conflict Planned And Actual Velocity Project Burndown Chart Structure PDF
This slide provides the glimpse about the planned and actual velocity project burndown chart which showcase the impact of introducing issue escalation process in the company. Deliver an awe inspiring pitch with this creative approach avoidance conflict planned and actual velocity project burndown chart structure pdf bundle. Topics like planned and actual velocity project burndown chart can be discussed with this completely editable template. It is available for immediate download depending on the needs and requirements of the user.
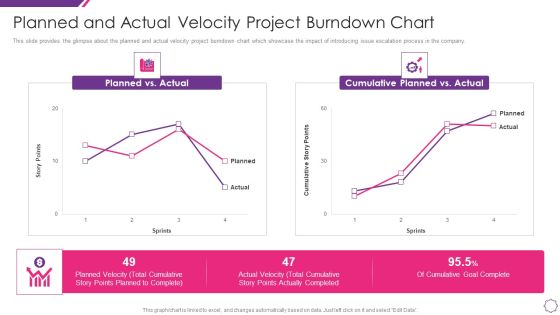
Handle Project Escalations Planned And Actual Velocity Project Burndown Chart Ppt Portfolio Outfit PDF
This slide provides the glimpse about the planned and actual velocity project burndown chart which showcase the impact of introducing issue escalation process in the company. Deliver an awe inspiring pitch with this creative handle project escalations planned and actual velocity project burndown chart ppt portfolio outfit pdf bundle. Topics like planned and actual velocity project burndown chart can be discussed with this completely editable template. It is available for immediate download depending on the needs and requirements of the user.
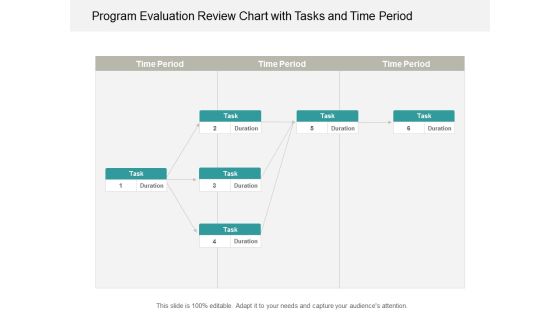
Program Evaluation Review Chart With Tasks And Time Period Ppt Powerpoint Presentation Portfolio Infographic Template
This is a program evaluation review chart with tasks and time period ppt powerpoint presentation portfolio infographic template. This is a six stage process. The stages in this process are pert chart, program evaluation and review technique, pert graph.

6 Stages Flow Diverging Process Arrows Relative Cycle Chart PowerPoint Slides
We present our 6 stages flow diverging process arrows Relative Cycle Chart PowerPoint Slides.Download and present our Boxes PowerPoint Templates because you understand the ailment and how to fight it. Download our Business PowerPoint Templates because this template can project the path to sucess that you have charted. Download our Arrows PowerPoint Templates because so that you can Lead the way to spread good cheer to one and all. Download and present our Circle Charts PowerPoint Templates because Our PowerPoint Templates and Slides offer you the widest possible range of options. Download our Flow Charts PowerPoint Templates because your group can behave steady in the top bracket.Use these PowerPoint slides for presentations relating to 3d, abstract, arrow, art, background, blank, business, chart, circle, concept, connection, cycle, development, diagram, direction, element, environment, exchange, finance, financial, flow, graph, graphic, graphic presentation, group, icon, illustration, investment, isolated, isometric, market, motion, movement, organization, passive income, perspective, process, process chart, recycle, report, ring, sign, step, stock, success, symbol, teamwork, text, vector. The prominent colors used in the PowerPoint template are Blue, Red, Yellow. Presenters tell us our 6 stages flow diverging process arrows Relative Cycle Chart PowerPoint Slides will save the presenter time. You can be sure our arrow PowerPoint templates and PPT Slides are Excellent. Professionals tell us our 6 stages flow diverging process arrows Relative Cycle Chart PowerPoint Slides are Handsome. People tell us our art PowerPoint templates and PPT Slides are Youthful. People tell us our 6 stages flow diverging process arrows Relative Cycle Chart PowerPoint Slides will make the presenter look like a pro even if they are not computer savvy. Professionals tell us our arrow PowerPoint templates and PPT Slides provide great value for your money. Be assured of finding the best projection to highlight your words.
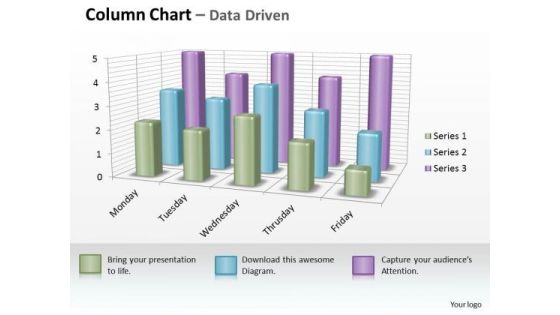
Examples Of Data Analysis Market 3d Business Inspection Procedure Chart PowerPoint Templates
However Dry Your Topic Maybe. Make It Catchy With Our examples of data analysis market 3d business inspection procedure chart Powerpoint Templates .
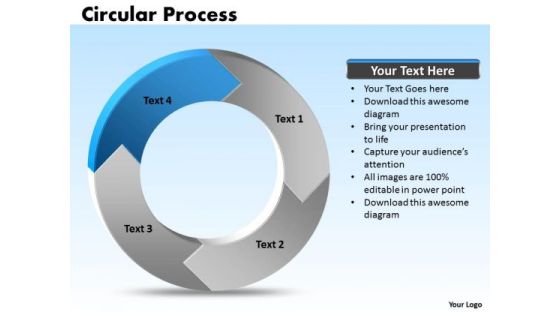
Ppt Edit Data PowerPoint Chart Processing Cycle Diagram 4 State Templates
PPT edit data powerpoint chart processing cycle diagram 4 state Templates-The above template has the theme of circular process Diagram. This image refers the concept of Act Cycle. Adjust the above image in your PPT presentations to visually support your content in your business meetings. This PPT images is so perfectly designed that it make your clients understand the business idea quickly and visually.-PPT edit data powerpoint chart processing cycle diagram 4 state Templates-Arrow, Chart, Circular, Color, Colorful, Connect, Connection, Design, Diagram, Finance, Graphic, Group, Growth, Icon, Illustration, Marketing, Pieces, Process, Recycle, Recycling, Round, Set, Strategy, Symbol, Wheel
Project Task Planning And Evaluation Chart Ppt Powerpoint Presentation Icon Slide
This is a project task planning and evaluation chart ppt powerpoint presentation icon slide. This is a nine stage process. The stages in this process are pert chart, program evaluation and review technique, pert graph.

Ppt Circle Arrow Free Business Presentation Process Flow Chart PowerPoint Templates
PPT circle arrow free business presentation process flow chart PowerPoint Templates-This Business Oriented Chart will definitely help you to be more Successful. Use this graphics as key element in streamlining your plans. It consists of Circular Arrows connected together to form a complete Process.-PPT circle arrow free business presentation process flow chart PowerPoint Templates-abstract, access, arrow, background, banner, blue, bright, business, chart, circle, colorful, concept, corporate, creative, cycle, design, different, element, frame, graphic, group, idea, illustration, process, shape, speech, strategy, symbol, template, text, usable, vector
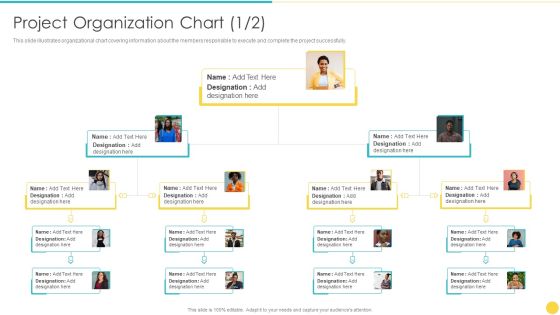
Project Management Professional Toolset IT Project Organization Chart Execute Introduction PDF
Following slide portrays organizational chart covering information about the members responsible to execute and complete the project successfully. Presenting project management professional toolset it project organization chart execute introduction pdf to provide visual cues and insights. Share and navigate important information on two stages that need your due attention. This template can be used to pitch topics like project organization chart. In addtion, this PPT design contains high resolution images, graphics, etc, that are easily editable and available for immediate download.

Program Evaluation Chart From Start To Finish Ppt Powerpoint Presentation Professional Examples
This is a program evaluation chart from start to finish ppt powerpoint presentation professional examples. This is a three stage process. The stages in this process are pert chart, program evaluation and review technique, pert graph.

Ppt Group Of People Pie Chart Person Standing Purple Piece PowerPoint Templates
PPT group of people pie chart person standing purple piece PowerPoint Templates-This continual illustration of procedure graphic is a visual representation of your information and ideas. Use this diagram as a method of graphically representing the flow of data as an information processing system.-PPT group of people pie chart person standing purple piece PowerPoint Templates-arrow, bar, business, businessman, candidate, cartoon, character, chart, circle, circular, client, communication, company, concept, diagram, finance, growth, human, illustration, increase, information, marketing, person, presentation, process, profit, sales, stats, success, target
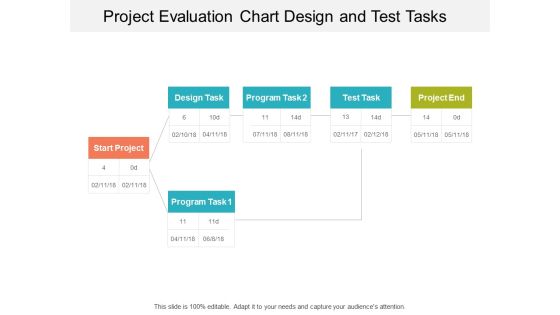
Project Evaluation Chart Design And Test Tasks Ppt Powerpoint Presentation Show Graphics Design
This is a project evaluation chart design and test tasks ppt powerpoint presentation show graphics design. This is a three stage process. The stages in this process are pert chart, program evaluation and review technique, pert graph.

Clustered Bar Chart Percentage Product Ppt PowerPoint Presentation Portfolio Example Introduction
This is a clustered bar chart percentage product ppt powerpoint presentation portfolio example introduction. This is a three stage process. The stages in this process are area chart, finance, marketing, management, investment.
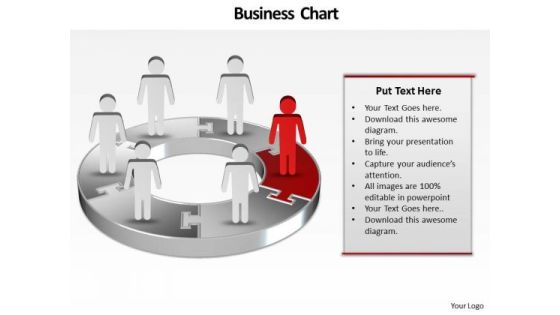
Ppt Illustration Of 3d PowerPoint Bar Chart With Standing Business People Templates
PPT illustration of 3d powerpoint bar chart with standing business people Templates-Develop competitive advantage with our above template which contains a diagram of one pie chart with cartoon men on it.This structure of our templates allows you to effectively highlight the key issues concerning to your business.-PPT illustration of 3d powerpoint bar chart with standing business people Templates-Adult, Art, Background, Business, Career, Chart, Communication, Concept, Conference, Corporate, Creative, Design, Economy, Executive, Finance, Group, Growth, Idea, Illustration, Leadership, Meeting, New, Occupation, Office, People, Person, Progress, Silhouette, Space, Speaking, Standing, Success

Chart For Business Growth Strategy Ppt Developing Plan Template PowerPoint Templates
Doll up your thoughts with our chart for business growth strategy ppt developing plan template PowerPoint templates. They will make a pretty picture.

Ppt Illustration Of 3d Create Pie Chart With Standing Business Persons PowerPoint Templates
PPT illustration of 3d create pie chart with standing business persons PowerPoint Templates-Emphatically define your message with our above template which contains a graphic 3d pie chart with animated men. This image represents the concept of Business Meetings, Conferences etc. This Diagram is designed to attract the attention of your audience.-PPT illustration of 3d create pie chart with standing business persons PowerPoint Templates-Adult, Art, Background, Business, Career, Chart, Communication, Concept, Conference, Corporate, Creative, Design, Economy, Executive, Finance, Group, Growth, Idea, Illustration, Leadership, Meeting, New, Occupation, Office, People, Person, Progress, Silhouette, Space, Speaking, Standing, Success
Steps For Successful Brand Building Process Bar Chart Ppt Portfolio Icon PDF
Presenting this set of slides with name steps for successful brand building process bar chart ppt portfolio icon pdf. The topics discussed in these slide is bar chart. This is a completely editable PowerPoint presentation and is available for immediate download. Download now and impress your audience.

Ppt Layout Of 3d Pie Chart With Standing Busines Men PowerPoint Templates
PPT layout of 3d pie chart with standing busines men PowerPoint Templates-Present your views using this innovative 3d Pie chart and be assured of leaving a lasting impression. Create visually stunning and define your PPT Presentations in a unique and inspiring manner by using our above template.-PPT layout of 3d pie chart with standing busines men PowerPoint Templates-Adult, Art, Background, Business, Career, Chart, Communication, Concept, Conference, Corporate, Creative, Design, Economy, Executive, Finance, Group, Growth, Idea, Illustration, Leadership, Meeting, New, Occupation, Office, People, Person, Progress, Silhouette, Space, Speaking, Standing, Success
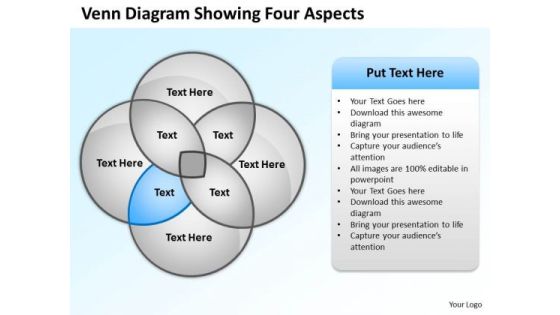
Business Organizational Chart Template Venn Diagram Showing Four Aspects PowerPoint Slides
We present our business organizational chart template venn diagram showing four aspects PowerPoint Slides.Use our Ring Charts PowerPoint Templates because Your audience will believe you are the cats whiskers. Download our Circle Charts PowerPoint Templates because You are well armed with penetrative ideas. Our PowerPoint Templates and Slides will provide the gunpowder you need. Download and present our Process and Flows PowerPoint Templates because They will Put your wonderful verbal artistry on display. Our PowerPoint Templates and Slides will provide you the necessary glam and glitter. Download and present our Flow Charts PowerPoint Templates because Our PowerPoint Templates and Slides help you meet the demand of the Market. Just browse and pick the slides that appeal to your intuitive senses. Download our Business PowerPoint Templates because Our PowerPoint Templates and Slides will let you Illuminate the road ahead to Pinpoint the important landmarks along the way.Use these PowerPoint slides for presentations relating to Business, button, catalog, chart, circle, company, cross, data, design, diagram, direction, document, financial, four, glossy, goals, graph, junction, management, market, marketing, model, multicolored, multiple, navigation, network, options, plan, presentation, process, purple, results, shiny, sphere, statistics. The prominent colors used in the PowerPoint template are Blue light, White, Gray. People tell us our business organizational chart template venn diagram showing four aspects PowerPoint Slides are effectively colour coded to prioritise your plans They automatically highlight the sequence of events you desire. PowerPoint presentation experts tell us our data PowerPoint templates and PPT Slides will impress their bosses and teams. Presenters tell us our business organizational chart template venn diagram showing four aspects PowerPoint Slides will generate and maintain the level of interest you desire. They will create the impression you want to imprint on your audience. Use our data PowerPoint templates and PPT Slides are effectively colour coded to prioritise your plans They automatically highlight the sequence of events you desire. Customers tell us our business organizational chart template venn diagram showing four aspects PowerPoint Slides are specially created by a professional team with vast experience. They diligently strive to come up with the right vehicle for your brilliant Ideas. People tell us our chart PowerPoint templates and PPT Slides are incredible easy to use.

Diverging And Converging Process 8 Stages Cycle Layout Chart PowerPoint Slides
We present our diverging and converging process 8 stages Cycle Layout Chart PowerPoint Slides.Download our Flow charts PowerPoint Templates because our PowerPoint templates give this step by step process to acheive the aim. Use our Business PowerPoint Templates because you can Lead your flock steadily to greater heights. Look around at the vast potential of achievement around you. Present our Arrows PowerPoint Templates because with the help of our Slides you can Illustrate your ideas one by one and demonstrate how each is an important cog in running the entire wheel. Use our Process and flows PowerPoint Templates because our templates illustrates your ability. Use our Ring charts PowerPoint Templates because they are logical, accurate and to the point.Use these PowerPoint slides for presentations relating to Abstract, arrows, blank, business,central, centralized, chart, circle, circular,circulation, concept, conceptual,converging, design, diagram, empty,executive, icon, idea, illustration,management, map, mapping, mba,model, numbers, organization, outwards,pointing, procedure, process, radial,radiating, relationship. The prominent colors used in the PowerPoint template are Orange, Gray, White. People tell us our diverging and converging process 8 stages Cycle Layout Chart PowerPoint Slides are Appealing. Professionals tell us our business PowerPoint templates and PPT Slides provide great value for your money. Be assured of finding the best projection to highlight your words. We assure you our diverging and converging process 8 stages Cycle Layout Chart PowerPoint Slides are Precious. PowerPoint presentation experts tell us our circular PowerPoint templates and PPT Slides are Vintage. We assure you our diverging and converging process 8 stages Cycle Layout Chart PowerPoint Slides are Functional. People tell us our chart PowerPoint templates and PPT Slides are Classic.
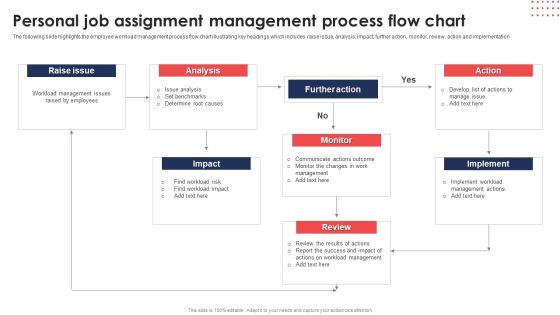
Personal Job Assignment Management Process Flow Chart Ppt Professional Picture PDF
The following slide highlights the employee workload management process flow chart illustrating key headings which includes raise issue, analysis, impact, further action, monitor, review, action and implementation. Presenting Personal Job Assignment Management Process Flow Chart Ppt Professional Picture PDF to dispense important information. This template comprises one stages. It also presents valuable insights into the topics including Raise Issue, Analysis, Further Action, Monitor. This is a completely customizable PowerPoint theme that can be put to use immediately. So, download it and address the topic impactfully.

Chart Showing Performance Improvement On Voc Process Implementation Ppt PowerPoint Presentation Icon Layouts PDF
Showcasing this set of slides titled chart showing performance improvement on voc process implementation ppt powerpoint presentation icon layouts pdf. The topics addressed in these templates are chart showing performance improvement on voc process implementation. All the content presented in this PPT design is completely editable. Download it and make adjustments in color, background, font etc. as per your unique business setting.
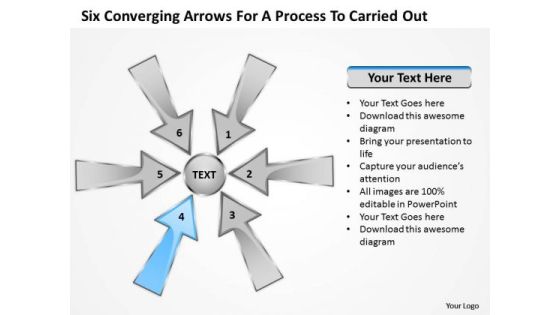
Six Coverging Arrow For Process To Carried Out Circular Chart PowerPoint Slides
We present our six coverging arrow for process to carried out Circular Chart PowerPoint Slides.Download and present our Arrows PowerPoint Templates because you can Focus on each one and investigate which one would be the best fit for your needs. Download and present our Circle Charts PowerPoint Templates because they are the tools that helped most of us evolve. Use our Shapes PowerPoint Templates because our template will help pinpoint their viability. Use our Business PowerPoint Templates because the majestic tiger lord of all it surveys.It exudes power even when it is in repose. Download our Flow Charts PowerPoint Templates because there is a vision, a need you can meet.Use these PowerPoint slides for presentations relating to 6, abstract, arrows, blank, business, central, centralized, chart, circle, circular, circulation, concept, conceptual, converging, design, diagram, empty, executive, icon, idea, illustration, management, map, mapping, mba, model, numbers, organization, outwards, pointing, procedure, process, radial, radiating, relationship, resource, sequence, sequential, six, square, strategy, template. The prominent colors used in the PowerPoint template are Blue, Gray, Black. Presenters tell us our six coverging arrow for process to carried out Circular Chart PowerPoint Slides are Wistful. The feedback we get is that our central PowerPoint templates and PPT Slides are Quaint. Presenters tell us our six coverging arrow for process to carried out Circular Chart PowerPoint Slides are Nice. You can be sure our chart PowerPoint templates and PPT Slides are Dazzling. People tell us our six coverging arrow for process to carried out Circular Chart PowerPoint Slides are Magnificent. PowerPoint presentation experts tell us our blank PowerPoint templates and PPT Slides are Nostalgic.

Business Circle Chart PowerPoint Templates Business Market Research Data Ppt Slides
Business Circle Chart PowerPoint Templates Business market research data PPT Slides-\nThis PowerPoint diagram slide shows a circular process withan arrow. Useful to represent process slides-Business Circle Chart PowerPoint Templates Business market research data PPT Slides-This template can be used for presentations relating to 3d, Abstract, Around, Arrow, Background, Bright, Business, Card, Chart, Circle, Circular, Circulation, Collection, Colorful, Communication, Concept, Cycle, Cyclic, Design, Direction, Element, Flow, Glass, Glossy, Graphic, Icon, Illustration, Modern, Motion, Network

Column Chart Template 2 Ppt PowerPoint Presentation Infographic Template Example Introduction
This is a column chart template 2 ppt powerpoint presentation infographic template example introduction. This is a two stage process. The stages in this process are column chart, finance, analysis, marketing, strategy.
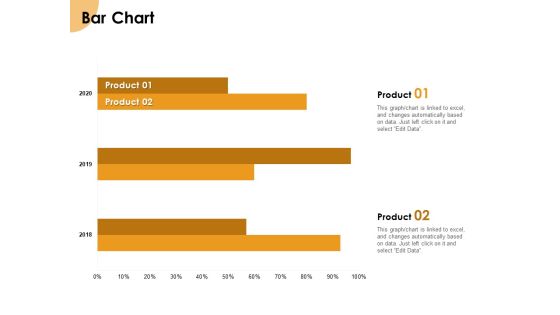
Growth Strategy And Growth Management Implementation Bar Chart Ppt Slides Graphics PDF
Presenting this set of slides with name growth strategy and growth management implementation bar chart ppt slides graphics pdf. The topics discussed in these slide is bar chart. This is a completely editable PowerPoint presentation and is available for immediate download. Download now and impress your audience.

Sustainable Competitive Advantage Management Strategy Bar Chart Ppt Inspiration Microsoft PDF
Presenting this set of slides with name sustainable competitive advantage management strategy bar chart ppt inspiration microsoft pdf. The topics discussed in these slide is bar chart. This is a completely editable PowerPoint presentation and is available for immediate download. Download now and impress your audience.
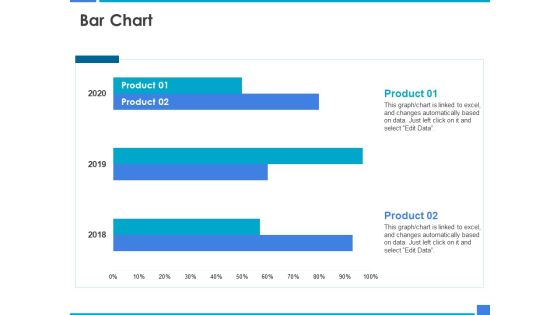
Product Strategy And Product Management Implementation Bar Chart Ppt Pictures Samples PDF
Presenting this set of slides with name product strategy and product management implementation bar chart ppt pictures samples pdf. The topics discussed in these slide is bar chart. This is a completely editable PowerPoint presentation and is available for immediate download. Download now and impress your audience.
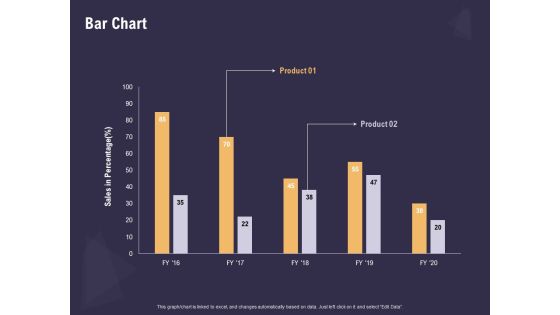
Effective Workforce Management Bar Chart Ppt PowerPoint Presentation Inspiration Brochure PDF
Presenting this set of slides with name effective workforce management bar chart ppt powerpoint presentation inspiration brochure pdf. The topics discussed in these slide is bar chart. This is a completely editable PowerPoint presentation and is available for immediate download. Download now and impress your audience.
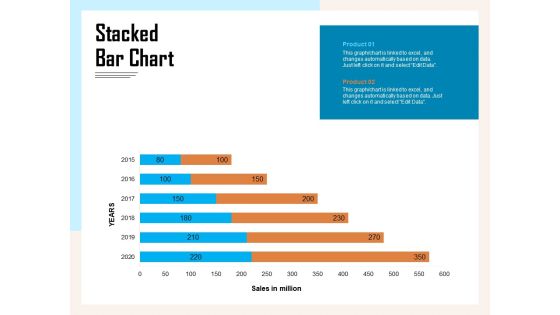
Managing Agriculture Land And Water Stacked Bar Chart Ppt Model Skills PDF
Presenting this set of slides with name managing agriculture land and water stacked bar chart ppt model skills pdf. The topics discussed in these slide is stacked bar chart. This is a completely editable PowerPoint presentation and is available for immediate download. Download now and impress your audience.
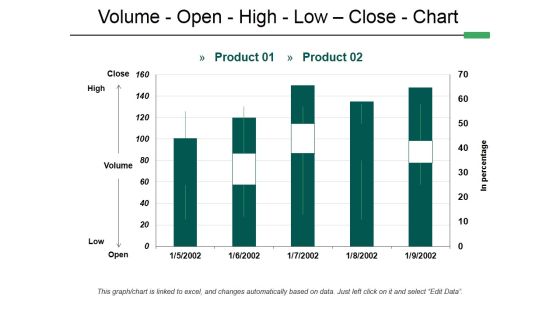
Volume Open High Low Close Chart Ppt PowerPoint Presentation Infographic Template Guidelines
This is a volume open high low close chart ppt powerpoint presentation infographic template guidelines. This is a two stage process. The stages in this process are volume, open, high, low, close, chart.

Area Chart Finance Marketing Ppt PowerPoint Presentation Infographic Template Master Slide
This is a area chart finance marketing ppt powerpoint presentation infographic template master slide. This is a three stage process. The stages in this process are area chart, finance, marketing, analysis, investment.
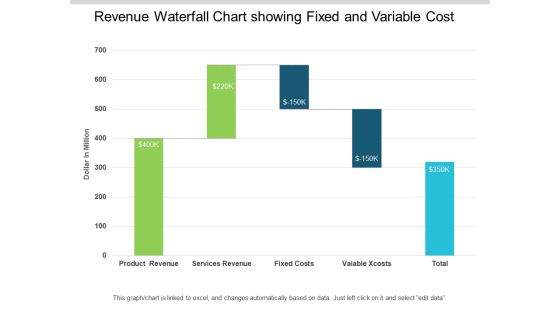
Revenue Waterfall Chart Showing Fixed And Variable Cost Ppt PowerPoint Presentation Infographic Template Images
This is a revenue waterfall chart showing fixed and variable cost ppt powerpoint presentation infographic template images. This is a five stage process. The stages in this process are sales waterfall, waterfall chart, business.

Area Chart Ppt PowerPoint Presentation Inspiration Icons Ppt PowerPoint Presentation Professional File Formats
This is a area chart ppt powerpoint presentation inspiration icons ppt powerpoint presentation professional file formats. This is a two stage process. The stages in this process are area chart, product, percentage, business, growth.
Waterfall Chart Showing Effective Pricing And Profitability Insight Ppt PowerPoint Presentation Icon Graphics
This is a waterfall chart showing effective pricing and profitability insight ppt powerpoint presentation icon graphics. This is a seven stage process. The stages in this process are sales waterfall, waterfall chart, business.
